Growing stock volumes
Growing stock volumes reflect the amount of standing wood contained within a forest (see methodology for a description of the growing stock volume measures used).
Growing stock volume totals have changed slightly since the 2016 report, primarily due to the increase in available data and the complete refresh of provincial inventories. However, volume remained relatively constant over the past thirty years, ranging from 4.3 to 4.8 billion cubic metres within designated management units. The most visible changes are the steady increase in non-commercial species as they are accounted for in more detail.
Growing stock volumes in Ontario – quick facts
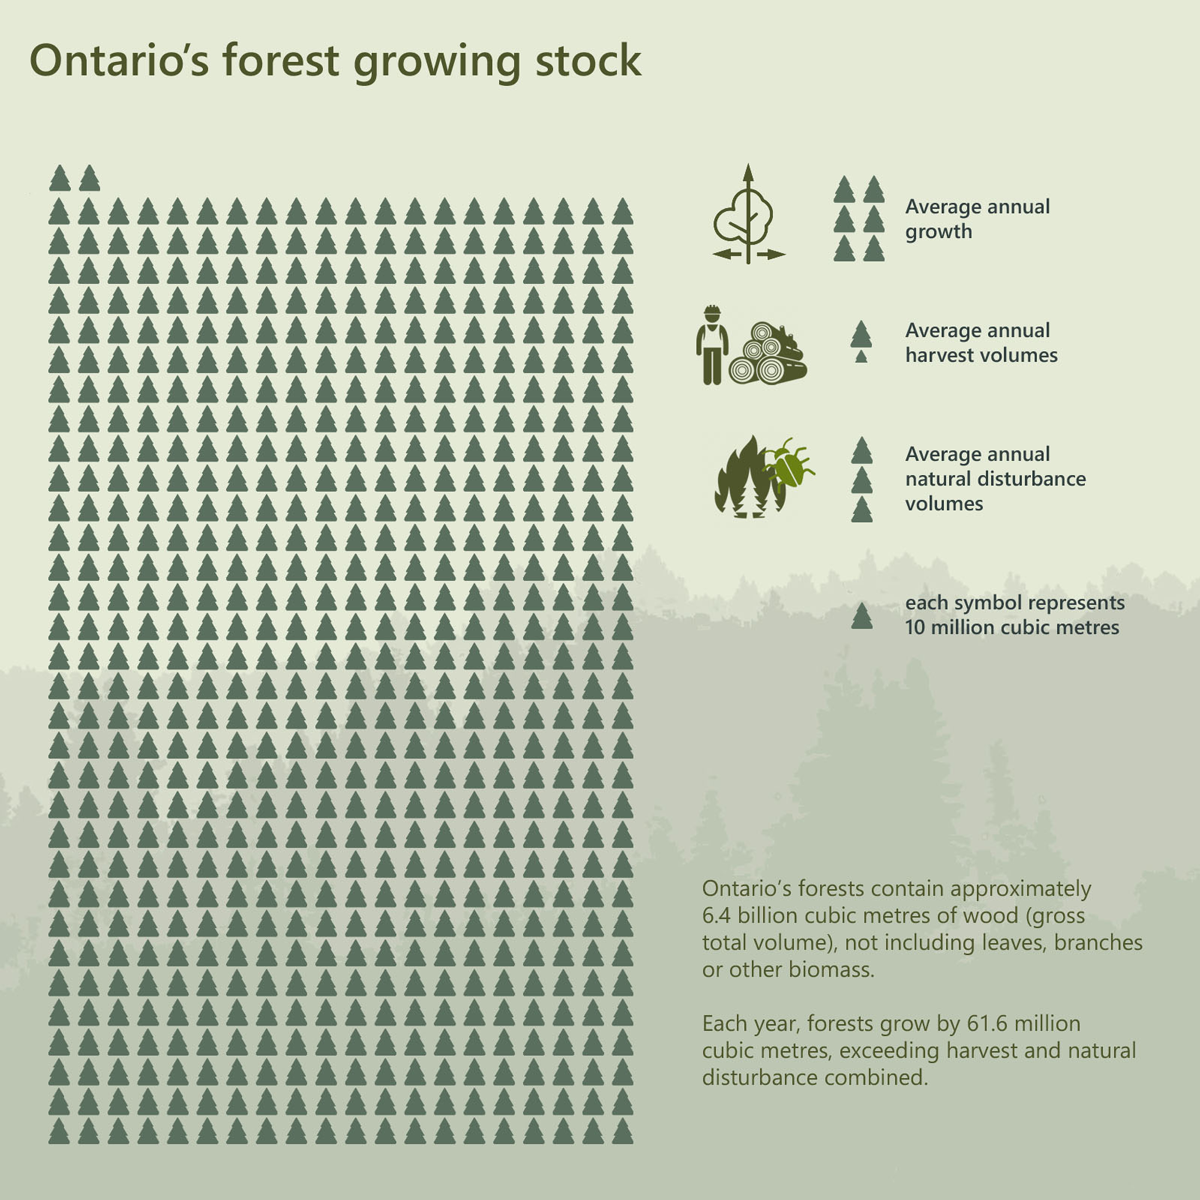
61.6 million m3 – Ontario’s forests grow this much annually
6.4 billion m3 – Ontario’s forests contain this much wood
56% of Ontario’s forest volume is Crown managed
14 million m3 average annual harvest in Ontario
28 million m3 average annual natural disturbance volume loss
| Land class | Crown | Parks & protected areas | Other owners | Total |
|---|---|---|---|---|
| All Ontario – GTV | 4,426,912,356 | 865,635,786 | 1,129,180,666 | 6,421,728,808 |
| All Ontario – NMV | 2,719,578,375 | 747,473,564 | 555,519,625 | 4,022,571,564 |
| All Ontario – CAI | 44,655,906 | 6,790,727 | 10,181,673 | 61,628,305 |
| MFZ – GTV | 3,611,637,293 | 653,692,853 | 690,713,699 | 4,956,043,845 |
| MFZ – NMV | 2,215,504,626 | 424,443,810 | 443,337,761 | 3,083,286,197 |
| MFZ – CAI | 36,206,468 | 4,857,319 | 6,394,588 | 47,458,375 |
| Species | Crown | Parks & protected areas | Other owners | Total |
|---|---|---|---|---|
| White pine | 136,185,859 | 43,166,437 | 75,391,411 | 254,743,708 |
| Red pine | 46,143,995 | 15,720,216 | 19,041,904 | 80,906,115 |
| Jack pine | 587,979,621 | 143,261,758 | 28,635,487 | 759,876,866 |
| Black spruce | 1,683,645,317 | 306,435,272 | 107,080,741 | 2,097,161,330 |
| White spruce | 103,401,880 | 17,986,033 | 36,294,231 | 157,682,144 |
| Balsam fir | 188,462,778 | 32,312,344 | 56,716,234 | 277,491,356 |
| Cedar | 92,539,011 | 15,124,021 | 52,651,038 | 160,314,069 |
| Larch | 154,854,955 | 20,243,708 | 18,787,958 | 193,886,620 |
| Hemlock | 20,046,996 | 7,282,822 | 23,314,805 | 50,644,623 |
| Other conifers | 48,599 | 10,503 | 954,984 | 1,014,086 |
| Poplar | 810,507,078 | 127,286,581 | 249,235,561 | 1,187,029,219 |
| White birch | 345,189,732 | 66,713,469 | 63,618,466 | 475,521,667 |
| Hard maple | 109,110,907 | 26,805,856 | 164,444,450 | 300,361,212 |
| Soft maple | 61,177,725 | 18,047,216 | 82,162,036 | 161,386,977 |
| Yellow birch | 39,794,735 | 10,953,470 | 31,256,809 | 82,005,013 |
| Ash | 10,489,449 | 3,144,357 | 28,639,196 | 42,273,003 |
| Oak | 26,470,079 | 9,336,131 | 49,213,493 | 85,019,702 |
| Basswood | 2,837,312 | 436,675 | 15,170,093 | 18,444,080 |
| Beech | 6,655,549 | 1,119,819 | 15,806,437 | 23,581,805 |
| Other hardwoods | 1,370,779 | 249,100 | 10,765,333 | 12,385,212 |
| Total: | 4,426,912,356 | 865,635,786 | 1,129,180,666 | 6,421,728,808 |
Visual display
Tables and supporting data are available on the Ontario Data Catalogue. To support representation of complex data, a variety of tables, charts and maps are available in a visualization format.
View data visualization - Ontario’s forest growing stock
| Category | Volume (cubic metres) |
|---|---|
| Forest growing stock | 6,421,728,808.03 |
| Average annual growth | 61,628,305.36 |
| Average annual harvest volumes | 14,154,810.37 |
| Average annual natural disturbance volumes | 27,722,427.77 |