Population counts: Canada, Ontario and regions
Raw census counts and net undercoverage
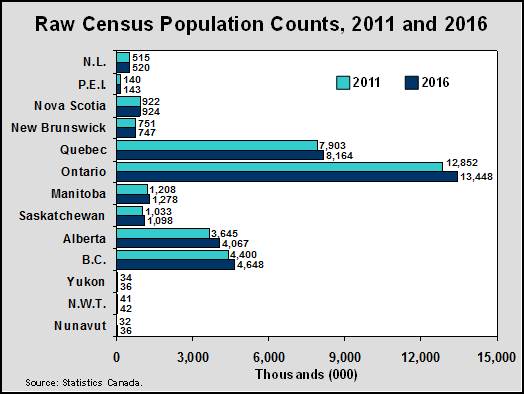
On February 8, 2017, Statistics Canada released the first population counts from the 2016 Census. The Census counted 35.15 million people in Canada and 13.45 million in Ontario on May 10, 2016.
While the goal of the Census is to count every resident on Census day, this falls short in two ways. Undercoverage occurs when people are missed by the Census. Overcoverage occurs when people are counted when they should not be, or counted more than once. Since undercoverage is often larger than overcoverage, net undercoverage is usually positive.
Historically, Ontario usually has one of the highest net undercoverage rates among the provinces. For the 2006 Census, Ontario’s net undercoverage rate was 3.7% (466,000 people missed). For 2011, the rate was 2.9% (370,000 people missed).
Estimates of net undercoverage for the 2016 Census will not be available until the coverage studies have been completed (2018). If the net undercoverage is in the range observed in the previous Census, the adjusted estimate of the 2016 population for Ontario should be between 13.8 and 14.0 million.
Population growth by province
The estimate of the total population in Ontario on July 1, 2016 is 14.0 million.
Because of net undercoverage, this fact sheet looks largely at shares and growth rates between the 2011 and 2016 Censuses rather than population levels.
All provinces and territories experienced population growth between 2011 and 2016, with the exception of New Brunswick.
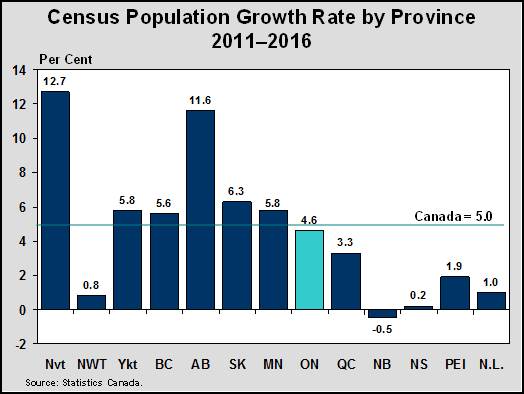
Between the 2011 and 2016 Censuses, Canada’s population grew 1.68 million or 5.0%. About 36% of the national growth occurred in Ontario. Ontario population grew 4.6%, modestly lower than the national growth rate.
Nunavut and Alberta had the fastest population growth, at 12.7% and 11.6 percent, followed by Saskatchewan (6.3%), British Columbia (5.8%) and the Yukon (5.8%).
The population of New Brunswick declined by 0.5%.
Population growth varied significantly across census divisions
Twelve of the 49 census divisions (CDs) in Ontario had a population growth rate higher than the rate for the province as a whole between 2011 and 2016. The fastest-growing CD was Kenora at 13.8%.
By contrast, eight out of the 49 census divisions experienced population declines; five of these were in the North. The rate of decline was largest in Prince Edward, at -2.1%.
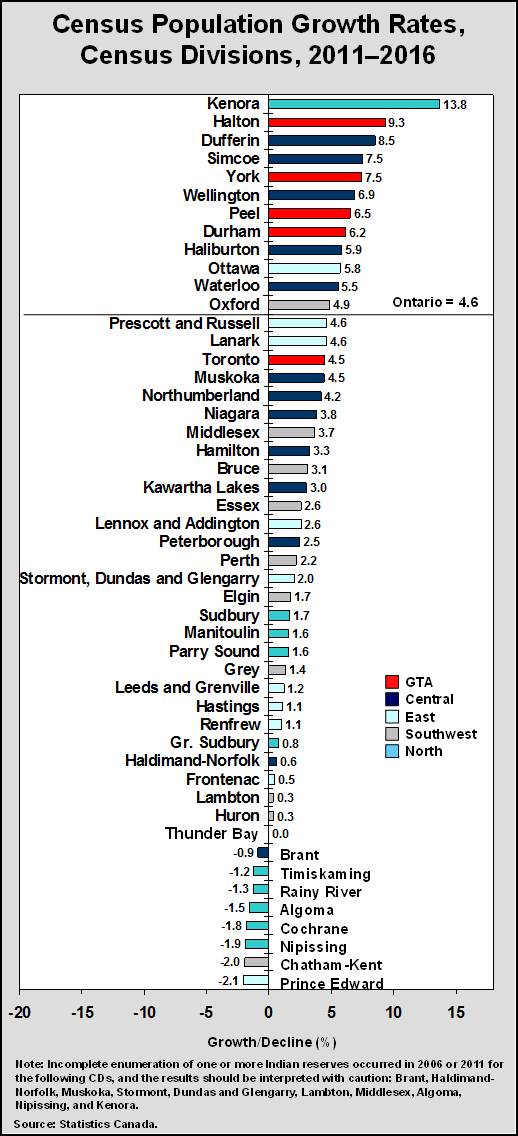
Three-quarters (75%) of Ontario’s population growth between 2011 and 2016 was concentrated in just seven Census Divisions, including all five CDs of the Greater Toronto Area (GTA), plus Ottawa and Simcoe.
Note: Incomplete enumeration of one or more Indian reserves occurred in 2011 or 2016 for the following CDs, and the results should be interpreted with caution: Brant, Haldimand-Norfolk, Muskoka, Stormont, Dundas and Glengarry, Lambton, Middlesex, Algoma, Nipissing, and Kenora.
GTA Continues to grow rapidly
Between 2011 and 2016, the GTA’s population increased 6.0%. Its population growth accounted for 60.9% of Ontario’s total population growth over the period, less than the share of growth during the 2006-2011 period (72.1%).
About 47.7% of the provincial population lived in the GTA in 2016, up slightly from 47.1% in 2011. All other regions saw slight declines in their shares of provincial population.
Regional population growth
Central Ontario’s population grew 4.5% over the period, accounting for 21.2% of provincial growth.
The population of Eastern Ontario also saw a healthy growth of 3.8% between 2011 and 2016, accounting for 10.9% of provincial growth.
Population grew by 2.4% in the Southwest over the 2011-2016 period. This region accounted for 6.2% of Ontario’s growth.
Northern Ontario’s population grew slightly by 0.6% between 2011 and 2016. Its share of provincial population fell to 5.8% from 6.0% in 2011.
Within the North, five CDs saw growth: Kenora, Sudbury, Manitoulin, Parry Sound and Greater Sudbury.
Large urban centres continue to grow faster
Over the 2011–2016 period, 92% of Ontario’s total population growth occurred within the 16 Census Metropolitan Areas (CMAs) of the province.
A Census Metropolitan Area is formed by one or more adjacent municipalities centred on a large urban core. A CMA has a total population of at least 100,000 of which 50,000 or more must live in that core.
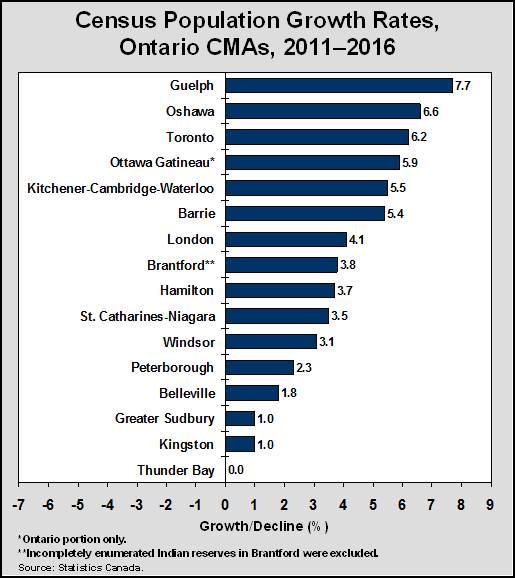
The Guelph CMA was the fastest-growing CMA in Ontario between 2011 and 2016, with a population rising by 7.7% over the period, followed by Oshawa (6.6%), Toronto (6.2%), and the Ontario part of Ottawa-Gatineau (5.9%).
Between 2011 and 2016 six CMAs in other provinces grew faster than the Guelph CMA: Calgary (14.6%), Edmonton (13.9%), Saskatoon (12.5%), Regina (11.8%), Lethbridge (10.8%), and Kelowna (8.4%).
Saint John N.B. (-2.2%) was the only CMA in Canada experiencing population decline over the period.
Ontario's mid-size urban centres
In addition to the 16 CMAs, there are 29 midsize urban centres in Ontario designated as Census Agglomerations (CAs). These are urban areas that have an urban core with a population between 10,000 and 50,000.
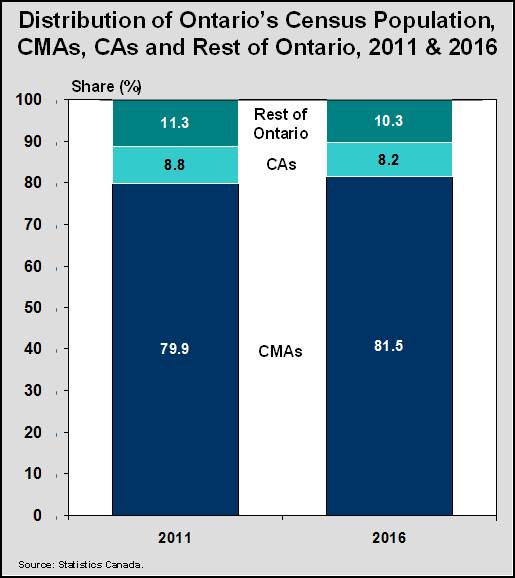
In 2016, 8.2% of Ontarians lived in CAs, down slightly from 8.8% in 2011.
Wasaga Beach (17.9%) and Collingwood (13.3%) were the two fastest-growing CAs in Ontario over the 2006-2011 period.
A total of twelve CAs experienced small or moderate population declines between 2011 and 2016. Five of these CAs were located in the North: Elliot Lake (-5.3%), Timmins (-3.2%), North Bay (-2.6%), Sault Ste. Marie (-2.1%) and Kenora (-1.6%). Four were in the Southwest: Chatham-Kent (-2.0%), Leamington (-1.2%), Sarnia (-1.0%) and Owen Sound (-0.8%). Finally, three were in Eastern Ontario: Pembroke (-3.1%), the Ontario part of Hawkesbury (-2.7%) and Brockville (-1.2%).
Accessible image descriptions
Raw census population counts, 2011 and 2016
This chart shows the raw Census population counts for each province and territory in 2011 and 2016. Ontario’s 2011 raw count was 12,852,000 in 2011, and 13,448,000 in 2016.
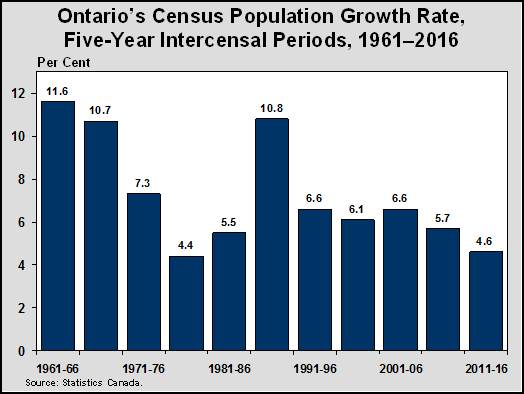
Ontario’s census population growth rate, five-year intercensal periods, 1961–2016
This chart shows Ontario’s Census population growth rate by five-year period from 1961 to 2016. The periods of highest growth were in 1961-1966 at 11.6% and in 1986-1991 at 10.8%. The periods of slowest growth were in 1976-1981 at 4.4% and in 2011-2016 at 4.6%.
Census population growth rate by province 2011–2016
This chart shows the Census population growth rate for provinces and territories over the 2011-2016 period. Over this time frame, Canada grew by 5.0%, and Ontario by 4.6%. Alberta was the fastest-growing province at 11.6%. New Brunswick was the only jurisdiction that saw a population decline, at -0.5%.
Census population growth rates, census divisions, 2011–2016
This chart shows the Census population growth rates for each census division in Ontario over the 2011-2016 period. The fastest-growing census divisions were Kenora at 13.8%, Halton at 9.3%, and Dufferin at 8.5%. The census divisions that saw the fastest population declines were Prince Edward at -2.1%, Chatham-Kent at -2.0%, and Nipissing at -1.9%. Ontario as a whole grew 4.6% over the period.
Census population growth rates, Ontario CMAs, 2011–2016
This chart shows the Census population growth rates for Ontario Census Metropolitan Areas (CMAs) over the 2011-2016 period. The fastest-growing CMAs were Guelph at 7.7%, Oshawa at 6.6% and Toronto at 6.2%. The slowest-growing CMAs were Thunder Bay at 0.0%, Kingston at 1.0%, and Greater Sudbury at 1.0%.
Distribution of Ontario’s census population, CMAs, CAs and rest of Ontario, 2011 & 2016
This chart shows the share of Ontario’s total population accounted for by Census Metropolitan Areas (CMAs), Census Agglomerations (CAs) and the rest of the province in both 2011 and 2016. CMAs accounted for 79.9% for the population in 2011 and 81.5% in 2016. CAs accounted for 8.8% of the population in 2011 and 8.2% in 2016. The rest of the province accounted for 11.3% of the population in 2011 and 10.3% in 2016.