Aboriginal peoples of Ontario
This factsheet looks at the 2016 Census data on the Aboriginal peoples of Canada released by Statistics Canada.
Ontario’s Aboriginal population
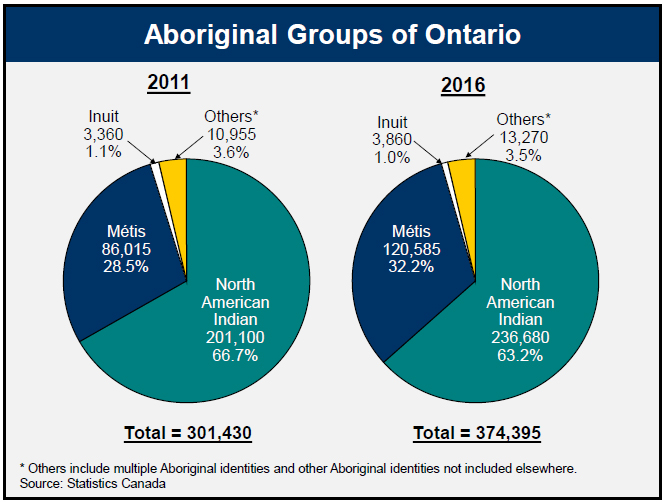
In the 2016 census, 374,395 people self-identified as Aboriginal persons in Ontario. This represented 2.8% of the province’s total population, an increase from 2.4% in 2011.
North American Indians accounted for a majority of the Aboriginal population, representing 63.2% in 2016, down from 66.7% in 2011. The Métis followed at 32.2% (up from 28.5% in 2011), and the Inuit at 1.0% (down from 1.1% in 2011).
Between 2011 and 2016, Ontario’s Aboriginal population grew 23.1%, much faster than the non-Aboriginal population, which grew by 4.2%. Several factors may account for the faster growth, both demographic and non-demographic (e.g. more individuals choosing to identify themselves as an Aboriginal person).
Of the three Aboriginal groups, the fastest gains in population between 2011 and 2016 occurred among the Métis, increasing 40.2%. The number of people identifying as North American Indian and Inuit rose by 15.6% and 15.1%, respectively.
One in six Aboriginal people lived on reserves
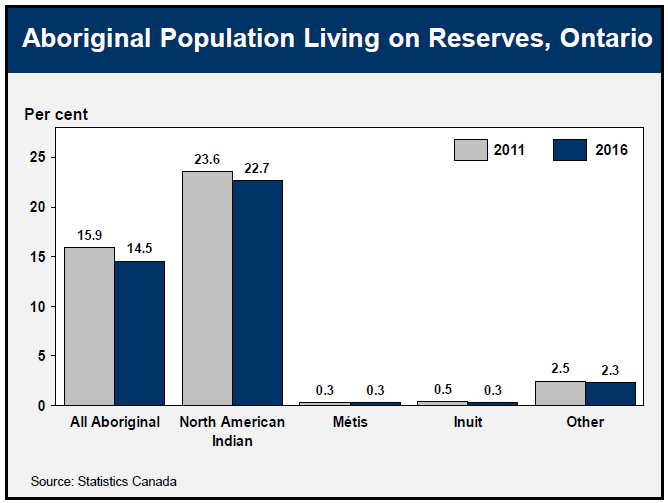
14.5% of all Aboriginal people in Ontario lived on reserves in 2016, down from 15.9% in 2011. Of those on reserves, nearly all (99%) were North American Indian, virtually unchanged from 2011. Within the North American Indian population, 22.7% lived on reserves in 2016, down from 23.6% in 2011.
The Aboriginal population is relatively younger
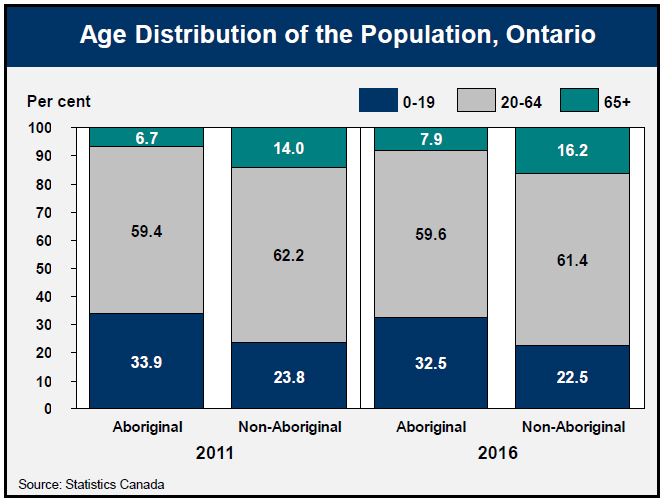
The Aboriginal population is younger than the non-Aboriginal population. Almost a third (32.5%) of the Aboriginal population consists of children and teenagers aged 19 and under, compared with 22.5% for the non-Aboriginal population. The share of seniors in the Aboriginal people in 2016 increased to 7.9% from 6.7% in 2011, but was less than half the share of seniors in the non-Aboriginal population (16.2%).
The Aboriginal population across Canada
The number of Canadians identifying as Aboriginal increased from 1,400,685 in 2011 to 1,673,780 in 2016.
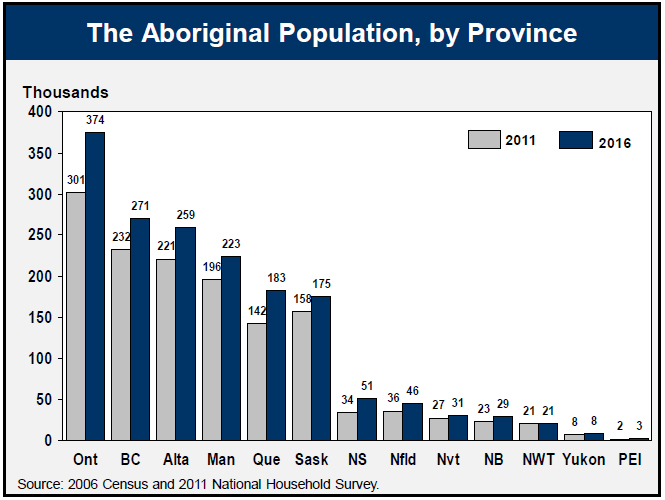
Ontario, the most populous province, is also the province with the largest Aboriginal population. One in five of the country’s Aboriginal people (22.4%) lived in Ontario in 2016.
BC had the second-largest Aboriginal population (16.2% of Canada’s), followed by Alberta (15.5%).
Aboriginal population growth fastest east of Manitoba
Most Aboriginal people lived in Ontario and the West, but the fastest increase in the last five years occurred East of Manitoba.
Between 2011 and 2016, the number of people identifying as Aboriginal increased 52.1% in Nova Scotia, 29.9% in New Brunswick, 27.7% in Newfoundland and Labrador, 26.8% in Quebec, 23.1% in Ontario, and 22.9% in PEI.
Among regions with higher proportions of Aboriginal people in the population (above 15%), the fastest increases were in Manitoba (13.7%) and Nunavut (11.7%). The Northwest Territories saw a 1.4% decline.
The territories and prairie provinces have the highest concentration of Aboriginal population
The proportion of the Canadian population identifying as Aboriginal rose from 4.3% in 2011 to 4.9% in 2016.
Nunavut had the highest proportion of Aboriginal people in its population in 2016 (85.9%), followed by the Northwest Territories (50.7%) and the Yukon (23.3%).
Among the provinces, Manitoba and Saskatchewan have the largest proportion of Aboriginal people at 18.0% and 16.3%, respectively.
All provinces east of Manitoba had less than 6% of Aboriginal people in their populations, with the exception of Newfoundland and Labrador whose Aboriginal peoples accounted for 8.9% of the total population.
In Ontario, Aboriginal people accounted for 2.8% of the total population in 2016, up from 2.4% in 2011.
53% of Aboriginal people in Ontario lived in Census Metropolitan Areas (CMAs). Thunder Bay, Greater Sudbury, and Belleville CMAs had the highest shares of Aboriginal people in total population, at 12.7%, 9.7% and 5.2% respectively. Enumeration issues in Brantford lowered its share from 8.5% in 2011 to 4.8% in 2016.
Accessible image descriptions
Aboriginal groups of Ontario
This pie chart shows the share Aboriginal groups in Ontario in 2011 and 2016. North American Indians accounted for 66.7% of all Aboriginal people in Ontario in 2011 and 63.2% in 2016, Métis for 28.5% in 2011 and 32.2% in 2016, Inuit people for 1.1% in 2011 and 1.0% in 2016, and other groups for 3.6% in 2011 and 3.5% in 2016.
Aboriginal population living on reserves, Ontario
This bar chart shows the share of Aboriginal people living on reserves in Ontario. Among all Aboriginal peoples, the share living on reserve went from 15.9% in 2011 to 14.5% in 2016, among North American Indians the share went from 23.6% to 22.7%, among Métis it stayed at 0.3%, among the Inuit the share fell from 0.5% to 0.3%, and among other groups the share feel from 2.5% in 2011 to 2.3% in 2016.
Age distribution of the population, Ontario
This chart shows the age distribution of the Aboriginal and non-Aboriginal population of Ontario in 2011 and 2016. The share of population aged 0-19 fell from 33.9% in 2011 to 32.5% in 2016 among the Aboriginal population, and from 23.8% to 22.5% for the non-Aboriginal population. The share of population aged 20-64 rose from 59.4% in 2011 to 59.6% in 2016 among the Aboriginal population, and fell from 62.2% to 61.4% for the non-Aboriginal population. The share of population aged 65+ rose from 6.7% in 2011 to 7.9% in 2016 among the Aboriginal population, and from 14.0% to 16.2% for the non-Aboriginal population.
The Aboriginal population, by province
This bar chart shows the Aboriginal population by province in 2011 and 2016. In Ontario, the Aboriginal population rose from 301,000 in 2011 to 374,000 in 2016. In Ontario, the Aboriginal population rose from 301,000 in 2011 to 374,000 in 2016. In BC, the Aboriginal population rose from 232,000 in 2011 to 271,000 in 2016. In Alberta, the Aboriginal population rose from 221,000 in 2011 to 259,000 in 2016. In Manitoba, the Aboriginal population rose from 196,000 in 2011 to 223,000 in 2016. In Quebec, the Aboriginal population rose from 142,000 in 2011 to 183,000 in 2016. In Saskatchewan, the Aboriginal population rose from 158,000 in 2011 to 175,000 in 2016. In Nova Scotia, the Aboriginal population rose from 34,000 in 2011 to 51,000 in 2016. In Newfoundland and Labrador, the Aboriginal population rose from 36,000 in 2011 to 46,000 in 2016. In Nunavut, the Aboriginal population rose from 27,000 in 2011 to 31,000 in 2016. In New Brunswick, the Aboriginal population rose from 23,000 in 2011 to 29,000 in 2016. In the Northwest Territories, the Aboriginal population stayed at 21,000. In Yukon, the Aboriginal population stayed at 8,000. In PEI, the Aboriginal population rose from 2,000 in 2011 to 3,000 in 2016.
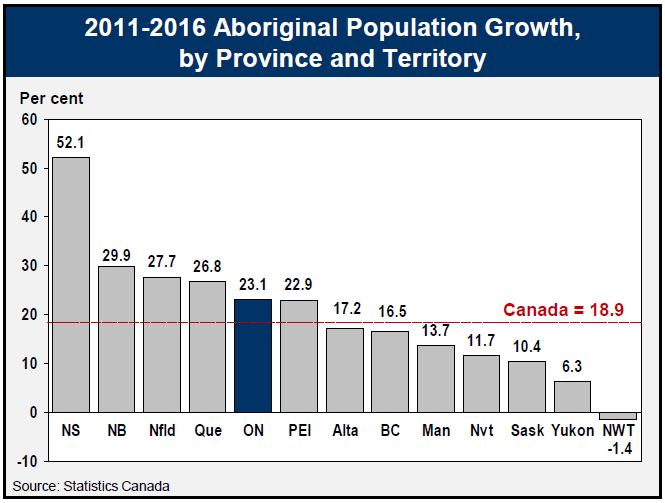
2011-2016 Aboriginal population growth, by province and territory
This bar chart shows Aboriginal population growth by province and territory over 2011-2016. The growth rate over 2011-2016 was 18.9% in Canada, 52.1% in Nova Scotia, 29.9% in New Brunswick, 27.7% in Newfoundland and Labrador, 26.8% in Quebec, 23.1% in Ontario, 22.9% in PEI, 17.2% in Alberta, 16.5% in BC, 13.7% in Manitoba, 11.7% in Nunavut, 10.4% in Saskatchewan, 6.3% in the Yukon, and the number of Aboriginal people fell by 1.4% in the Northwest Territories.
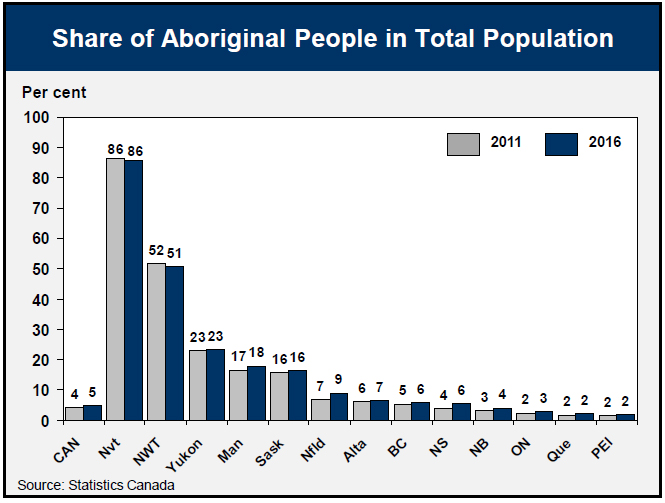
Share of Aboriginal people in total population
This bar chart shows the share of Aboriginal people in total population. The share was 5% in Canada in 2016, 86% in Nunavut, 51% in the Northwest Territories, 23% in Yukon, 18% in Manitoba, 16% in Saskatchewan, 9% in Newfoundland and Labrador, 7% in Alberta, 6% in BC, 6% in Nova Scotia, 4% in New Brunswick, 3% in Ontario, 2% in Quebec and 2% in PEI.