Labour
This factsheet looks at data on labour released by Statistics Canada as part of the 2016 Census.
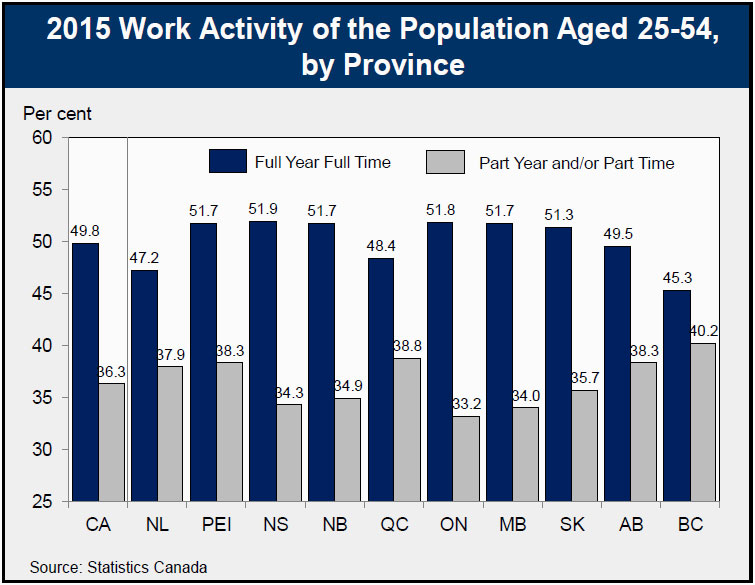
Five out of six Ontarians aged 25-54 worked in 2015
During calendar year 2015, 15.0% of Ontarians of core working-age (25-54) did not work at all, while 85.0% worked at least part of the year, the lowest rate among provinces. Nationally, 86.1% of the population aged 25-54 worked at some point during 2015.
Among core working-age Ontarians, 51.8% worked full year full time, only surpassed by Nova Scotia (51.9%). Nationally, 49.8% of Canadians aged 25-54 worked full year full time (49+ weeks and 30+ hours).
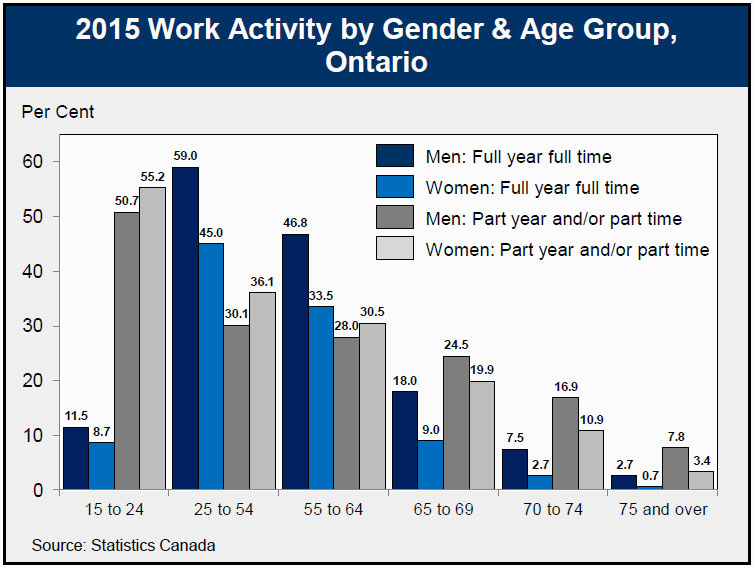
Significantly more Ontario men in this age group worked full year full time (59.0%) compared to women (45.0%).
Ontario had the lowest provincial share of core working-age population that had only worked part year and/or part time in 2015, at 33.2%, compared to 36.3% nationally.
Proportionally more women aged 25-54 in Ontario worked part year and/or part time in 2015 (36.1%) compared to men (30.1%).
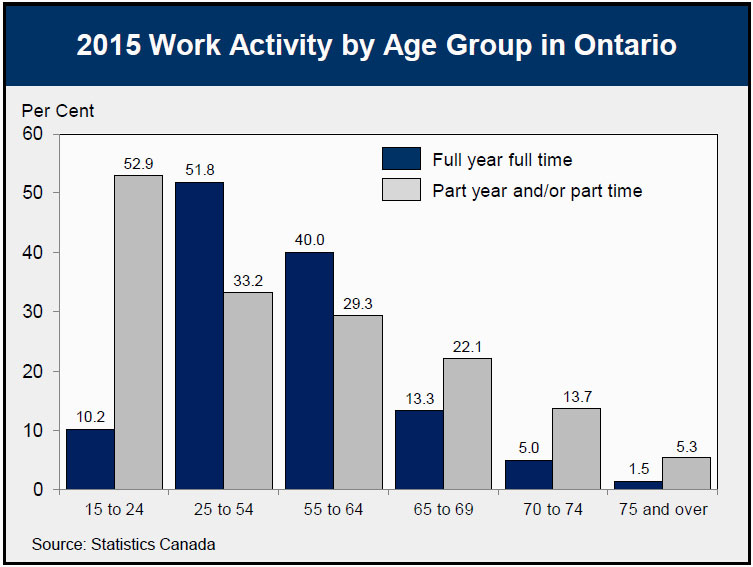
One out of five Ontario seniors worked in 2015
Among other age groups in Ontario, youths (aged 15-24) had the highest part year and/or part time work activity in 2015, at 52.9%. Only 10.2% of Ontarians in this group worked full year full time. Overall, slightly more youth men (11.5%) than women (8.7%) worked full year full time, while more youth women (55.2%) than men (50.7%) worked part year and/or part time.
Among older workers aged 55-64, 40.0% worked full year full time in 2015, while 29.3% worked part year and/or part time. Almost half of men in this age group still worked full year full time, while only a third of women did.
Among Ontario seniors (65+), 6.4% worked full year full time in 2015, while 13.2% worked part year and/or part time.
More than twice as many senior men worked full year full time (9.4%) compared to women (3.9%). One out of six senior men worked part year and/or part time, while only one out of 10 senior women did.
35.4% of 65-69 year olds had some work activity (full or part time/year) in 2015, while 18.7% of 70-74 year olds and 6.8% of Ontarians aged 75+ did.
Among younger seniors (65-69), 18.0% of men and 9.0% of women worked full year full time in 2015, compared to 7.5% of men and 2.7% or women in the 70-74 age group.
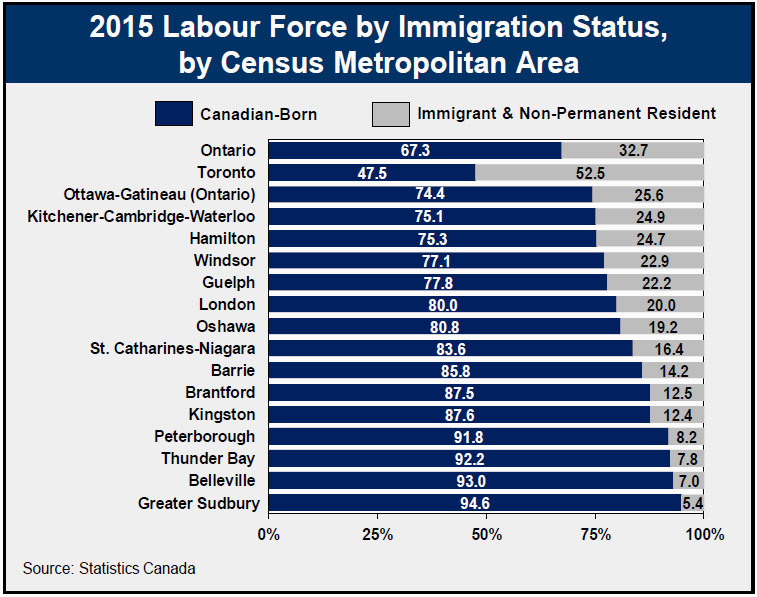
Almost one-third of Ontario’s workforce was born overseas
In 2015, 32.7% of Ontario’s labour force was comprised of immigrants and non-permanent residents, while 67.3% was Canadian-born.
Among Ontario Census Metropolitan Areas (CMAs), Toronto had by far the highest share of immigrants and non-permanent residents in its workforce, at 52.5%. It was the only CMA where people born in Canada comprised less than half of the local labour force.
Ottawa-Gatineau (Ontario part) (25.6%) and Kitchener-Cambridge-Waterloo (24.9%) had the next highest shares, while Greater Sudbury (5.4%) and Belleville (7.0%) had the lowest shares.
Immigrants and Canadian-born Ontarians have similar unemployment rates
Labour force activity for the week of May 1 to 7, 2016, recorded by the Census shows that Canadian-born Ontarians (7.3%) and immigrants (7.4%) had similar unemployment rates.
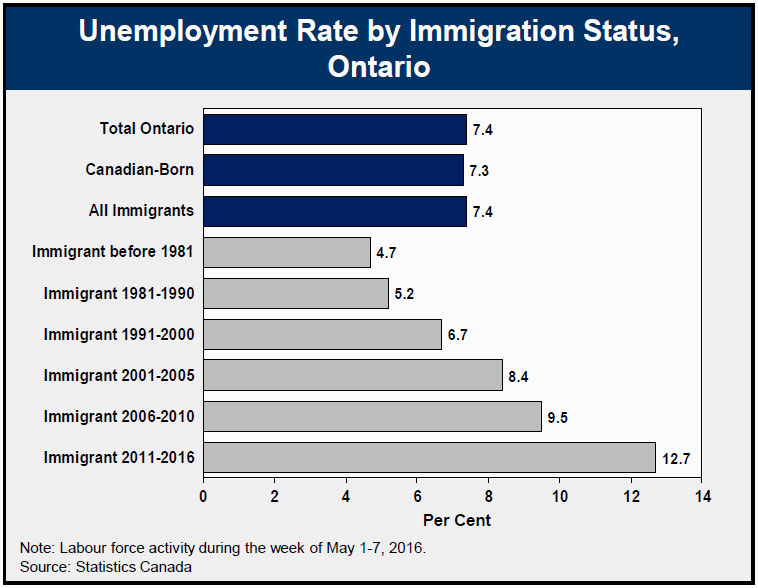
Immigrants who arrived in Canada over the past 15 years had higher unemployment rates than average, while those who arrived before 2001 had unemployment rates lower than average.
Recent immigrants from the last five years (2011-16) had an unemployment rate (12.7%) almost twice that of those who arrived in the 1990s (6.7%), and almost three times the unemployment rate of immigrants who came before 1981 (4.7%).
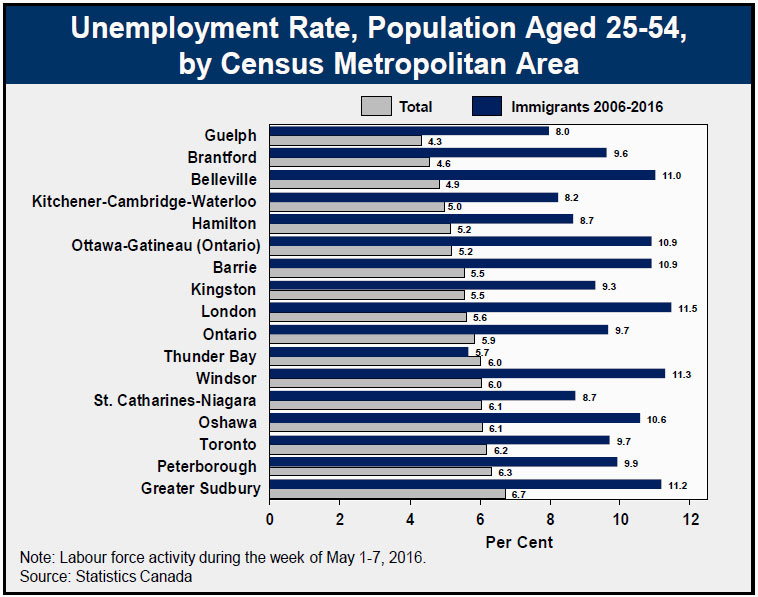
Recent immigrants’ unemployment rate low in central Ontario CMAs
Among the population aged 25 to 54, the unemployment rate of immigrants who arrived over the last 10 years (2006-2016) was 9.7% in Ontario, compared to 5.9% for the total population aged 25-54.
Regionally, the unemployment rate of recent immigrants was lowest in the CMAs located in Central Ontario, and highest in the Southwest.
Only in Thunder Bay did recent immigrants aged 25-54 have a lower unemployment rate (5.7%) than the total 25-54 local population (6.0%). Other Ontario CMAs where the unemployment rate of recent immigrants was relatively low included Guelph (8.0%), Kitchener-Cambridge-Waterloo (8.2%) and St. Catharines-Niagara (8.7%).
The highest unemployment rates among 2006-2016 immigrants were in the Southwestern CMAs of London (11.5%), Windsor (11.3%).
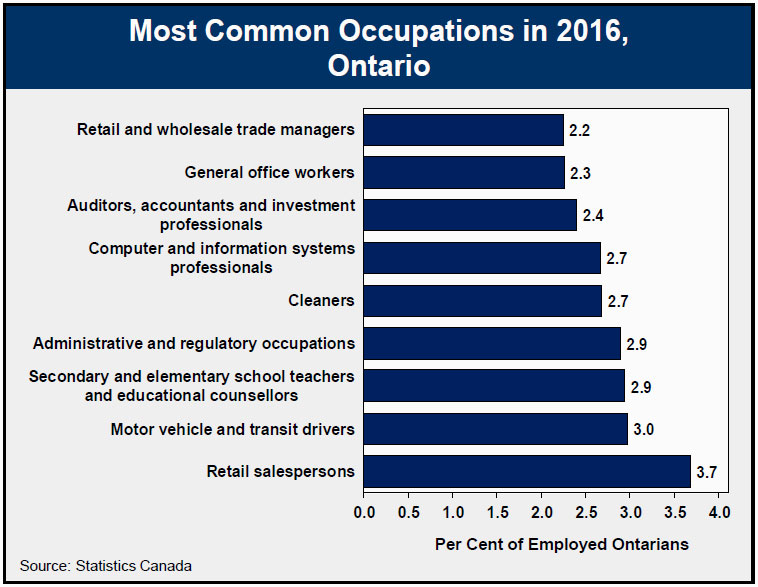
Most common occupation: Retail salesperson
In 2016, the most common occupation (3-digit National Occupational Classification) in Ontario was retail salesperson, accounting for 3.7% of persons employed. Motor vehicle and transit driver was second at 3.0%, followed closely by secondary and elementary school teacher and educational counsellor.
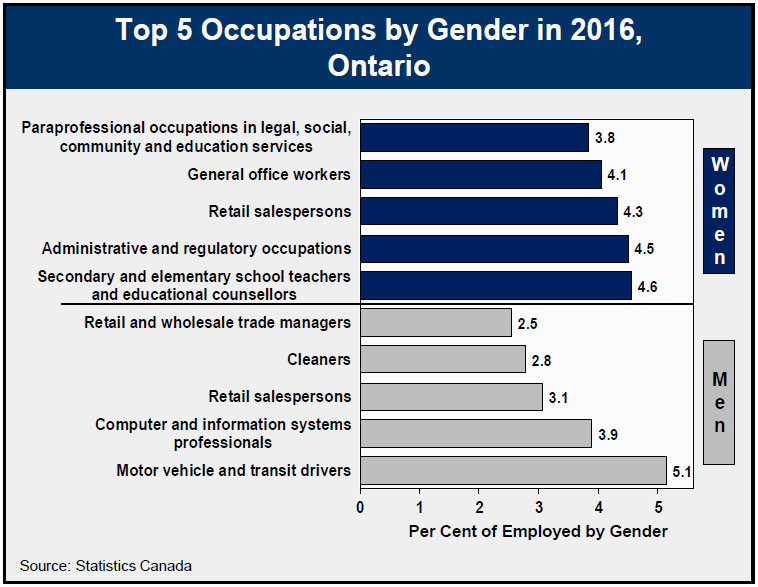
Among men, the top five occupations in Ontario were motor vehicle and transit driver (5.1%), computer and information systems professional (3.9%), retail salesperson (3.1%), cleaner (2.8%), and retail and wholesale trade manager (2.5%).
Among Ontario women, the most common occupations in 2016 were secondary and elementary school teacher and educational counsellor (4.6%), administrative and regulatory occupation (4.5%), retail salesperson (4.3%), general office worker (4.1%), and paraprofessional occupation in legal, social, community and education services (3.8%).
Gender ratio skewed in many occupations
Of the 24,575 plumbers, pipefitters and gas fitters in Ontario, only 365 were women, a ratio of 1 to 66. Other occupations with very few women included machinery and transportation equipment mechanics (except motor vehicles) at 1 to 55, masonry and plastering trades at 1 to 49, carpenters and cabinetmakers at 1 to 47, as well as automotive service technicians at 1 to 40 and crane operators, drillers and blasters at 1 to 40.
Occupations with the highest ratios of women were not as extremely skewed.
Of the 110,055 office administrative assistants - General, legal and medical in Ontario in 2016, only 5,920 were men, a ratio of 1 to 18. The ratio of men to women was 1 to 13 for professional occupations in nursing, and 1 to 12 for home care providers and educational support occupations.
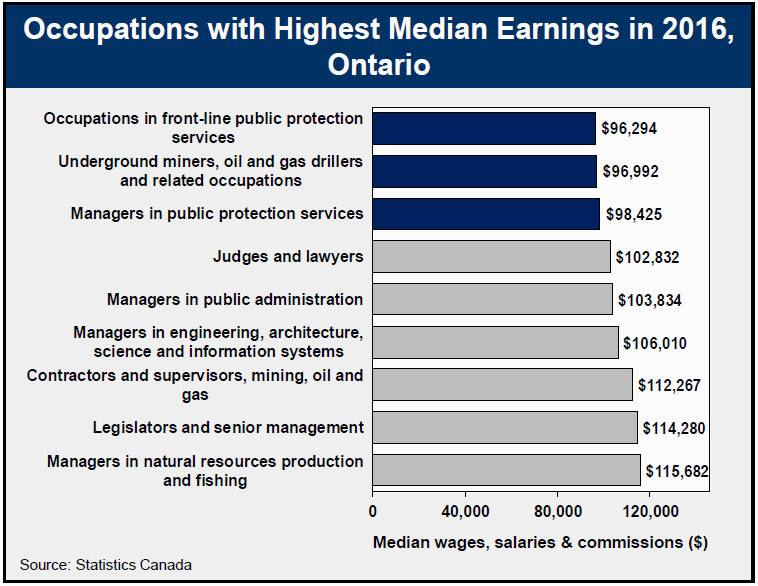
Managerial occupations pay the most
Based on median wages, salaries and commissions earned in 2016, the best paid occupation in Ontario was manager in natural resources production and fishing at $115,682.
Other occupations with high median earnings included legislators and senior management ($114,280), contractors and supervisors, mining, oil and gas ($112,267), managers in engineering, architecture, science and information systems ($106,010), managers in public administration ($103 834), and judges and lawyers ($102,832).
Accessible image descriptions
2015 Work activity of the population aged 25-54, by province
This bar chart shows 2015 work activity of the population aged 25-54 by province. Nationally, 49.8% worked full year full time and 36.3% worked part year and/or part time. Nova Scotia had the highest share working full year full time at 51.9%, while British Columbia had the lowest at 45.3%. British Columbia had the highest share working part year and/or part time at 40.2%, while Ontario had the lowest at 33.2%.
2015 Work activity by age group in Ontario
This bar chart show 2015 work activity by age group in Ontario. The share of Ontarians by age group working full year full time was 10.2% for those aged 15-24, 51.8% for those 25-54, 40.0% for 55-64, 13.3% for 65-69, 5.0% for 70-74 and 1.5% for the 75+ age group. The share by age group working part year and/or part time was 52.9% for those aged 15-24, 33.2% for those 25-54, 29.3% for 55-64, 22.1% for 65-69, 13.7% for 70-74 and 5.3% for the 75+ age group.
2015 Work activity by gender & age group, Ontario
This bar chart show 2015 work activity by gender and age group in Ontario. It shows that a higher share of women than men worked part year and/or part time at ages 15-64. In general, men were more likely to work full time full year compared to women of all ages.
2015 Labour force by immigration status, by census metropolitan area
This bar chart shows 2015 labour force by immigration status by census metropolitan area. For Ontario as a whole, 64.8% of the labour force was Canadian-born, while 35.2% was comprised of immigrants and non-permanent residents. The Toronto CMA had the highest share of immigrants and non-permanent resident in its labour force at 55.9%, while Greater Sudbury had the lowest at 7.1%.
Unemployment rate by immigration status, Ontario
This bar chart show unemployment rate by immigration status in Ontario during the period from May 1 to 7, 2016. The unemployment rate was 7.4% for Ontario as a whole, 7.3% for Canadian-Born Ontarians, 7.4% for all immigrants, 4.5% for immigrants who arrived before 1981, 5.2% for 1981-1990 immigrants, 6.7% for 1991-2000 immigrants, 8.4% for 2001-2005 immigrants, 9.5% for 2006-2010 immigrants, and 12.7% for 2011-2016 immigrants.
Unemployment rate, population aged 25-54, by census metropolitan area
This bar chart shows unemployment rate for the population aged 25-54 by census metropolitan area. The Guelph CMA had the lowest unemployment rate at 4.3%, while Grater Sudbury had the highest at 6.7%. Among immigrants who arrived between 2006 and 2016 only, the unemployment rate was lowest in Thunder Bay at 5.7% and highest in London at 11.5%.
Most common occupations in 2016, Ontario
This bar chart shows the most common occupations in 2016 in Ontario. Retail salesperson was the most common occupation, accounting for 3.7% of employed Ontarians, followed by motor vehicle and transit driver at 3.0%, and secondary and elementary school teacher and educational counsellor at 2.9%.
Top 5 occupations by gender in 2016, Ontario
This bar chart shows the top 5 occupations by Gender in 2016 in Ontario. For men, the top occupations were motor vehicle and transit driver at 5.1% and computer and information systems professionals at 3.9%. For women, the top occupations were secondary and elementary school teacher and educational counsellor at 4.6%, and administrative and regulatory occupation at 4.5%.
Occupations with highest median earnings in 2016, Ontario
This bar chart show occupations with the highest median earning in 2016 in Ontario, which included in top position managers in natural resources production and fishing at $115,682, followed by legislators and senior management at $114,280, and contractors and supervisors, mining, oil and gas at $112,267.