Housing and shelter costs
This factsheet looks at data on housing released by Statistics Canada as part of the 2016 Census.
Seven in ten Ontarians own their home
According to the 2016 Census, the homeownership rate in Ontario was 69.7%, down from 71.4% in 2011, and higher than the national rate of 67.8%.
Within Canada, homeownership was highest in Atlantic Canada, and lowest in the territories and Quebec.
The proportion of Ontario households that rent their home increased from 28.4 in 2011 to 30.2% in 2016.

Most homeowners live in single-detached dwellings
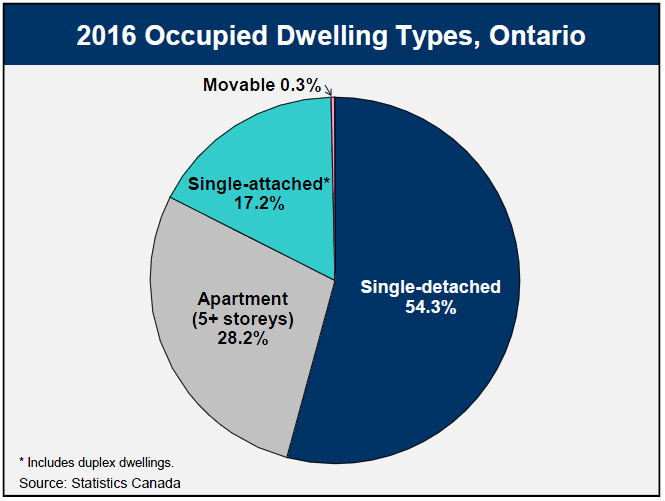
Over half of Ontario households lived in single-detached dwellings in 2016 (54.3%), 28.2% lived in apartment buildings of at least five storeys, 17.2% in other single-attached structures (townhouse, duplex, row house, and apartments of less than five storeys) and 0.3% in movable dwellings.
The type of dwelling was significantly different whether households were owning or renting their home.
Among homeowners, 72.0% lived in single-detached houses, 7.0% in apartments of at least 5 storeys, 20.6% lived in other single-attached dwellings, and 0.4% in movable structures.
Among renters, 40.6% lived in apartments of at least five storeys, 46.0% in other single-attached houses, 13.2% in single-detached dwellings and 0.1% in movable structures.

Majority of homeowners carry a mortgage
61.0% of homeowners in Ontario had a mortgage in 2016, while 39.0% owned their home mortgage-free.
Among owners, 4.8% reported that their dwelling was in need of major repairs.
Accommodations were deemed not suitable (not enough bedrooms) for 3.4% of homeowner households.
One in six renters receives a subsidy
15.0% of Ontario renters lived in subsidized housing in 2016.
Among renters, 8.7% declared that their dwelling was in need of major repairs.
Accommodations were deemed not suitable for 11.9% of renter households.
Most families own their home
Over three-quarters of Census family households owned their dwelling in 2016 (78.1%).
Couple families with children were most likely to be owners, at 83.4%, while lone-parent families were least likely, at 55.1%.
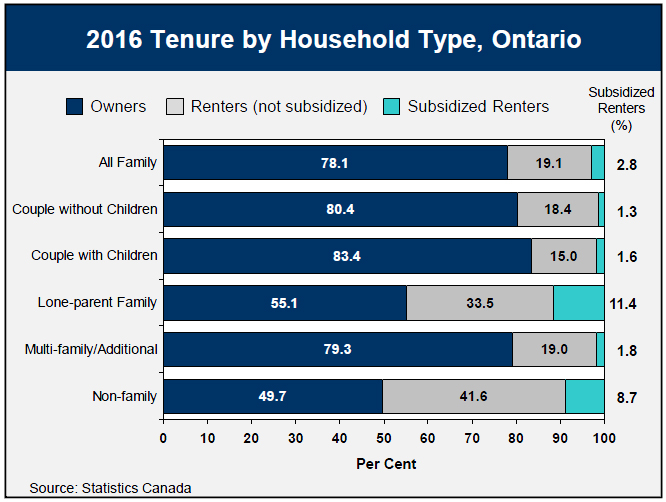
Lone-parent family households were also most likely to receive a rental subsidy, at 11.4%. Among lone-parent families who rented in 2016, more than one quarter lived in subsidized housing.
Less than half of non-family households (e.g., persons living alone or with friends) owned their dwelling in 2016 (49.7%).
Rising share of apartments in newly constructed dwellings
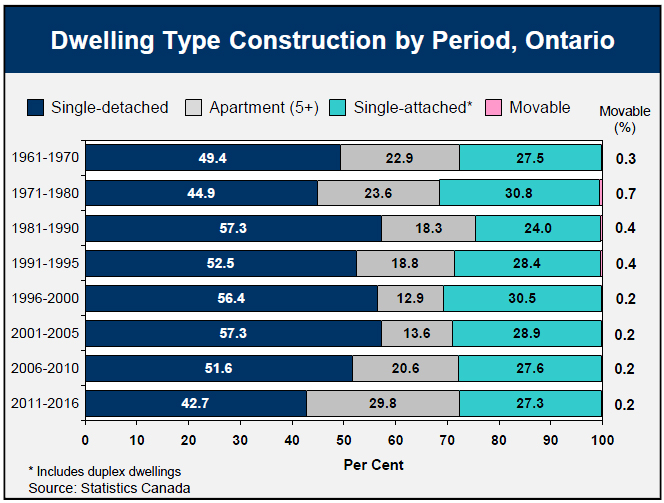
For the first time since the 1970s, less than half (42.7%) of all newly constructed dwellings over the 2011-16 period in Ontario were single-detached houses. This is significantly lower than the 51.6% share observed over 2006-10.
The proportion of apartment structures of over five storeys built during 2011-16 was much higher than during the previous five-year period, at 29.8% versus 20.6% over 2006-10.
The proportion of new single-attached structures declined slightly to 27.3% over 2011-16, from 27.6% during 2006-10.
Record share of new condominium dwellings
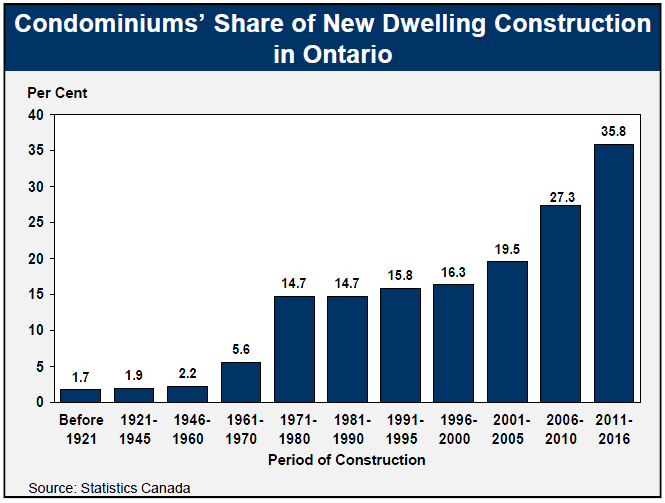
The share of new constructions being built as condominiums hit a record 35.8% over 2011-16, up from 27.3% in the previous five years, and more than double the proportion observed between 1971 and 2000.
The share of Ontario households living in condominiums also hit a record 13.2% in 2016, up from 12.0% in 2011. This was slightly lower than the national average of 13.3%, as condominium living remained significantly more popular in British Columbia (22.1%) and Alberta (16.8%).
The lowest propensities to live in a condominium were found in Atlantic Canada, with Newfoundland and Labrador (2.1%) and Prince Edward Island (2.2%) recording the lowest shares of households living in condominiums.
One in five Toronto households living in a condo
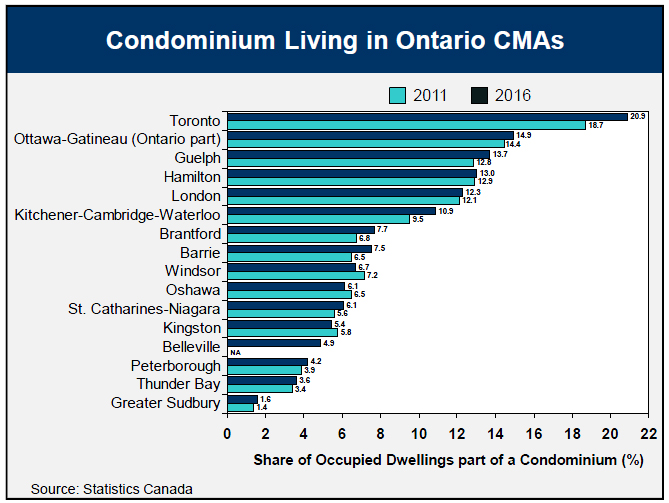
Among Census Metropolitan Areas (CMAs), Toronto had the highest proportion of households living in condominiums in Ontario at 20.9%.
This was lower than in many Western Canada CMAs, with households living in condominiums accounting for 30.6% of the total in Vancouver, 21.8% in Calgary, 21.5% in Abbotsford-Mission, 21.3% in Kelowna, and 19.8% in Edmonton. In Montreal, 16.0% of households lived in condos.
In Ontario, other CMAs with relatively high shares of households living in condominiums included the Ontario part of Ottawa-Gatineau (14.9%), Guelph (13.7%) and Hamilton (13.0%). Thunder Bay (3.6%) and Greater Sudbury (1.6%) had the lowest shares.
Proportion of condominium renters is rising
In Ontario, 29.0% of condo dwellers were renting their unit in 2016, up from 23.3% in 2011. This was the lowest share among provinces, with a national average of 32.9%.
Ontario CMAs had some of the lowest rates of condo rental in Canada. In Toronto, 29.4% of condos were occupied by renters, compared to 29.0% in Vancouver and 33.1% in Montreal.
Condos built recently (2011-16) had a higher share of renters. In Toronto, 50.3% of newer condos were occupied by renters (up from 33% in 2011), compared to 36.8% in Vancouver and 28.5% in Montreal.
Average shelter cost
Households in Ontario paid on average $1,355 in monthly shelter costs, higher than the national average of $1,213.
The average monthly shelter cost for tenant households was $1,109. Subsidized tenants paid on average $595, while non-subsidized tenants paid $1,200.
Owner households paid on average $1,463 in shelter costs. Those with a mortgage spent on average $1,954, while mortgage-free owners spent $694.
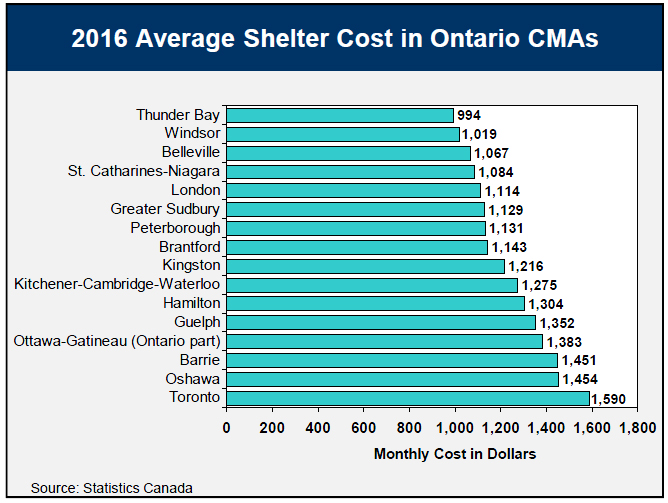
Residents of the Toronto ($1,590) and Oshawa ($1,454) CMAs spent the most on average in Ontario on shelter. The lowest average shelter costs among Ontario CMAs were in Thunder Bay ($994) and Windsor ($1,019).
Almost half of renters spend more than 30% of income on housing
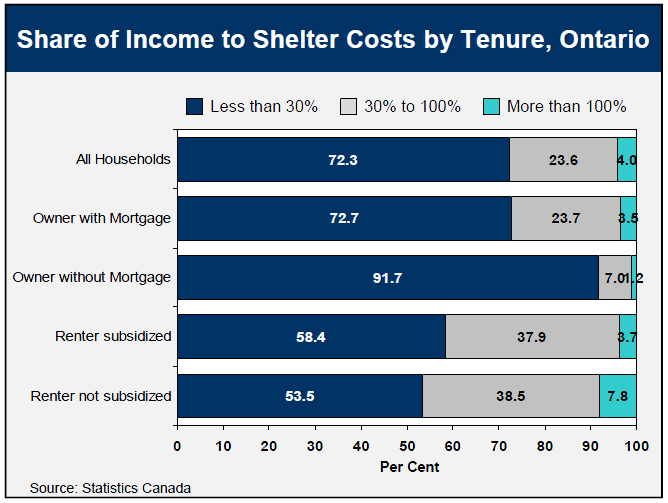
27.6% of Ontario households paid more than 30% of total household income toward shelter costs, higher than the national average of 24.1%.
This proportion was much lower for owner households (19.8%) than for renters (45.6%).
Accessible image descriptions
Home ownership rates in Canada
This bar chart shows home ownership rates in Canada in 2011 and 2016. The rate decreased for all provinces and territories, with the exception of Quebec and the Northwest Territories. For Canada, the rate decreased from 69.0% in 2011 to 67.8% in 2016, and for Ontario the rate went from 71.4% to 69.7%. Among provinces, the highest home ownership rate in 2016 was in Newfoundland and Labrador at 67.7%, while the lowest rate was in Quebec at 61.3%. Rates were lowest in the Northwest Territories at 53.7% and Nunavut at 20.0%.
2016 Occupied dwelling types, Ontario
This pie chart shows occupied dwellings by types in Ontario in 2016. The share of total was 54.3% for single-detached, 28.2% for apartments of at least 5 storeys, 17.2% for single attached, and 0.3% for movable.
2016 Dwelling type by tenure, Ontario
This chart shows 2016 dwelling types by tenure in Ontario. Among owners, 72.0% lived in single-detached dwellings, 20.6% in single-attached, 7.0% in apartments, and 0.4% in movable dwellings. Among renters, 13.2% lived in single-detached dwellings, 46.0% in single-attached, 40.6% in apartments, and 0.1% in movable dwellings.
2016 Tenure by household type, Ontario
This chart shows 2016 tenure by household type in Ontario. Among all families, 78.1% were owners, 19.1% were unsubsidized renters, and 2.8% were subsidized renters. Among couples without children, 80.4% were owners, 18.4% were unsubsidized renters, and 1.3% were subsidized renters. Among couples with children, 83.4% were owners, 15.0% were unsubsidized renters, and 1.6% were subsidized renters. Among lone-parent families, 55.1% were owners, 33.5% were unsubsidized renters, and 11.4% were subsidized renters. Among multi-family households, 79.3% were owners, 19.0% were unsubsidized renters, and 1.8% were subsidized renters. Among non-family households, 49.7% were owners, 41.6% were unsubsidized renters, and 8.7% were subsidized renters.
Dwelling type construction by period, Ontario
This chart shows dwelling type construction by period in Ontario. Between the 2006-2010 and 2011-2016 periods, the share of dwellings constructed as single-detached declined from 51.6% to 42.7%, the share of apartments of at least 5 storeys rose from 20.6% to 29.8%, the share of single-attached fell from 27.6% to 27.3%, and the share of movable dwellings stayed at 0.2%.
Condominiums’ share of new dwelling construction in Ontario
This bar chart shows the share of condominiums in new dwelling construction in Ontario by period. Before 1970, the share was less than 10%. From 1971 to 2005 it was between 10% and 20%. It rose to 27.3% in 2006-2010, and reached an all-time high of 35.8% over 2011-2016.
Condominium living in Ontario CMAs
This bar chart shows condominium living in Ontario CMAs. The share of occupied dwellings that are part of a condominium increased from 18.7% in 2011 to 20.9% in 2016 in the Toronto CMA, from 14.4% to 14.9% in the Ottawa-Gatineau CMA (Ontario part), and from 12.8% to 13.7% in the Guelph CMA. Among the CMAs with the lowest shares of condominiums, Greater Sudbury saw its share rise from 1.4% in 2011 to 1.8% in 2016, and Thunder Bay saw its share rise from 3.4% to 3.6%.
2016 Average shelter cost in Ontario CMAs
This bar chart shows the 2016 average shelter cost in Ontario’s CMAs. The lowest were in Thunder Bay at $994, Windsor at $1,019, and Belleville at $1,067. The highest costs were in Toronto at $1,590, Oshawa at $1,454, and Barrie at $1,451.
Share of income to shelter costs by tenure, Ontario
This chart shows the share of income to shelter costs by tenure in Ontario. Among all households, 72.3% spent less than 30% of their income on shelter, 23.6% spent between 30% and 100%, and 4.0% spent more than 100%. Among owners with mortgages, 72.7% spent less than 30% of their income on shelter, 23.7% spent between 30% and 100%, and 3.5% spent more than 100%. Among owners without mortgage, 91.7% spent less than 30% of their income on shelter, 7.0% spent between 30% and 100%, and 1.2% spent more than 100%. Among subsidized renters, 58.4% spent less than 30% of their income on shelter, 37.9% spent between 30% and 100%, and 3.7% spent more than 100%. Among unsubsidized renters, 53.5% spent less than 30% of their income on shelter, 38.5% spent between 30% and 100%, and 7.8% spent more than 100%.