Population counts: Census Subdivisions (CSDs) in Ontario
Over two-thirds of Ontarians live in the 25 most populous census subdivisions
There are 575 Census Subdivisions (CSDs) in Ontario. These geographical areas correspond to municipalities, Indian reserves or unorganized territories treated as municipal equivalents.
According to the 2016 Census, 67.8% of Ontario’s population lives in the province’s 25 most populous Census Subdivisions.
The 25 largest CSDs in Ontario as a group grew 5.2% between 2011 and 2016, accounting for 76.0% of total provincial growth over this period.
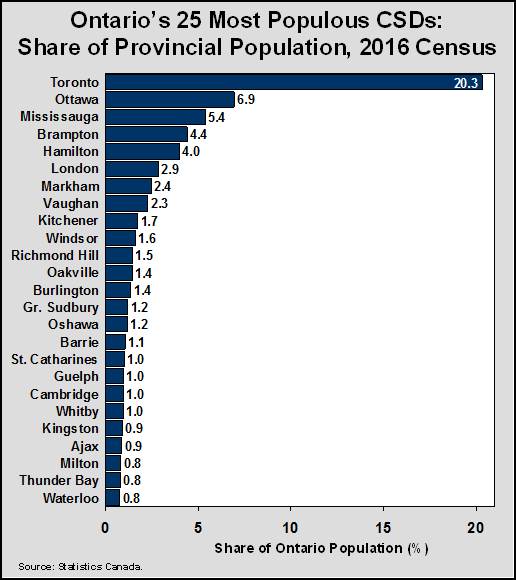
Five of the 10 most populous CSDs are located in the Greater Toronto Area (Toronto, Mississauga, Brampton, Markham and Vaughan). Combined, these five GTA CSDs are home to 34.8% of Ontario’s population and accounted for 40% of provincial growth between 2011 and 2016.
Completing the top 10 are the CSDs of Ottawa, Hamilton, London, Kitchener and Windsor.
One in five Ontarians live in the city of Toronto
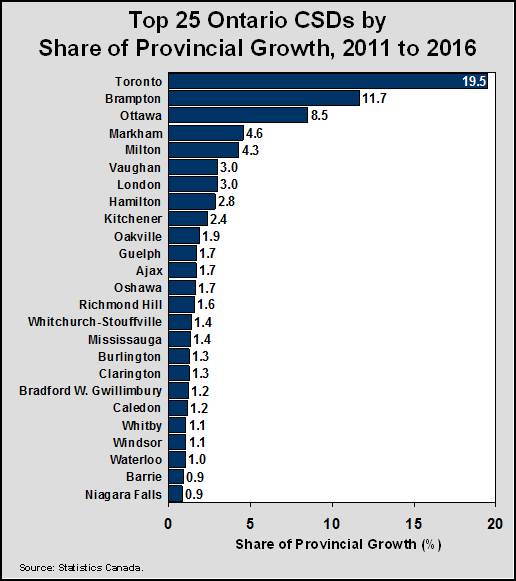
The Toronto CSD remains the most populous in the province, and is home to one in five Ontarians. The municipality recorded growth of 4.5% between the 2011 and 2016 Censuses, accounting for 19.5% of provincial population growth, the most of any CSD.
The second-largest CSD is Ottawa. The city grew 5.8% over the 2011-16 period and accounted for 8.5% of Ontario’s population growth.
Mississauga is the third-largest CSD. The city grew 1.1% from 2011 to 2016 and accounted for 1.4% of total population growth in the province.
Brampton, the fourth-largest CSD in Ontario, grew by 13.3% and accounted for 11.7% of all growth in the province over this period, the second largest growth contributor after Toronto.
More than half of Ontario’s CSDs are growing
Between 2011 and 2016, 335 of Ontario’s 575 CSDs experienced population growth, while 195 saw population decline. Population was unchanged in 21 CSDs, and 24 were not enumerated in either 2011 or 2016 (mostly Indian reserves).
Note: Only CSDs that were enumerated in both 2011 and 2016 are included in the growth calculations.
CSDs with population of more than 25,000footnote 1
There were 64 Ontario CSDs with population greater than 25,000 in both 2011 and 2016. As a group, CSDs of this size grew 5.0% over the 2011-16 period, faster than the provincial average. In 2016, they accounted for 83% of the provincial population.
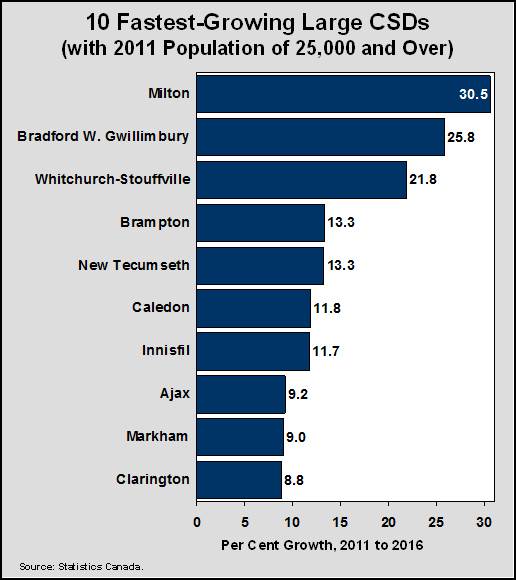
Milton had by far the highest growth rate (30.5%), followed by Bradford West Gwillimbury (25.8%) and Whitchurch-Stouffville (21.8%).
Eight CSDs within this group experienced population decline between 2011 and 2016, including North Bay (-3.9%), Timmins (-3.2%), Leamington(-2.8%), Sault Ste. Marie (-2.4%), Prince Edward County (-2.1%), Chatham Kent (-2.0%), Sarnia (-1.1%) and Thunder Bay (-0.4%).
CSDs with population between 10,000 and 24,999
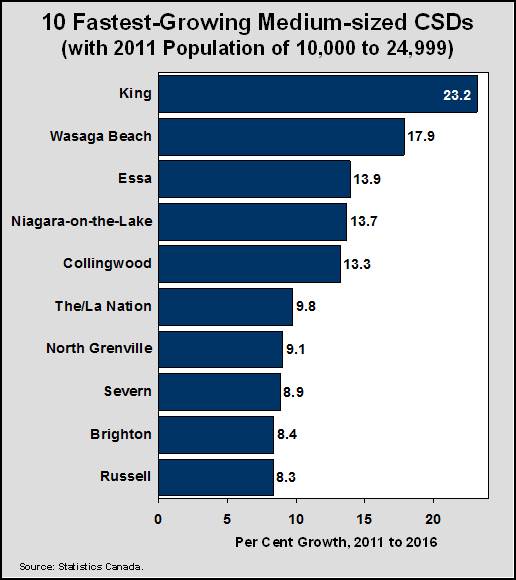
CSDs with population of 10,000 to 24,999 grew 3.9% as a group between 2011 and 2016. There were 79 CSDs in this category in 2011 and 83 in 2016, accounting for 9.6% of the provincial population.
Within this group, 63 CSDs experienced population growth and 16 saw declines.
King had by far the highest growth rate (23.2%) within this group, followed by Wasaga Beach (17.9%) and Essa (13.9%).
The largest declines occurred in Elliot Lake (-5.3%), Temiskaming Shores (-4.6%) and Pembroke (-3.3%).
CSDs with population of less than 10,000
The vast majority of Ontario CSDs have population of less than 10,000 (420 out of 575 in 2016), accounting for 7.4% of total provincial population.
Enumeration issues on Indian reserves and very sparsely populated areas affect the reliability of Census count comparisons for this group.
Note
The most appropriate 2016 population figures for Ontario and the rest of Canada are the current postcensal population estimates rather than the 2016 Census counts. See Fact Sheet 1 for notes on Census counts and net undercoverage and the reason why this fact sheet looks largely at shares and growth rates between the 2011 and 2016 Censuses rather than population levels.
Accessible image descriptions
Ontario’s 25 most populous CSDs: share of provincial population, 2016 census
This chart shows the share of Ontario’s population accounted for by the 25 most populous census subdivisions according to the 2016 Census. Toronto accounted for 20.3% of the provincial population, Ottawa for 6.9%, and Mississauga for 5.4%.
Top 25 Ontario CSDs by share of provincial growth, 2011 to 2016
This chart shows the share of total provincial growth accounted for by the 25 most populous census subdivisions in Ontario over the 2011-2016 period. Toronto accounted for 19.5% of total provincial growth over the period, Brampton for 11.7%, and Ottawa for 8.5%.
10 Fastest-growing large CSDs (with 2011 population of 25,000 and over)
This chart shows the 2011-2016 growth rates of the 10 fastest-growing census subdivisions in Ontario that had a population of 25,000 and over in 2011. Milton grew fastest at 30.5%, followed by Bradford West Gwillimbury at 25.8% and Whitchurch-Stouffville at 21.8%.
10 fastest-growing medium-sized CSDs (with 2011 population of 10,000 to 24,999)
This chart shows the 2011-2016 growth rates of the 10 fastest-growing census subdivisions in Ontario that had a population of between 10,000 and 24,999 in 2011. King grew fastest at 23.2%, followed by Wasaga Beach at 17.9% and Essa at 13.9%.