Population counts: age and gender
This fact sheet looks at age and gender data recently released by Statistics Canada as part of the 2016 Census. Note that Statistics Canada’s postcensal estimates, rather than the 2016 Census counts, are the most appropriate population figures. Census counts need to be adjusted for net undercoverage (expected in 2018). See Fact Sheet 1 for more details.
Population aging acceleration
According to the 2016 Census, the average age of Ontario's population was 41.0 years, the same as the average age of the nation as a whole. This represents an increase of 1.1 years in the average age of the province population between 2011 and 2016.
Newfoundland and Labrador was the oldest province with an average age of 43.7 years. Alberta was the youngest province with a median age of 37.8 years.
Older age groups growing fastest
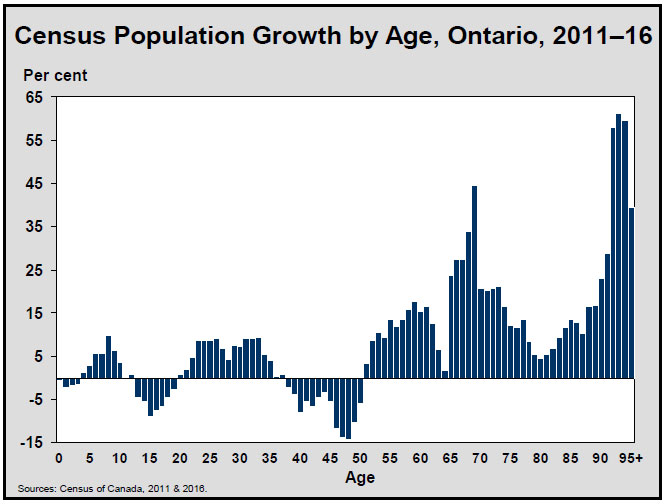
Between 2011 and 2016, the fastest growing segment of Ontario’s population was the 90+ age group, which increased 39.7%, followed by the 65–74 age group, which rose 26.1%.
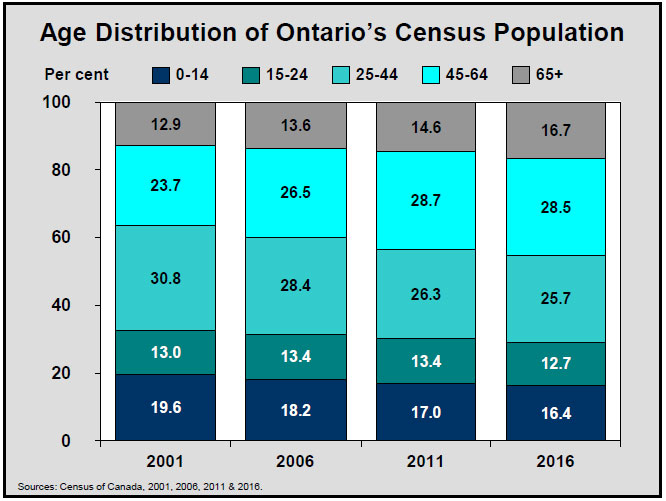
The number of seniors 65+ grew by 19.9% over 2011-16, and their share of total population continued to rise, reaching 16.7%, up from 14.6% in 2011 and 12.4% in 1996.
The working-age population (15-64) increased by 2.2% between 2011 and 2016. The proportion of Ontarians in this age group was 66.8% in 2016, down from 68.4% in 2011, but higher than 67% in 1996.
However, as a result of the large cohorts of baby boomers (aged 51-70 in 2016) moving up the age structure and increases in longevity, population grew for every single age beyond age 50. By contrast, the age group 35-49 shrank almost 6.1% from 2011 to 2016.
Similarly, as the baby boom echo cohorts have moved into adulthood, the teenage group (13-19) shrank by 5.7% between 2011 and 2016.
The children (0–14) group increased 1.2%. The share of children in Ontario’s population declined slightly, to 16.4% in 2016, down from 17% in 2011 and 20.6% in 1996.
Ontario’s working-age population getting older
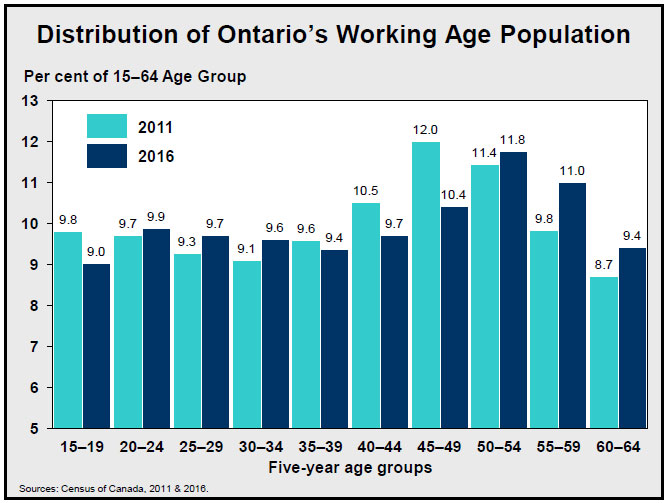
The province’s working-age population is increasingly made up of older individuals. Within this age group the share of people aged 50-64 increased to 32.2% from 30% in 2011.
By contrast, the population aged 35–49 declined by 6.1% over 2011-2016, and their share of the working-age population declined to 29.5% from 32.1% in 2011.
There were fewer young labour market entrants to replace older workers approaching typical retirement age. In 2016, there were 0.9 people aged 15 to 24 for every person aged 55 to 64, down from a ratio of 1.1 in 2011 and 1.4 in 2001.
Baby boomers accounted for 30% of the workingage population in 2016, compared to 39.7% in 2011 and 43.4% in 2006.
More younger and older seniors
The first cohort of baby boomers entered the senior age group in 2011. As a result, the number of younger seniors aged 65-69 increased 30.9% from 2011. Their share of all seniors increased to 32.8% in 2016 from 30% in 2011.
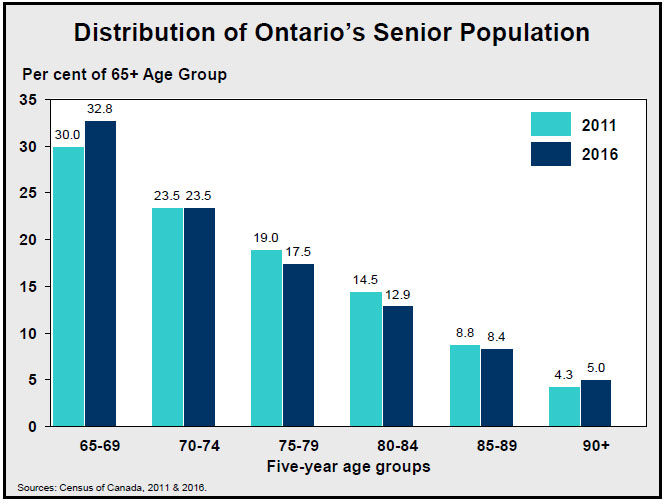
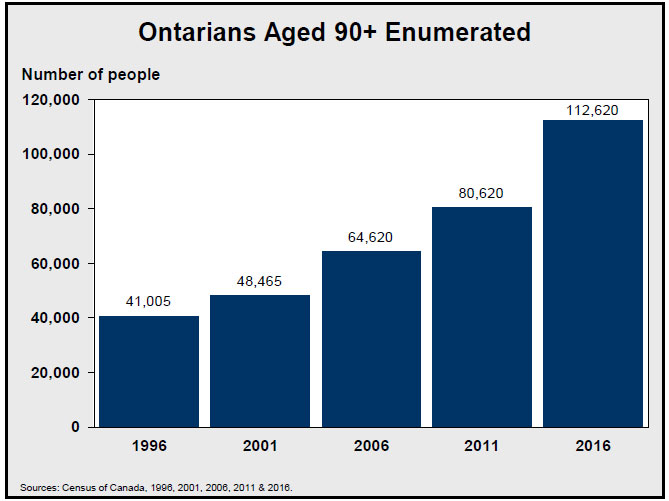
However, the fastest-growing segments among seniors were the oldest group aged 90+. The number of seniors in this age group increased by almost 40% between the two censuses, reaching 112,620 in 2016, up from 80,620 in 2011. The share of this group among seniors increased to 5% from 4.3% in 2011.
In 2016 there were 8,230 centenarians in Canada, the majority of whom were women (6,890). There were 3,010 centenarians living in Ontario.
Women outnumber men
The 2016 census showed a gender ratio of 95.2 men for every 100 women in Ontario, little changed from 2011 (95.1).
The number of male seniors increased 21.9% between 2011 and 2016, faster than growth of female seniors (18.3%).
However, female seniors continue to outnumber their male counterparts substantially. There were 82 men per 100 women in the 65+ group, and only 42 men per 100 women in the 90+ group.
Toronto: highest share of working-age
According to the 2016 Census, Toronto was the Census Metropolitan Area (CMA) in the province with the highest proportion of working-age people in its population, at 68.9%.
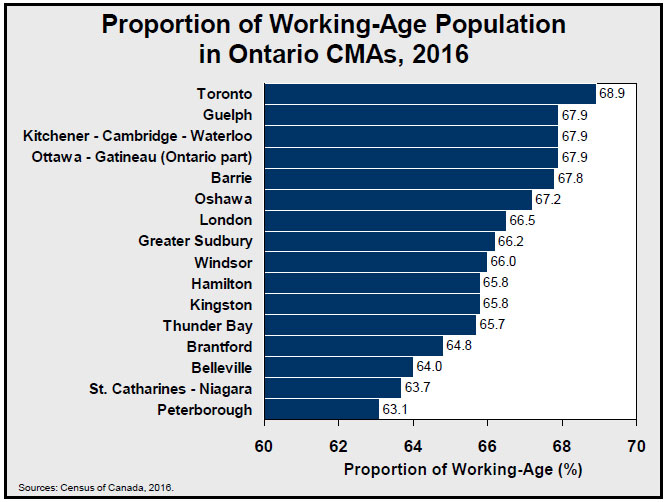
In Canada, Calgary had the highest share of workingage population at 70.2%. Toronto ranked 6th nationally.
Peterborough and St. Catharines-Niagara were the two Ontario CMAs with the lowest share of working-age population, at less than 64%. They also were among the five CMAs with the lowest share of workingage of all CMAs in Canada.
Peterborough: highest share of seniors
Peterborough and St. Catharines-Niagara were also the two Ontario CMAs with the highest share of seniors in their population, at about 22%. Nationally, only the Trois-Rivières CMA in Quebec had a higher share, at 22.3%.
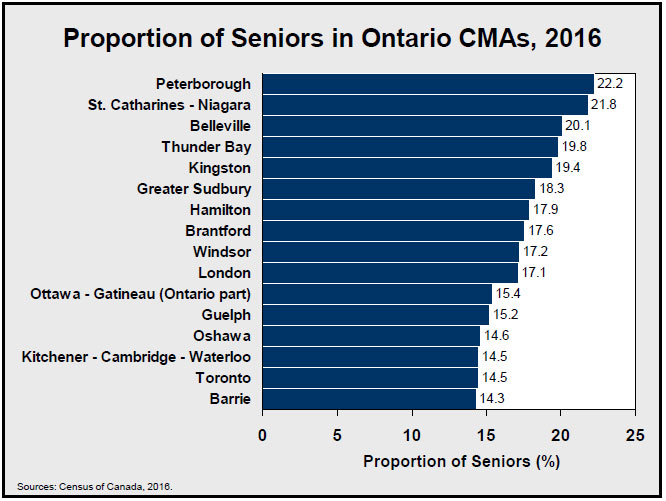
In Ontario, Barrie had the lowest share of seniors in their population among CMAs, at 14.3%, followed by Toronto and Kitchener-Cambridge-Waterloo, both at 14.5%.
Nationally, among all CMAs in Canada, Calgary and Edmonton had the lowest shares of seniors, at 11.0 and 12.3% respectively.
Elliot Lake: Oldest census agglomeration
Among smaller population centres in Ontario called Census Agglomerations (CAs), Elliot Lake had by far the highest share of seniors, at 37.9%.
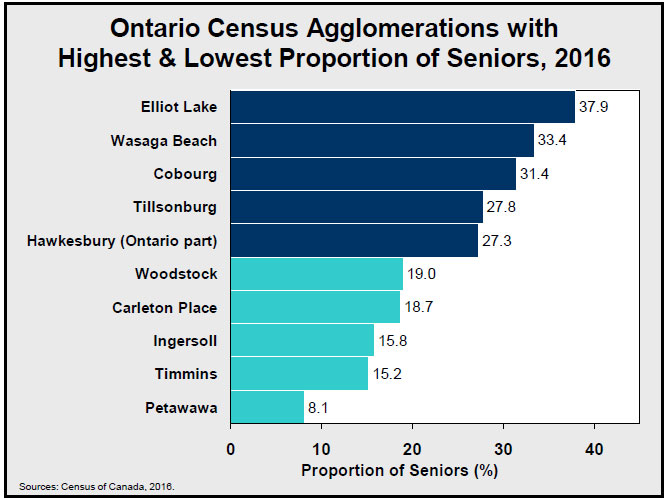
Nationally, only the Parksville CA in B.C. had a higher proportion of seniors in its population, at 43.9%.
Petawawa and Timmins were the two Ontario CAs with the lowest shares of seniors, at 8.1 and 15.2% respectively. Wood Buffalo in Alberta had the lowest share nationally (2.8%).
Haliburton: The oldest census division in Ontario
Haliburton was the oldest Census Division (CD) in Ontario with an average age of 52.0 years and a seniors’ share of 32.9%.
Kenora was the youngest CD in the province with an average age of 37.6 years. Peel had the lowest proportion of seniors (12.8%).
Accessible image descriptions
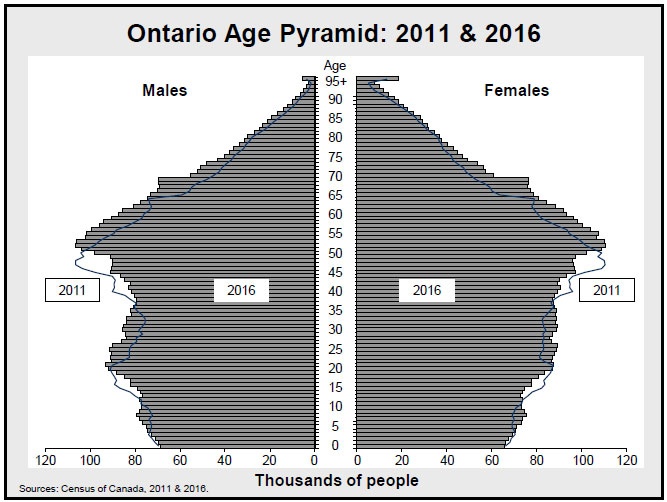
Ontario age pyramid: 2011 & 2016
This population pyramid shows the number of people of each age in Ontario in the 2011 and 2016 separately for males (on the left) and females (on the right). The number of people in each age is represented by the horizontal length of the corresponding line. Age is displayed vertically, staring with age zero on the bottom, and ended on the top with ages 95 and older combined into one group.
Census population growth by age, Ontario, 2011–16
This bar chart shows the growth rate (%) of population of each age between the 2011 and 2016 censuses. The bars corresponding to each age above age 50 lie above the zero horizontal line, presenting positive growth for population in each of these ages. For ages 50 or younger, population declined between 2011 and 2016 for some ages.
Age distribution of Ontario’s census population
This chart shows the distribution of population by broad age group as enumerated in the four consecutive censuses, 2001, 2006, 2011 and 2016. The last bar on the right shows that in the 2016 census the share of children (0-14) in the total population was 16.4%, lower than the share of seniors (16.7%).
Distribution of Ontario’s working age population
This bar chart shows the percentage distribution of the working-age population by five-year age group in Ontario. For each age group, its share of the working-age population in 2011 and 2016 is displayed side by side for comparison. The two bars on the left end show the share of the age group 15-19 declining from 9.8% in 2011 to 9.0% in 2016. The two bars on the right end show the share of the age group 60-64 increasing from 8.7% to 9.4%.
Distribution of Ontario’s senior population
This chart shows the percentage distribution of senior population in Ontario by five-year age group (ages 95 and above is combined into one group). For each age group its share of senior population in 2011 and 2016 is displayed side by side for comparison. The chart shows that the share of the younger seniors (65-69) and the share of the oldest group (90+) increased between 2011 and 2016, while the share of the other age groups declined or was unchanged.
Ontarians aged 90+ enumerated
This chart shows the number of population aged 90+ as enumerated in the five consecutive censuses, 1996, 2001, 2006, 2011 and 2016. There were 41,006 people aged 90 or older enumerated in the 1996 census. In the 2016 census, the counts of this age group increased to 112,620.
Proportion of working-age population in Ontario CMAs, 2016
This chart shows the proportion of working-age population of each of 16 Census Metropolitan Areas (CMAs) in Ontario. The Toronto CMA had the highest share of working-age population, at 68.9%. Peterborough was the CMA with the lowest share of working-age population, at 63.1%.
Proportion of seniors in Ontario CMAs, 2016
This chart shows the proportion of senior population of each of 16 Census Metropolitan Areas (CMAs) in Ontario. The Peterborough CMA had the highest share of senior population, at 22.2%. Barrie was the CMA with the lowest share of senior population, at 14.3%.
Ontario census agglomerations with highest & lowest proportion of seniors, 2016
This chart shows the five Census Agglomerations (CAs) with highest proportions of seniors and the five CAs with lowest proportions of seniors. It is shown in this chart that among all CAs in Ontario the Elliot Lake CA had the highest share of seniors, at 37.9%, and Petawawa had the lowest share of seniors, at 8.1%.