Immigration
This factsheet looks at immigration and citizenship information released by Statistics Canada as part of the 2016 Census.
Ontario: highest proportion of foreign-born population
The 2016 Census enumerated over 7.5 million foreign-born individuals in Canada, accounting for 21.9% of the total population. In Ontario, 3,852,145 foreign-born residents represented 29.1% of total population, the highest proportion among provinces. British Columbia was second at 28.3%.
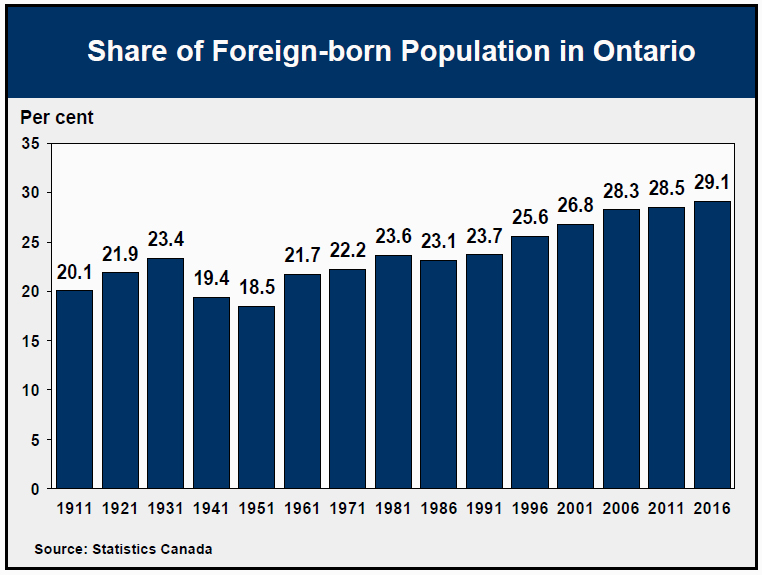
The proportion of foreign-born individuals has been rising in Ontario since the early 1950s when it stood at 18.5%.
Between 2011 and 2016, Ontario’s foreign-born population increased by 6.7%, much faster than growth in the province’s Canadian-born population (+3.2%).
Ontario attracted 39.0% of the 1.2 million newcomers who arrived to Canada during the 2011-2016 period, in line with it’s share of the national population (38.5%).
According to the Census, 472,170 immigrants arrived in Ontario between 2011 and 2016. These recent newcomers made up 12.3% of the foreign-born population and 3.6% of total population in 2016.
New immigrants distributed more evenly
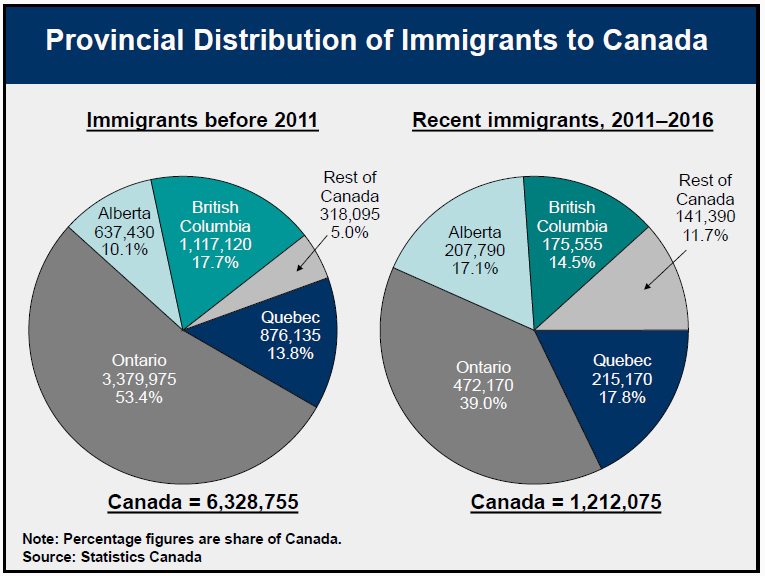
While the bulk of people who immigrated to Canada prior to 2011 live in Ontario (53.4%) and British Columbia (17.7%), the distribution of recent immigrants is more even across the country.
Among people who immigrated to Canada between 2011 and 2016, 39.0% settled in Ontario, 17.8% in Quebec, 17.1% in Alberta, 14.5% in British Columbia, and 11.7% in the rest of the country.
Recent immigrants mainly from asia
Asia (including the Middle East) remained by far Ontario’s largest source of immigrants between 2011 and 2016, with 68.8% of newcomers arriving from the region, up from 63.1% during the 2006-2011 period.
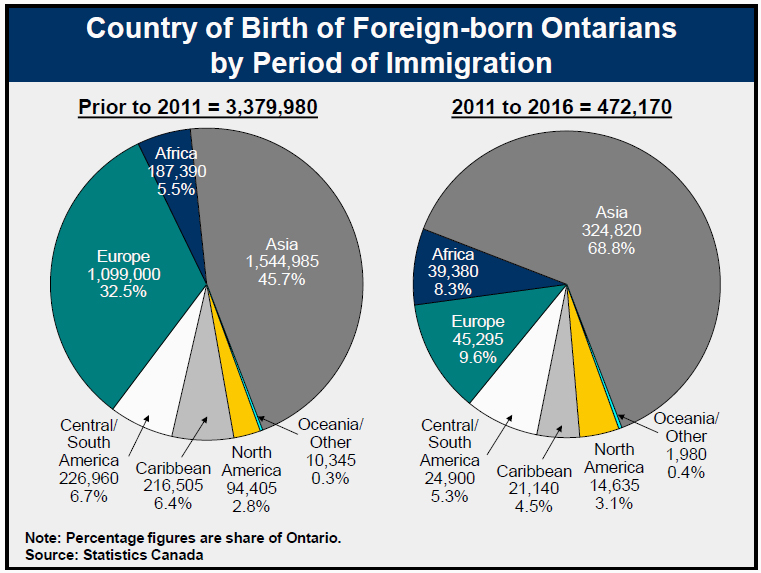
Newcomers born in Europe made up the second largest group at 9.6% of recent immigrants. Comparatively, 32.5% of foreign-born Ontarians who immigrated prior to 2011 were born in Europe.
The combined share of recent immigration from the Caribbean, Central and South America declined from 12.2% during 2006-11 to 9.8% over 2011-16. Africa’s share remained relatively stable at 8.3%.
India was the leading source country of newcomers to Ontario from 2011 to 2016, accounting for 14.7% of the total, followed by China (12.5%), the Philippines (11.3%), Pakistan (5.4%) and Iran (4.5%).
Toronto is canada’s major immigrant gateway
The 2016 Census enumerated 2,705,550 foreign-born individuals in the Toronto Census Metropolitan Area (CMA) in 2016, the largest number of any CMA in the country. These individuals comprised 70.2% of Ontario’s and 35.9% of Canada’s overall immigrant populations.
Between 2011 and 2016, the foreign-born population grew by 6.6% in the Toronto CMA, compared to 4.4% for the Canadian-born population.
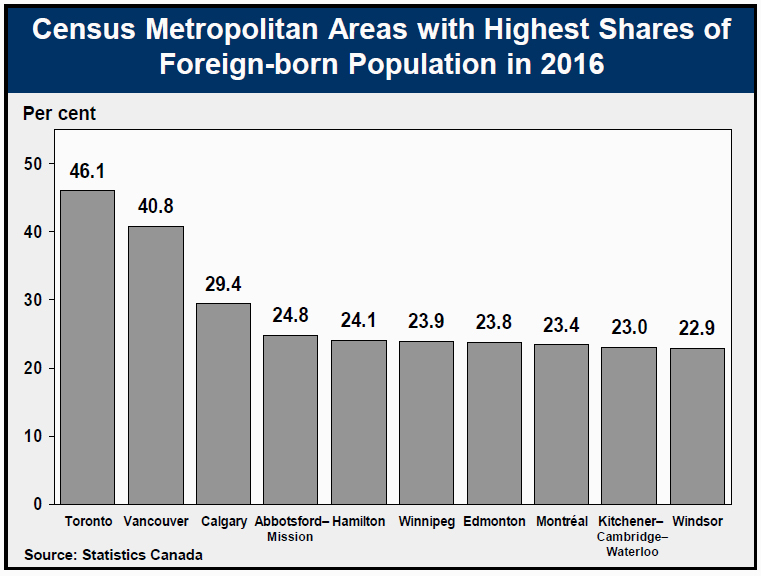
Toronto’s foreign-born population accounted for 46.1% of its total population in 2016, up slightly from 2011 (46.0%) and still the highest share among CMAs in Canada. Vancouver came in second at 40.8%. The Hamilton CMA, at 24.1%, was fifth nationally and the second highest in Ontario.
More than three-quarters of new immigrants to Ontario settled in the toronto CMA
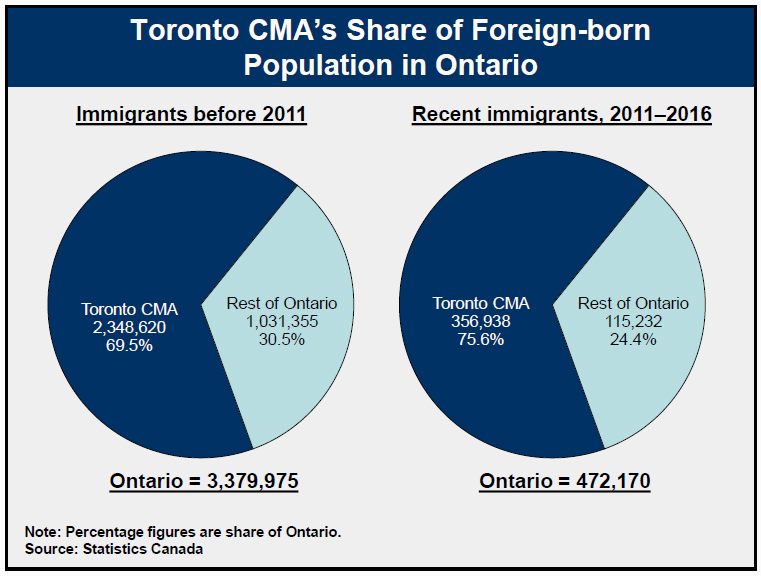
Of the 472,170 people who immigrated to Ontario between 2011 and 2016, an estimated 356,930, or 75.6%, chose to settle in the Toronto CMA. These recent immigrants made up 6.1% of Toronto's total population in 2016.
The top two source countries of recent immigrants to Toronto were India and China. Combined, these two countries accounted for more than three out of every ten newcomers to the Toronto CMA. From 2011 to 2016, 58,820 immigrants or 16.5% of all newcomers settling in the Toronto CMA were from India. An additional 49,815 newcomers, or 14.0% of the total, arrived from China.
High share of foreign-born population in municipalities surrounding the city of Toronto
The City of Toronto was home to 1,266,000 foreign-born individuals in 2016, the largest number among Ontario municipalities. However, many municipalities surrounding Toronto had higher shares of foreign-born population.
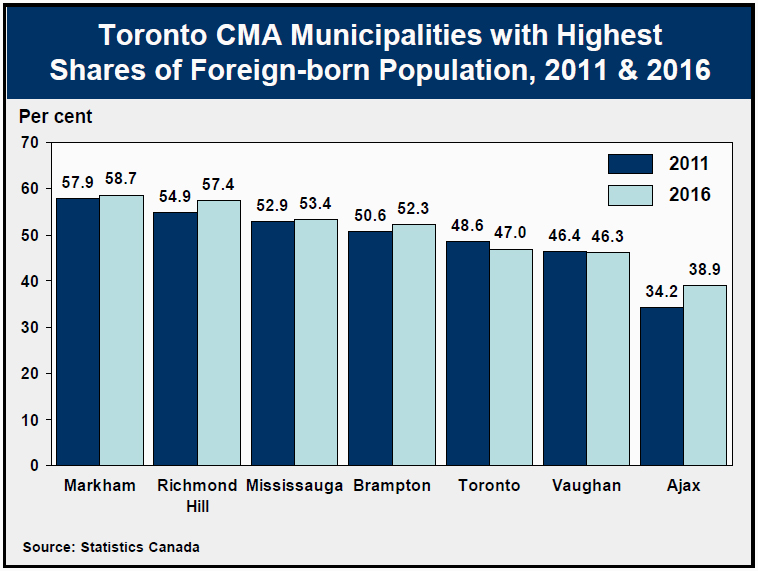
In Markham, almost six out of 10 (58.7%) residents were born outside Canada, up from 57.9% in 2011. This was the highest proportion in Ontario and the second highest in Canada after Richmond, British Columbia (60.2%).
Other Toronto CMA municipalities with high shares of foreign-born population include Richmond Hill (57.4%), Mississauga (53.4%), Brampton (52.3%) and Toronto (47.0%).
Toronto is seeing a decline in its share of foreign-born in population, down from 50.0% in 2006.
Accessible image descriptions
Share of foreign-born population in Ontario
This bar chart shows the share of foreign-born population in Ontario from 1911 to 2016. The share was 20.1% in 1911, went down to a low of 18.5% in 1951, and has been going up since to reach 29.1% in 2016.
Provincial distribution of immigrants to Canada
This pie chart show the provincial distribution of immigrants to Canada. Among immigrants who arrived before 2011, 53.4% went to Ontario, 17.7% to BC, 13.8% to Quebec, 10.1% to Alberta and 5.0% to the rest of the country. Among recent immigrants, 39.0% went to Ontario, 17.8% to Quebec, 17.1% to Alberta, 14.5% to BC and 11.7% to the rest of Canada.
Country of birth of foreign-born Ontarians by period of immigration
This pie chart show the country of birth of foreign-born Ontarians by period of immigration. Prior to 2011, 45.7% of immigrants to Ontario came from Asia, 32.5% from Europe, 6.7% from Central/South America, 6.4% from the Caribbean, 5.5% from Africa, 2.8% from North America and 0.3% from Oceania/Other. From 2011 to 2016, 68.8% of immigrants to Ontario came from Asia, 9.6% from Europe, 5.3% from Central/South America, 4.5% from the Caribbean, 8.3% from Africa, 3.1% from North America and 0.4% from Oceania/Other.
Census metropolitan areas with highest shares of foreign-born population in 2016
This bar chart shows census metropolitan areas with the highest shares of foreign-born population in 2016. These were Toronto (46.1%), Vancouver (40.8%), Calgary (29.4%), Abbotsford-Mission (24.8%), Hamilton (24.1%), Winnipeg (23.9%), Edmonton (23.8%), Montreal (23.4%), Kitchener-Cambridge-Waterloo (23.0%) and Windsor (22.9%).
Toronto CMA’s share of foreign-born population in Ontario
This pie chart show the Toronto CMA’s share of foreign-born population in Ontario. Among immigrants before 2011, 69.5% reside in the Toronto CMA, and 30.5% in the rest of Ontario. Among recent immigrants, 75.6% reside in the Toronto CMA and 24.4% in the rest of Ontario.
Toronto CMA municipalities with highest shares of foreign-born population, 2011 & 2016
This bar chart shows the Toronto CMA municipalities with the highest share of foreign-born population in 2011 and 2016. From 2011 to 2016, the share in Markham went from 57.9% to 58.7%, in Richmond Hill from 54.9% to 57.4%, in Mississauga from 52.9% to 53.4%, in Brampton from 50.6% to 52.3%, in Toronto from 48.6% to 47.0%, in Vaughan from 46.4% to 46.3%, and in Ajax from 34.2% to 38.9%.