Households and living arrangements
Households
Household size continues to decline
The 2016 Census counted 5,169,170 private households in Ontario, up 5.8% from 2011.
The number of private households has been growing faster than the population in private households, which grew 4.6% between 2011 and 2016. As a result, the average household size declined from 2.59 to 2.56.
There has been a steadily increasing trend toward smaller households.
The most common household size reported was 2-person, accounting for 32.8% of all households.
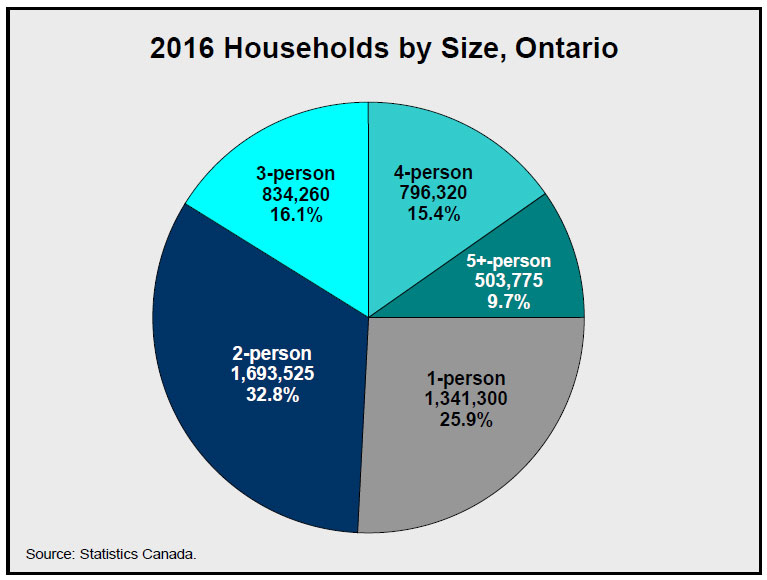
The Census found that there were slightly more one-person households than there were households with four or more persons, with shares of 25.9% versus 25.1%, respectively.
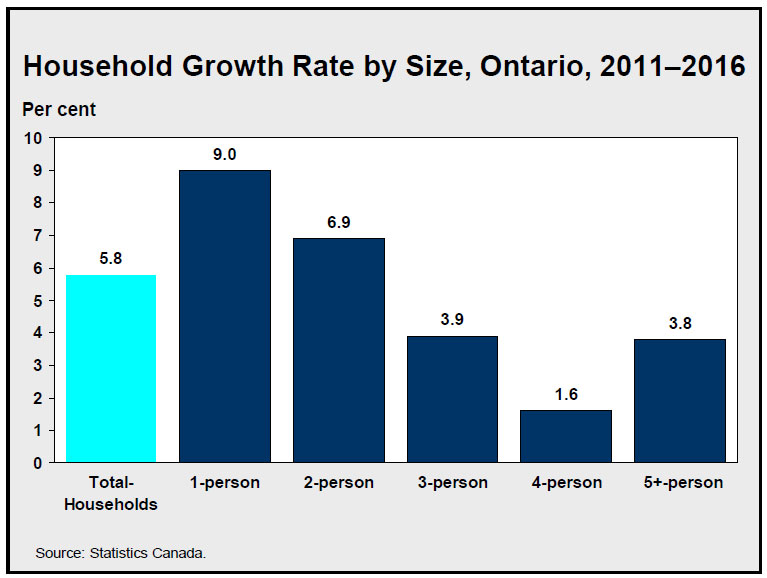
Between 2011 and 2016, smaller household sizes grew faster than larger households. The number of one-person households in Ontario rose 9.0% over the period, while the number of households with three persons or more increased by 3.0%.
Non-family households increasing rapidly
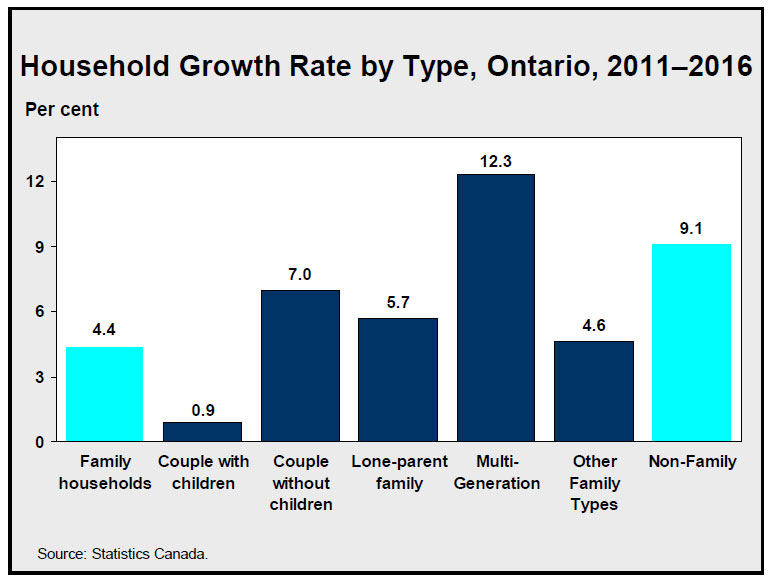
The number of family households in Ontario rose 4.4% over the 2011-16 period, much slower than the increase in non-family households, which grew 9.1%.
Couples with children at home: slowest growing household type
The number of households comprised of couples with children increased by only 0.9% between 2011 and 2016, while those comprised of couples without children rose by 7.0%.
The slow growth in households comprised of couples with children reflects not only low levels of fertility, but also the aging of the population.
Multi-generation family households were the fastest-growing type, recording an increase of 12.3% over 2011-16.
The number of lone-parent family households rose 5.7% over the same period.
Living arrangements
Almost 6.3 million or 56.8% of Ontarians aged 15 and over in private households lived with a spouse or partner in 2016, slightly lower than in 2011 (57.4%).
The proportion of those living with a spouse or partner peaked for women at ages 40 to 44 (72.4%), while for men this did not occur until ages 70 to 74 (80.1%).
More couples living common-law
The Census enumerated 905,670 Ontarians aged 15 and over who lived in a common-law union in 2016. They represented 8.2% of people in this group, up from 7.5% in 2011. They also accounted for a higher share of couples in 2016 than in 2011 (14.4% Vs. 13.1%).
Common-law unions were most prevalent among young adults. It is also among people aged 15 to 34 that the share of people living common-law is increasing fastest.
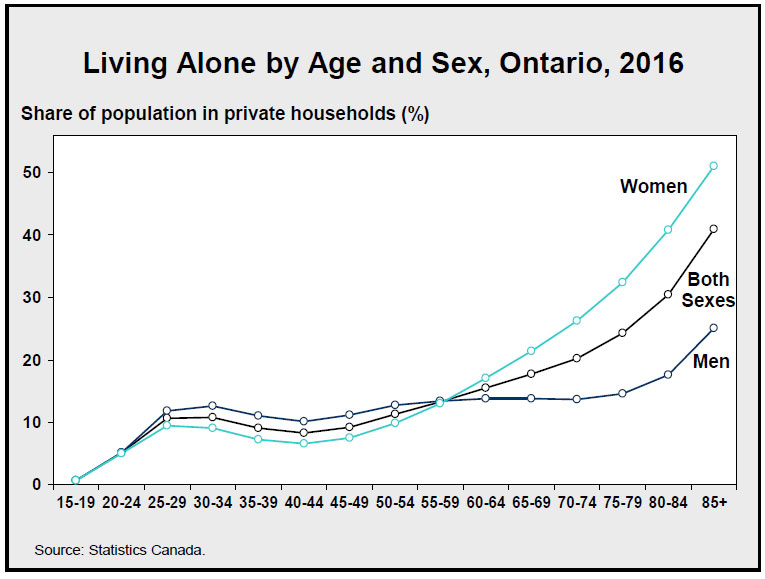
Living alone
In 2016, over 1.3 million Ontarians lived alone, representing 12.2% of the population aged 15 and over in private households, up slightly from 11.7% in 2011.
Males lived alone in higher proportions than women at younger ages, while senior women had higher incidence of living alone than senior men.
More young adults living with their parents
In 2016, 70.1% of Ontarians aged 20-24 lived with a parent, up from 69.1% in 2011. The share of those aged 25-29 living with a parent rose from 34.8% in 2011 to 37.3% in 2016.
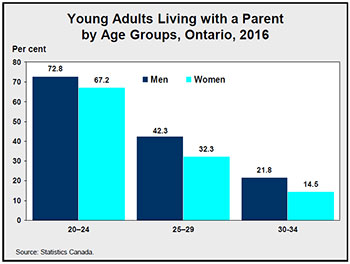
The proportion of men living with a parent was higher than the proportion of women at all ages, and was about twice as high past age 30.
Nationally, Ontario was the province with the highest incidence of youths aged 20-29 living in their parental home at 53.9%.
Oshawa had the highest incidence among Canadian Census Metropolitan Areas (CMAs) at 62.3%. Among other Ontario CMAs, high proportions were also found in Toronto (59.9%), Hamilton (57.8%), Windsor (54.0%), Barrie (53.5%) and Brantford (52.5%). The lowest proportions were in Kingston (35.0%), Greater Sudbury (39.5%), and London (41.6%).
Accessible image descriptions
2016 Households by size, Ontario
This pie chart shows 2016 households by size in Ontario. 25.9% were 1-person, 32.8% were 2-person, 16.1% were 3-person, 15.4% were 4-person and 9.7% were 5+ person.
Household growth rate by size, Ontario, 2011–2016
This bar chart shows household growth rate by size in Ontario over 2011-2016. Total households grew 5.8%, 1-person households by 9.0%, 2-person households by 6.9%, 3-person households by 3.9%, 4-person households by 1.6% and 5+ person households by 3.8%.
Household growth rate by type, Ontario, 2011–2016
This bar chart shows household growth rates by type in Ontario over 2011-2016. All family households grew by 4.4%, couples with children grew 0.9%, couples without children grew 7.0%, lone-parent families grew 5.7%, multi-generation families grew 12.3%, other family types by 4.6% and non-family households by 9.1%.
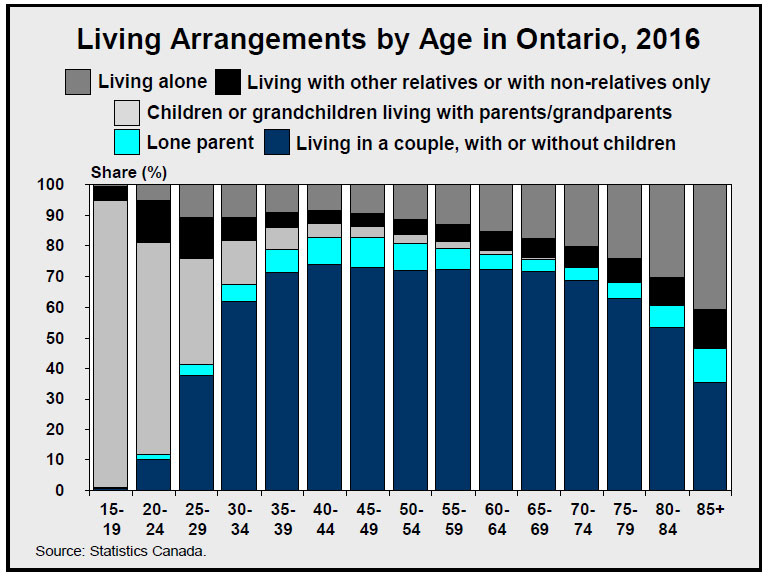
Living arrangements by age in Ontario, 2016
This chart shows living arrangements by age in Ontario in 2016. Most people aged 15-24 lived with their parents or grandparents, most people aged 25-84 lived in a couple with or without children, and most people aged 85+ lived alone or with other relatives or non-relatives.
Living alone by age and sex, Ontario, 2016
This line chart shows the share of population in private households living alone by age and sex in 2016. Both men and women were living alone in the same proportion of about 10% up until age 60, after which the proportions rose, but much faster for women than men.
Young adults living with a parent by age groups, Ontario, 2016
This bar chart shows the share of young adults living with a parent by age group in Ontario in 2016. Among 20-24 year-olds, 72.8% of men and 67.2% of women lived with a parent. Among 25-29 year-olds, 42.3% of men and 32.3% of women lived with a parent. Among 30-34 year-olds, 21.8% of men and 14.5% of women lived with a parent.