Families and marital status
Families
A census family is defined as a married couple or a common-law couple, with or without children, or a lone-parent living with at least one child, living in the same dwelling. A couple can be of the opposite sex or of the same sex.
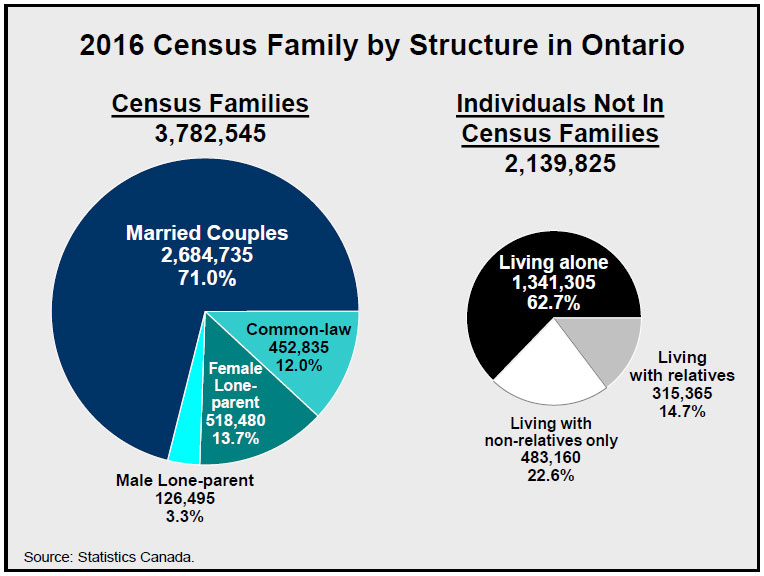
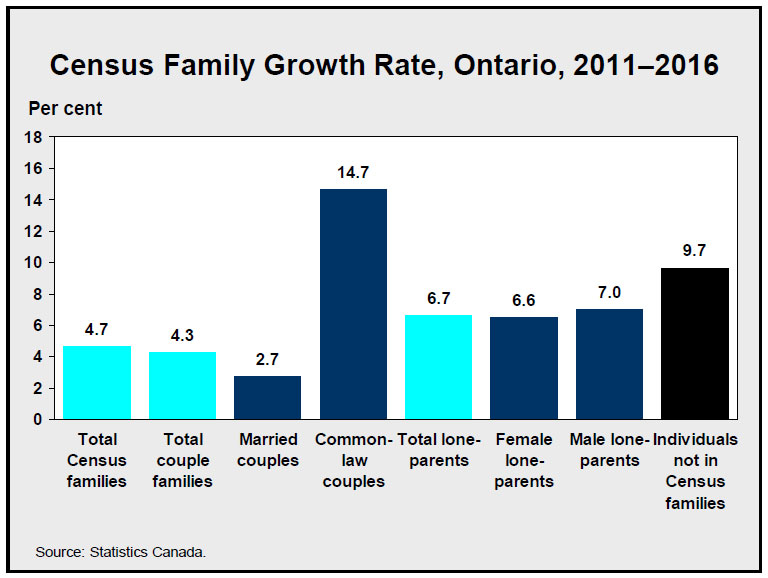
The 2016 Census enumerated 3,782,543 census families in Ontario, up 4.7% from 2011. Married-couple families constituted the largest group, but their share declined from 72.3% in 2011 to 71.0% in 2016.
There were 2,139,825 individuals not belonging to Census families in 2016, most of whom lived alone.
Common-law couple families increasing fastest
The Census counted 2,684,735 married-couple families, up 2.7% from 2011. In contrast, the number of common-law-couple families grew over five times faster, rising 14.7%, from 394,670 in 2011 to 452,835 in 2016.
The number of individuals not in a Census family grew rapidly between 2011 and 2016, rising 9.7%.
The proportion of common-law-couple families rose from 10.9% in 2011 to 12.0% in 2016, while the share of lone-parent families increased from 16.7% to 17.1%.
The number of lone-parent families increased by 6.7%, from 604,645 in 2011 to 644,975 in 2016. Lone-father families rose slightly faster (7.0%) than did lone-mother families (6.6%).
Four out of five lone-parent families were headed by women in 2016, a slight decline from 80.5% to 80.4%.
In 2016, there were 26,583 same-sex couples in Ontario, which represented 1.1% of all couples. Between 2011 and 2016, the number of same-sex couples increased by 13.7%.
Slow growth in married couples with children
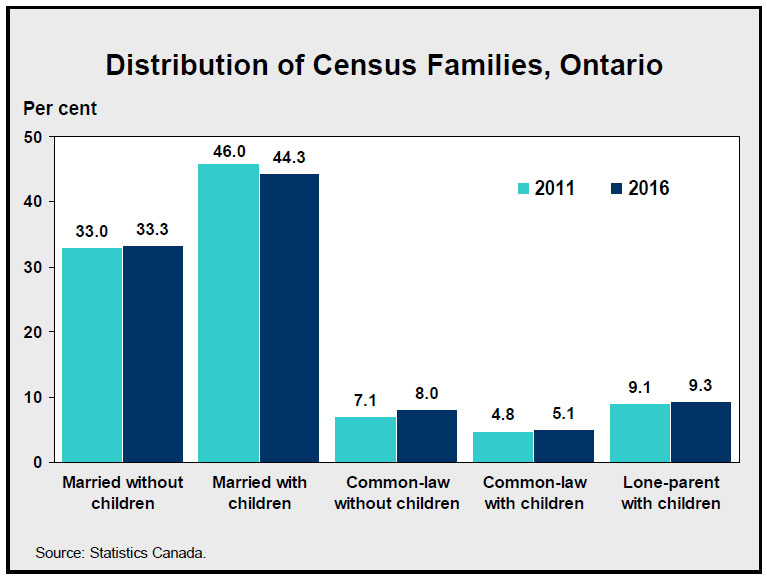
The number of married couples with children in Ontario was the slowest-growing type of private household over 2011-16. By contrast, the number of common-law couples without children grew 16.7%.
The share of married couples without children rose from 33.0% to 33.3%, while the proportion of married couples with children declined from 46.0% to 44.3% over the 2011-16 period.
Marital status
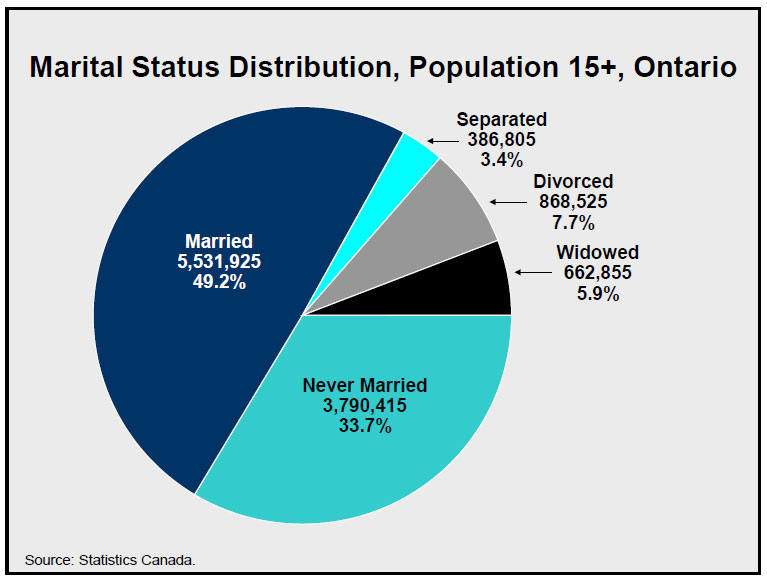
The share of Ontario’s population aged 15 and over who are married fell to 49.2% in 2016 from 50.3% in 2011.
However, the number of married people (legally married and not separated) aged 15 and over grew 3.1% between 2011 and 2016 (from 5.4 million to 5.5 million).
The 2016 Census enumerated almost 3.8 million Ontarians aged 15 and over who had never legally married, up from 3.5 million in 2011, an increase of 8.4%. They accounted for 33.7% of the population, up from 32.8% in 2011.
Those separated, divorced or widowed made up 17.1% of the population in 2016, up from 16.9% in 2011.
Divorced population grew the fastest
Over the 2011 and 2016 period, the divorced population was the fastest-growing marital status, rising 9.6%.
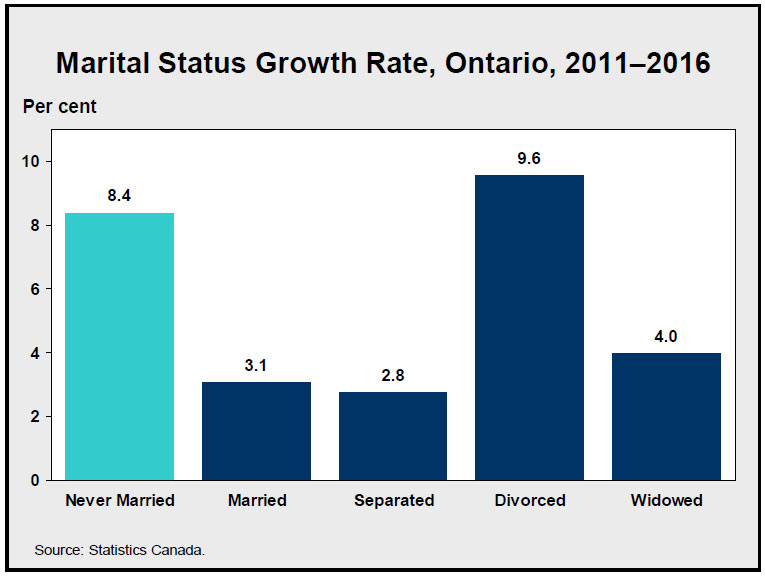
The number of divorced Ontarians aged 15 and over increased from 792,460 in 2011 to 868,525 in 2016. They represented 7.7% of the population aged 15 and over in 2016, up from 7.4% in 2011.
The proportion of Ontario's elderly (65+) who are divorced is relatively low at 9.6% compared to younger age groups (e.g.,14.2% at ages 55-59).
Older men married; Older women widowed
Older men are more likely to have a married status and older women are more likely to be widowed.
In Ontario, 72.4% of men aged 65 and over were married compared to 47.3% of women in 2016. Even at ages 85 and older, a majority of men were married (58.5%), while only 16.6% of women were.

In contrast, 34.9% of women aged 65 and over were widowed compared to 10.9% of men in 2016.
The gender difference in marital status results from a combination of factors: (i) women live longer than men; (ii) women tend to marry men older than themselves, which, combined with the gender difference in life expectancy, increases the chance that a woman will find herself without a spouse in her older age; and (iii) older widowed men have higher remarriage rates than older widowed women.
Accessible image descriptions
2016 Census family by structure in Ontario
This pie chart shows that 71,0% of all Census families in 2016 were married couples, 12.0% were common-law, 13.7% were female lone-parent, and 3.3% were male lone-parent. Among individuals not in Census families, 62.7% were living alone, 14.7% were living with relatives, and 22.6% were living with non-relatives only.
Census family growth rate, Ontario, 2011–2016
This bar chart shows the growth rates by Census family type over 2011-2016. Total Census families grew 4.75%, total couples 4.3%, married couples 2.7%, common-law couples 14.7%, total lone parents 6.7%, female lone-parents 6.6%, male lone-parents 7.0%, and individuals not in Census families 9.7%.
Distribution of census families, Ontario
This bar chart shows the distribution of Census families in Ontario in 2011 and 2016. Married without children increased from 33.0% of all families in 2011 to 33.3% in 2016, married with children from 46.0% to 44.3%, common-law without children from 7.1% to 8.0%, common-law with children from 4.8% to 5.1%, and lone-parent with children from 9.1% to 9.3%.
Marital status distribution, population 15+, Ontario
This pie chart shows the distribution of Ontario’s population aged 15+ by marital status in 2016. 49.2% were married, 33.7% were never married, 7.7% were divorced, 5.9% were widowed, and 3.4% were separated.
Marital status growth rate, Ontario, 2011–2016
This bar chart shows the growth rate by marital status in Ontario over 2011-2016. Never married increased by 8.4%, married by 3.1%, separated by 2.8%, divorced by 9.6%, and widowed by 4.0%.
Marital status distribution, population 65+, Ontario
This chart shows the marital status distribution of the population aged 65+ in Ontario in 2016. 5.2% of males were never married, 72.4% married, 3.0% separated, 8.6% divorced, and 10.9% widowed. 5.1% of females were never married, 47.3% married, 2.3% separated, 10.4% divorced, and 34.9% widowed.