Introduction
Lake Simcoe plays a vital economic and ecological role in southern Ontario, supporting agriculture, tourism, recreation and urban development. Its 2,899 km² watershed—nearly twice the size of Prince Edward County—spans 22 municipalities and contains important natural, urban and agricultural systems that are essential to the region and Ontario. The watershed includes some of Canada’s most productive farmland, which makes up approximately half of the area and generates over $450 million in annual agricultural sales. Lake Simcoe also provides drinking water to 7 municipalities, has a provincially significant all-season sport fishery and is a popular tourist destination that further contributes to the local economy.
The lake holds special cultural significance for Indigenous peoples, including its role in traditional fishing practices. More than 500,000 people currently live in the watershed, with the population expected to grow to 900,000 by 2051, underscoring the lake’s importance to both urban and rural communities. Since 2018, Ontario has committed over $37 million in initiatives to protect and restore Lake Simcoe, including a $24 million phosphorus reduction project and more than $13 million in ongoing programs to improve watershed health and monitoring to track the health of the lake.
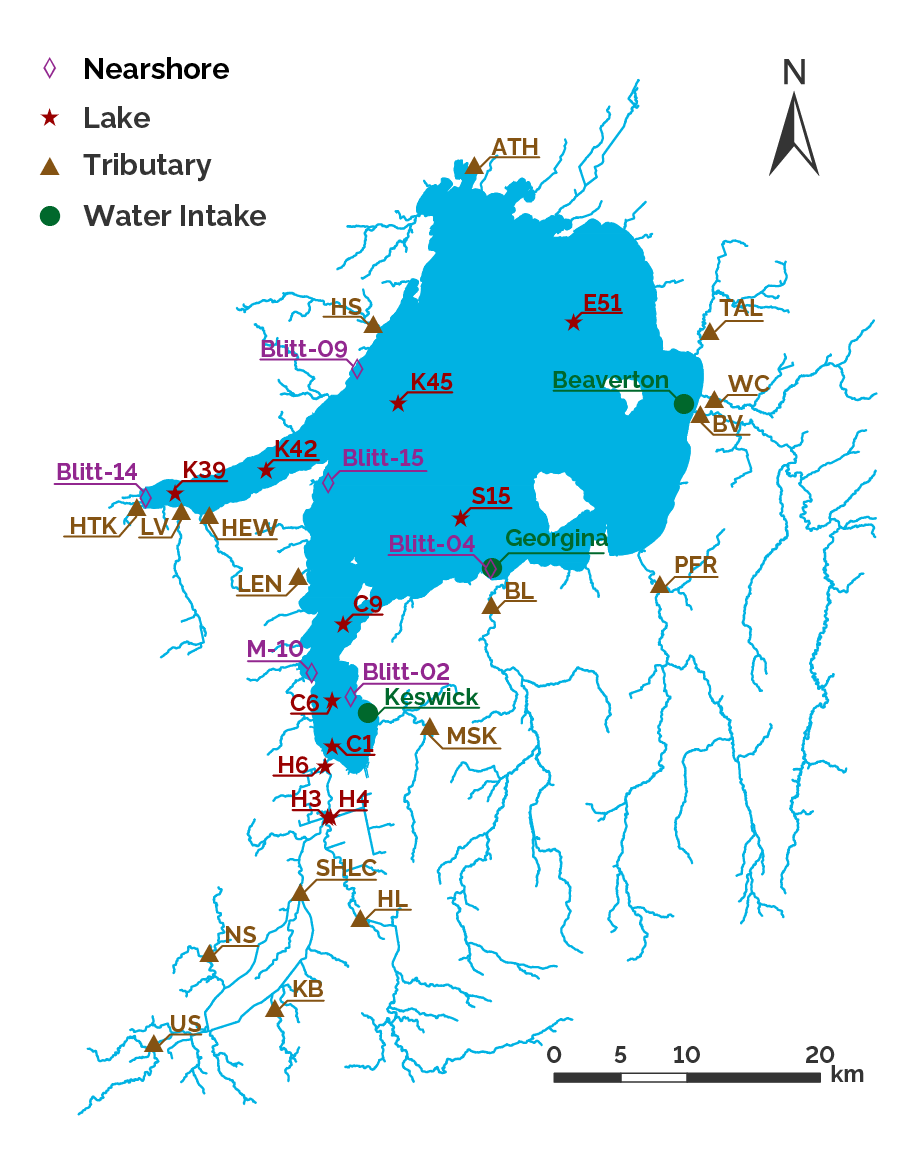
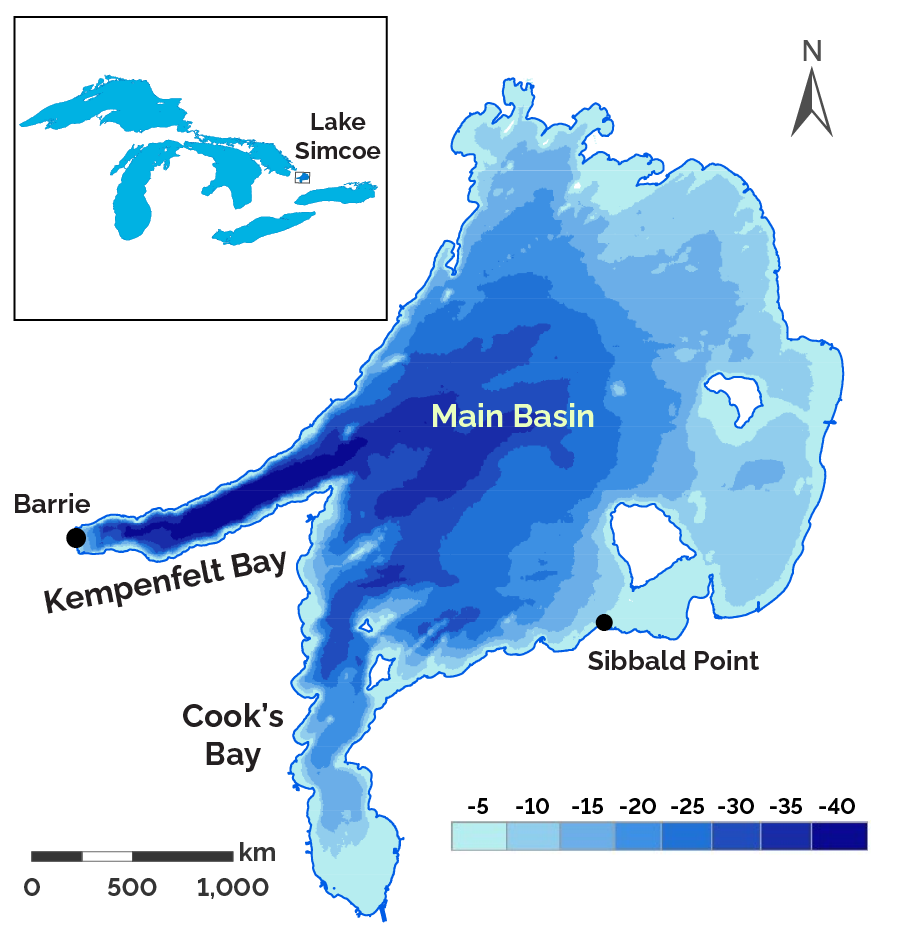
Monitoring of Lake Simcoe and its watershed is a continuous and collaborative effort to achieve the goals of the Lake Simcoe Protection Act. This involves collaboration between the Ministry of the Environment, Conservation and Parks (MECP), the Ministry of Natural Resources (MNR) and Lake Simcoe Region Conservation Authority (LSRCA), along with research and monitoring studies performed with academics. Many Lake Simcoe monitoring programs have been ongoing for over 4 decades, including extensive water quality monitoring beginning in 1980 at many stations (Figure 1) at varying depths across the lake (Figure 2).
The 15-year Lake Simcoe Monitoring Report details the results of monitoring programs and research efforts to improve the health of, and protect, the Lake Simcoe watershed. The report is guided by the Lake Simcoe Protection Plan (2009), which outlines numerous ecological indicators and targets that inform the ecological health of Lake Simcoe and its watershed and policies for monitoring and research to track them.
The report builds on the 5-year monitoring report (Young and Jarjanazi 2015) [PDF] by providing an update on Lake Simcoe monitoring and research up to 2022. Monitoring categories covered in the report include:
- the watershed: natural heritage and high-quality cover
- invasive species
- climate change
- water quality
- aquatic life
Over the past 200 years, extensive human use of the Lake Simcoe watershed has put significant strain on its ecosystem. The lake began showing impairment from high phosphorus inputs as a result of increased human settlement and more land being used for agriculture in the early 20th century (Hawryshyn et al. 2012). By the 1970s, the lake was showing obvious signs of stress such as excessive plant growth and a decline in the coldwater fishery.
Today, phosphorus is no longer the only stressor to Lake Simcoe. Climate change and invasive species have also resulted in changes to the Lake Simcoe ecosystem. Additionally, chloride levels in the lake and tributaries are increasing (Young and Jarjanazi 2015). Given the significant changes observed in the Lake Simcoe watershed over recent decades, the final section of this report synthesizes results in this changing lake.
Footnotes
- footnote[1] Back to paragraph The full names for the tributary stations in Figure 1 are: Black River (BL), Beaver River (BV), Hewitts Creek (HEW), East Holland River (HL), Hawkestone Creek (HS), Hotchkiss Creek (HTK), Kettleby Creek (KB), Leonards Creek (LEN), Lovers Creek (LV), Maskinonge River (MSK), North Schomberg River (NS), Pefferlaw Brook (PFR), West Holland River (SHLC), Talbot River (TAL), Upper Schomberg (US) and Whites Creek (WC).