Lake Simcoe Watershed
Based on 2018 land cover data analyzed by the LSRCA, the composition of the Lake Simcoe watershed has changed since the last monitoring report. The total land area of the Lake Simcoe watershed that was agricultural decreased to 43.3% from 45%, while urban areas have increased to 12.2% from 7%, and this increase is projected to continue (LSRCA 2024). The remaining 44.4% of the watershed is natural cover as defined by the LSRCA, which includes cultural thickets and meadows. The MNR’s estimate of natural cover was not available, as it is only available every 5 years. It would be lower than the LSRCA’s, however, as cultural thickets and meadows, which are previously disrupted land covers, are not included in the MNR’s estimates and would not be considered “high quality natural cover”, which is a different metric than “natural cover”.
Natural heritage
The MNR has assessed changes in woodland and wetland cover on the Lake Simcoe watershed over a 20-year period from 2000 to 2020. The amount of woodland and wetland cover on the Lake Simcoe watershed continues to show a gradual rate of loss (Table 1). Over the past 5-year period (2015 to 2020), woodlands lost 245 ha and wetlands lost 113 ha. These losses are comparable to previous 5-year periods. From 2010 to 2015, woodlands lost 318 ha and wetland lost 226 ha, and from 2005 to 2010, woodlands lost 217 ha and wetlands lost 193 ha.
| Class | 2000 (ha) | 2005 (ha) | 2010 (ha) | 2015 (ha) | 2020 (ha) |
|---|---|---|---|---|---|
| Woodlands | 47,221 | 47,004 | 46,787 | 46,469 | 46,224 |
| Wetlands (total) | 48,991 | 48,760 | 48,567 | 48,341 | 48,228 |
| Wetlands (coastal | 2,371 | 2,371 | 2,371 | 2,371 | 2,371 |
| Wetlands (inland) | 46,620 | 46,389 | 46,196 | 45,970 | 45,857 |
High quality natural cover
In the natural heritage chapter of the LSPP, there is a target of 40% high-quality natural vegetative cover in the watershed. Natural cover includes:
- woodlands
- swamps
- non-treed wetlands
- savannah
- grasslands (including prairie-like and prairie)
- alvars
- sand barrens.
The 5-year monitoring report stated that in 2008/09 the Lake Simcoe watershed had 35% natural cover but at the time it was not possible to determine how much of that was “high quality”.
To quantify high-quality natural cover, in 2017, MNR, MECP and University of Toronto implemented a strategically designed site-level monitoring program for the Lake Simcoe watershed based on the Vegetation Sampling Protocol (VSP). Specifically, site-level data from the VSP plot network provided detailed information on vegetation structure and composition that allowed the development of 6 indicators of the quality of natural cover. The 6 indicators combined are intended to create a composite index of natural cover quality. All of the indicators are specific to the habitat type being examined (such as forests, wetlands or other natural vegetative cover). The indicators are:
- floristic quality
- weedless index
- above-ground biomass
- dead above-ground biomass
- forest regeneration
- vertical forest structure index
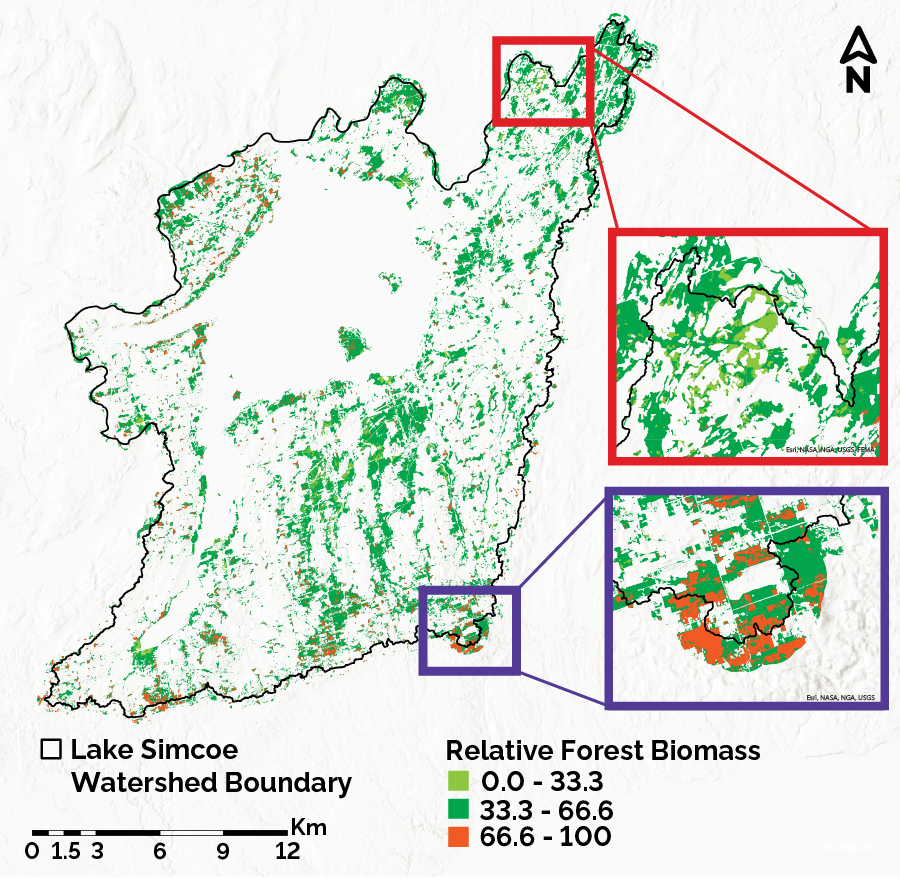
Above-ground biomass is an indicator of both forest quality and productivity. This indicator was derived per monitoring plot, but was also modelled and mapped across the entire watershed indicating areas with higher biomass (Figure 3). The above-ground biomass indicator also signifies a forest ecosystem’s ability to support other important ecological functions, such as biodiversity, carbon sequestration, nutrient cycling, habitat provisioning and maintenance of the hydrological cycle. Biomass can also be used to show the existing and potential ability of forests to store carbon and sequester carbon dioxide, and thus the ability of forests to mitigate the negative impacts of climate change.
During the VSP monitoring, it was recognized that the quality of a forest should be specific to the forest being examined and its successional stage. Recognizing these and their importance when defining high quality, forest succession on the Lake Simcoe watershed was modelled and mapped with the 2017 data (Figure 4).
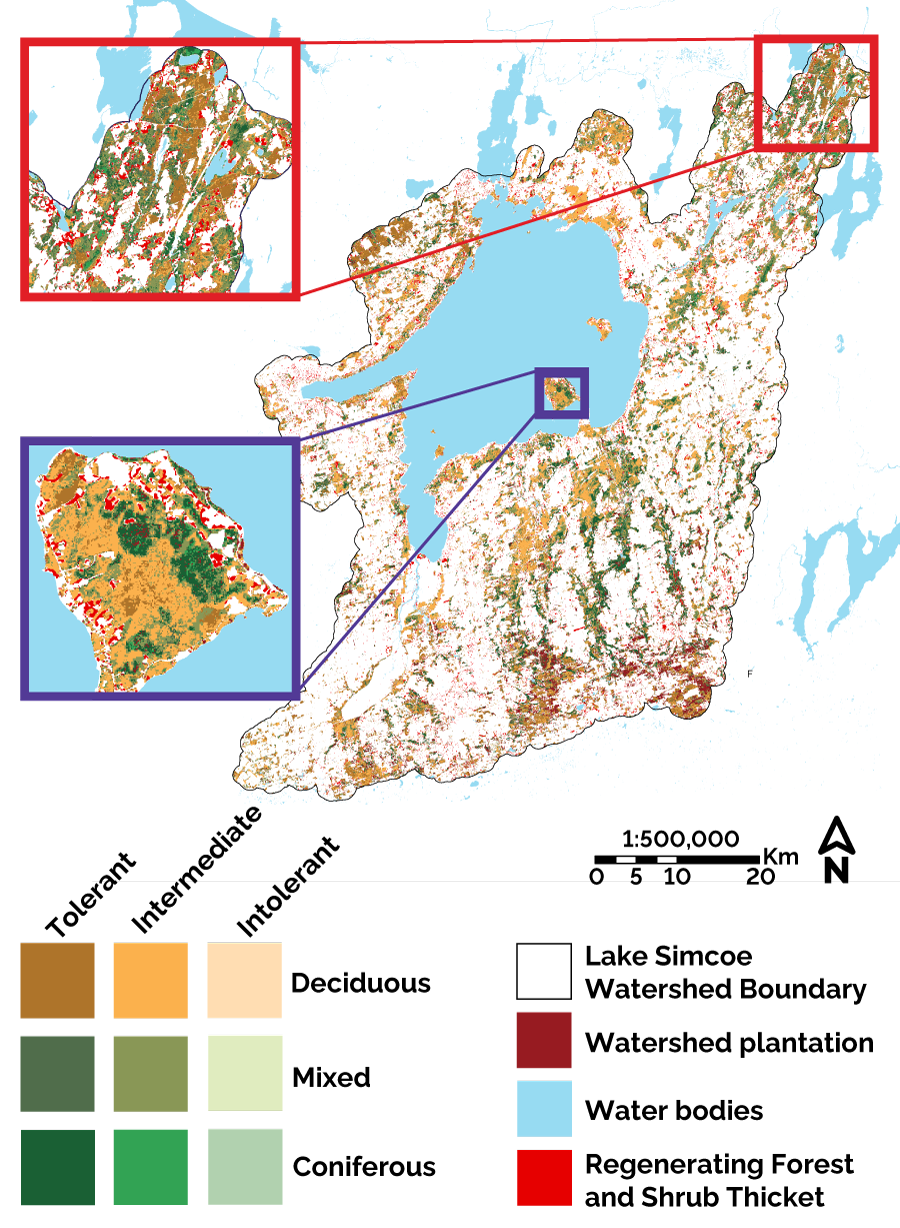
Coniferous, deciduous and mixed forests were classified as:
- early successional with shade-intolerant species
- mid successional with intermediate species
- late successional with shade tolerant species
- plantation
The total land area and percentage for different forest shade-tolerant classes are shown in Table 2. Tree species that are shade-intolerant, such as birch and poplar, require full sunlight and limited competition, grow in lower density stands, mature early, are shorter-lived and are also followed by other plant species more tolerant to open canopies and disturbances. Tree species that compete well under full shade are referred to as tolerant species, for example sugar maple, and tend to grow in higher stand densities, mature slowly, are longer-lived and have more closed canopy. They are also associated with plants that have mid to high floristic quality values. Intermediate tree species, such as white ash and green ash, predominate mid successional and secondary growth forests. These mid-successional forests are important to preserve so they can grow into late successional forests that have the highest quality. However, these forests are also impacted by the invasive species Emerald Ash Borer that has caused declines of ash tree populations.
| Forest shade tolerant classes | Total land area (ha) | Total % of land |
|---|---|---|
| Tolerant — late seral | 35,659 | 37 |
| Intolerant — early succession | 1,987 | 2 |
| Intermediate — mid-succession | 50,600 | 52 |
| Plantation | 9,183 | 9 |
| Total | 97,430 | 100 |
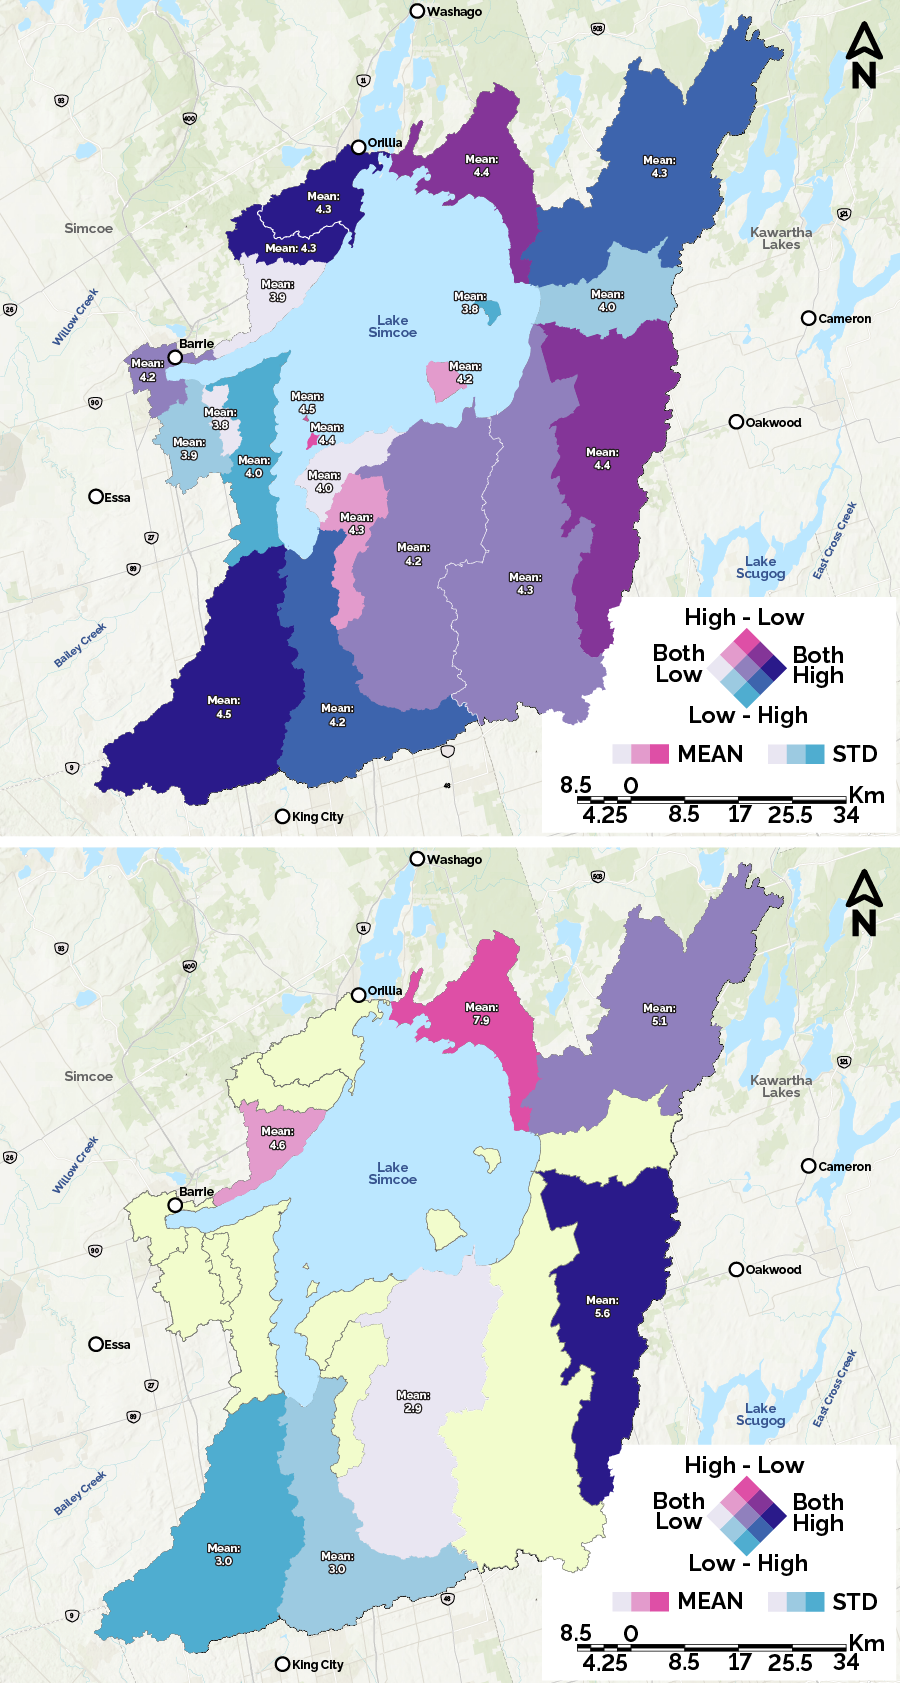
Another indicator is floristic quality, which is based on scores for native plant species according to their ability to tolerate anthropogenic disturbance and their reliance on specific habitats. Scores assigned to plants ranged from 0 to 10 with low values indicating plants that tolerate a range of conditions and disturbances, and high values indicating plants that tolerate less disturbance and that have specific abiotic requirements.
On the Lake Simcoe watershed in 2017, the floristic quality score was 4.2. This indicates the dominance of plants that were moderately tolerant of disturbance, suggesting natural vegetation on the watershed was neither highly degraded nor pristine. An intermediate floristic quality score like this can indicate that both disturbance-tolerant and more conservative species coexist in the vegetation community. Floristic quality was not modelled across all forest and other natural vegetation patches as was done for biomass; however, it was extrapolated across the subwatersheds, enabling ranking and comparisons among watersheds (Figure 5).
The development of the VSP and the site-level monitoring performed from 2011 to 2017 has provided an excellent foundation of detailed baseline information about high quality natural cover on the Lake Simcoe watershed. This baseline information along with continued research and monitoring will allow detection of changes to ensure that natural cover biodiversity and functions are maintained, protected and enhanced.
Footnotes
- footnote[1] Back to paragraph ] Based on Southern Ontario Land Resource Information System and Ontario Land Cover Dataset. Estimations go back to 2000 due to a recent standardization of provincial methodology (Ontario Land Cover Version 1.0) where 2015 baseline had some slight differences from previous estimations that resulted in a change with the definition of forest (% tree cover) to match the provincial standard, as well as some reclassification of forested wetlands (swamps) to upland forest.
- footnote[2] Back to paragraph Lake Simcoe coastal wetlands are located along Lake Simcoe and the Holland River shorelines where they are influenced by Lake Simcoe water levels.