Water quality
The quality of water in Lake Simcoe and its tributaries is critically important in supporting a diversity of aquatic life and providing drinking water to the human population.
For over 4 decades, the MECP, in collaboration with the LSRCA, has been monitoring the water quality of Lake Simcoe and its tributaries with only 2020 data missing due to the global COVID-19 pandemic. This valuable long-term data set has allowed changes to be tracked in key water quality indicators over time, such as improvements in the goals and targets of the LSPP, as well as keep an eye out for emerging issues.
Collaborations with partners have also been key, providing additional water quality monitoring locations to increase spatial coverage (refer to map in Figure 1). Since the mid-1980s, water treatment plant operators from Beaverton, Georgina (previously Sutton) and Keswick have provided weekly raw water samples from intake pipes drawing from the lake. The LSRCA have been monitoring additional nearshore sites of the lake since 2015.
Support has also been provided from the MECP’s laboratory for the analysis of these water chemistry samples. In this report, data are presented as annual averages. When water quality parameters were at concentrations below the detection limit of the laboratory equipment, Helsel’s (1990) statistical method was used.
Deepwater Dissolved Oxygen
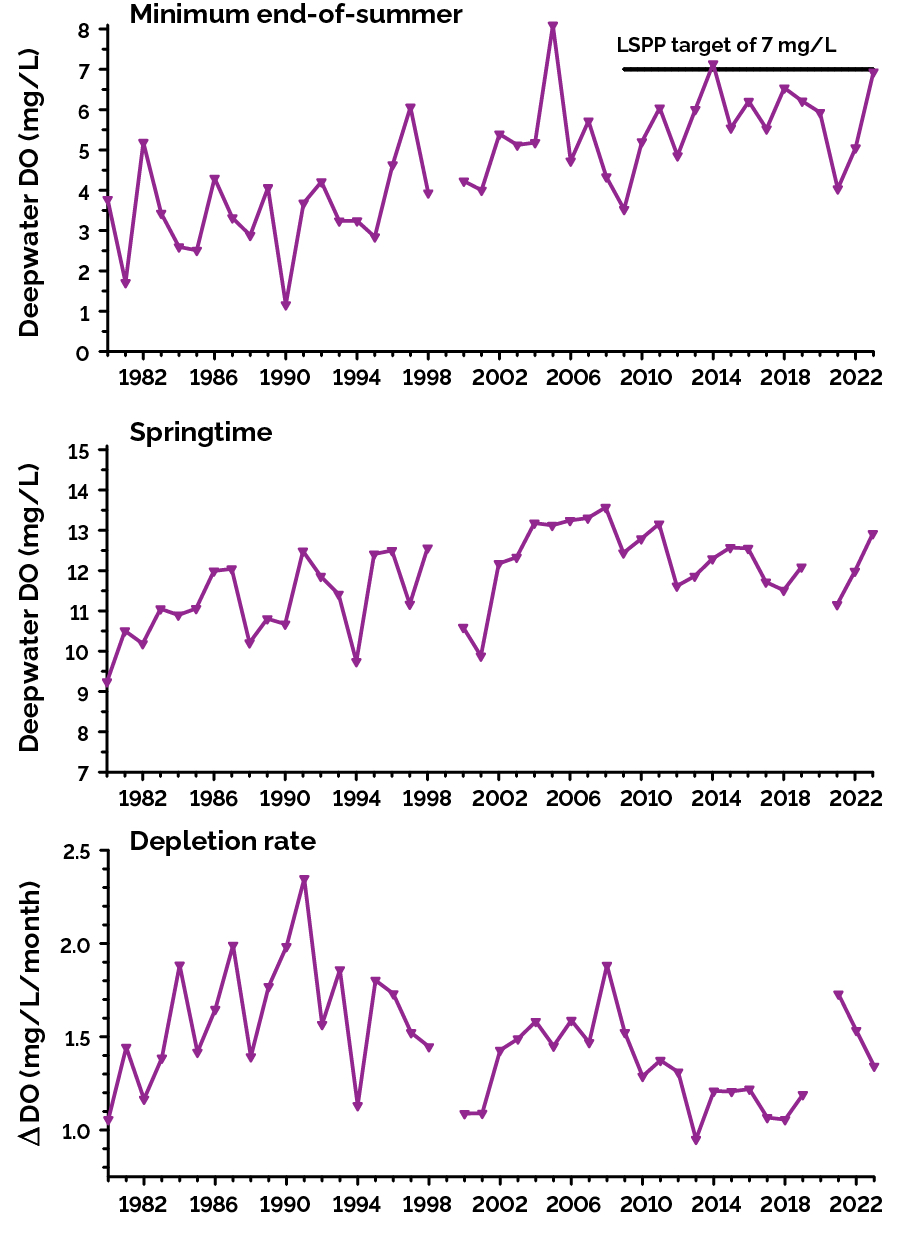
Dissolved oxygen in the deepwater of Lake Simcoe is a key indicator in the LSPP with an end-of-summer (September 15th) target of 7 mg/L. Oxygen is essential for aquatic animals and is particularly important in the deepwater habitat of coldwater fishes. In freshwater lakes, oxygen concentrations in the deepwater decline over the summer where oxygen is used up by decomposition and respiration, yet it is not replenished because the deepwater layer is cut off from surface layers due to stratification.
Improvements overall in the end-of-summer deepwater dissolved oxygen concentration have continued, but there has been substantial variation from year to year (top of Figure 17). For example, at the end of the summer of 2021, it was only 4.0 mg/L and it was 5.1 mg/L in 2022, while in 2023 it was just below the target at 6.9 mg/L. There has been an overall significant increase in the springtime deepwater dissolved oxygen concentration since 1980 (middle of Figure 17). Starting with more oxygen in the spring could contribute to higher oxygen levels at the end of the summer.
Another key factor determining the end-of-summer oxygen is the deepwater oxygen depletion rate, which is a measurement of how quickly oxygen is used up in the deep water over the summer. The oxygen depletion rate from June through September at station K42 has improved significantly overall over the past 4 decades but with substantial year-to-year variation (bottom of Figure 17).
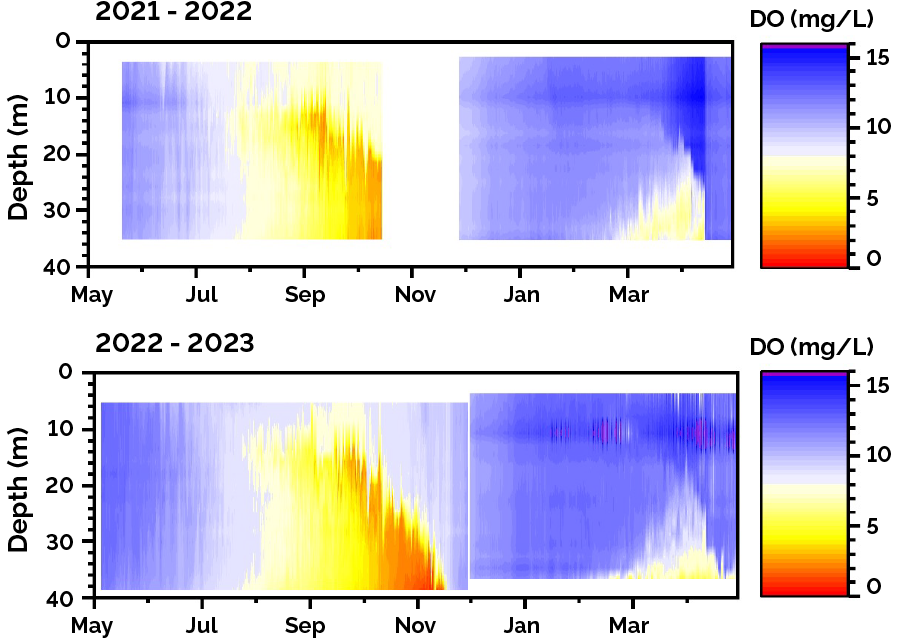
Historically, oxygen depletion started at the bottom of the lake (refer to Figure 29 from the 5-year Lake Simcoe Monitoring Report [PDF]) primarily from the decomposition of phytoplankton that sank to the lake bottom. It appears that in more recent years, the decline in oxygen has begun in the middle layer of the lake, the metalimnion, and then gradually moved deeper as the summer progressed (left side of Figure 18).
An oxygen pattern that is lowest in the metalimnion is called a negative heterograde and can have different causes, such as:
- decomposition of organic matter that is “caught” in the metalimnion because strong stratification prevents further sinking
- respiration in the metalimnion of high densities of zooplankton, fish and/or phytoplankton at night
- low oxygen levels in the water over the sediments along the edge of the lake basin that mixes laterally (sideways) through the metalimnion
In more recent years, oxygen depletion has continued to decline beyond September 15, sometimes well into November (for example, in 2022; see bottom of Figure 18). The mechanisms affecting oxygen depletion in Lake Simcoe appear to be changing. The MECP and partners continue to monitor and research these temporal and spatial changes in oxygen depletion in the lake to improve understanding of why they are happening and what effects they may be having.
Understanding under-ice oxygen dynamics
A key target in the LSPP is deepwater dissolved oxygen concentration at the end of the summer. The important components that determine this are:
- oxygen concentrations at the start of the stratified summer season
- timing of when the lake stratifies and oxygen depletion begins in the deepwater
- rate of oxygen depletion over the summer
Oxygen concentrations at the start of the stratified summer season are influenced by the winter and early spring oxygen dynamics. Because the lake is still covered in ice, traditional data collection methods are difficult. Using dataloggers (described above) moored under the ice at the deepest station in Lake Simcoe (K42), Yang et al. (2020) investigated dissolved oxygen (DO), temperature and light dynamics over the winters of 2015 to 2017, and into the spring and summer of 2016 and 2017.
Research into this important time of the year has continued in collaboration with the University of Toronto at Scarborough, and similar patterns have been observed during winters of 2022 to 2024 (Shi et al. submitted).
During observed winters, DO concentrations in the surface layer were generally highest just before ice-off. For example, surface DO peaked at 15.1 mg/L at ice-off on April 13, 2022, and 13.8 mg/L at ice-off on April 11, 2023 (right side of Figure 18). This increase in surface DO had occurred under the ice when the snow on top had melted. The “clean ice” had allowed sunlight into the lake, creating a shallow layer of warmer (and denser) water. The denser surface water would then sink, causing convective mixing. This mixing likely helped keep phytoplankton in the well-lit surface layer, where they could produce oxygen through photosynthesis and contribute to higher initial DO levels.
Winters with a longer period of clean ice had greater DO at the lake surface (Shi et al. submitted). After ice-off, the entire water column mixed from top to bottom until the mean water column temperature reached 4°C. At this time, the lake became weakly stratified and DO depletion in the deepwater began.
Fluid dynamics of Kempenfelt Bay
An important process affecting lake water quality dynamics is the exchange of water between lake basins. A study with the University of Toronto at Scarborough examined the fluid dynamics of the long, narrow and deep Kempenfelt Bay in Lake Simcoe (Flood et al. 2020). The study showed that there are large internal waves (or seiches) in the middle layer (the thermocline) of Kempenfelt Bay that circulate counterclockwise (westerly on its north side and easterly on its south side).
These seiches drive the exchange of waters between Kempenfelt Bay and the main basin, suggesting that Kempenfelt Bay is flushed more rapidly than what was previously assumed from estimating river flows. The water movements would contribute to the transfer of phosphorus inputs from cities such as Barrie (on the western tip of Kempenfelt Bay) eastward to the main basin. These internal waves in Kempenfelt Bay also caused water temperature and oxygen profiles to rise and fall up to 10 m vertically every 4 days.
Physical changes in water quality conditions can affect the aquatic community, such as sensitive coldwater fish species. Further monitoring and research by the University of Toronto at Scarborough is underway looking at how these physical processes affect water quality conditions in the main basin of Lake Simcoe.
Phosphorus
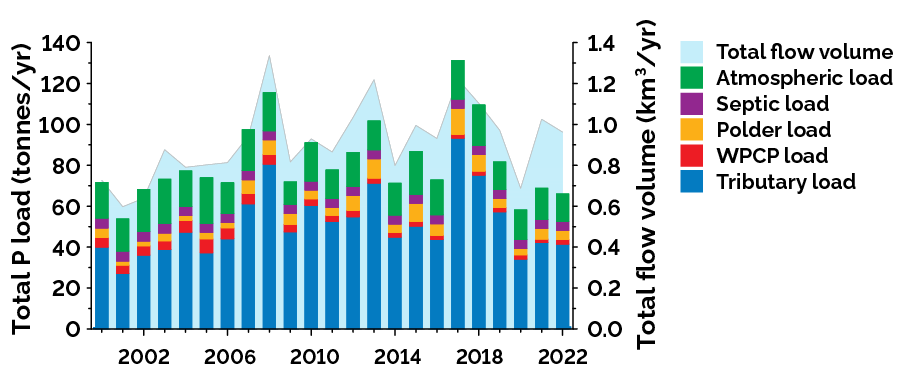
In freshwater ecosystems, phosphorus is a key nutrient that can limit algal and aquatic plant production. In Lake Simcoe in the 1970s, excess phosphorus input to the lake was identified as the primary stressor affecting its water quality with inputs estimated at over 100 tonnes/year. Since 2000, phosphorus loads to the lake have been estimated and reported by the LSRCA with support from the province. Phosphorus loads are reported by hydrologic year (June 1 to May 31) and include inputs from 5 sources:
- atmosphere
- septic systems
- polders (drained wetlands used for agriculture)
- water pollution control plants (WPCPs)
- tributaries
Total phosphorus loads have varied from year to year, with loads in some recent hydrologic years, such as 2017 and 2018, being over 100 tonnes (Figure 19). Of the different sources, tributaries contributed the most phosphorus to the total loads. Tributary loads are the product of the concentration of phosphorus in the tributary water and its flow volume. The flow volume of tributaries has significantly increased on the Lake Simcoe watershed, and years with higher loads have generally been years with higher flows.
Concentrations of phosphorus in Lake Simcoe tributaries tend to be greater in watersheds with predominantly urban land use (for example, East Holland) or agricultural areas (for example, Upper Schomberg), and lower in watersheds with greater natural cover (for example, Hawkestone Creek). There have been significant declines in phosphorus concentration in some tributaries since the 1980s, likely in response to water quality improvement initiatives such as best management practices, restoration projects and stormwater improvements (LSRCA 2024). The LSRCA reported that phosphorus concentration decreased significantly in 10 tributaries. Examples of 5 tributaries in agricultural subwatersheds with decreasing trends were:
- Kettleby Creek
- Beaver River
- West Holland River
- Pefferlaw River
- Upper Schomberg River
Examples of 2 tributaries in urban subwatersheds with decreasing trends were:
- Tannery Creek
- East Holland River
Four tributaries have increased in phosphorus concentration over the long term, possibly due to increasing urbanization in their subwatersheds (LSRCA 2024):
- Black River
- Maskinonge River
- Leonards Creek
- Lovers Creek
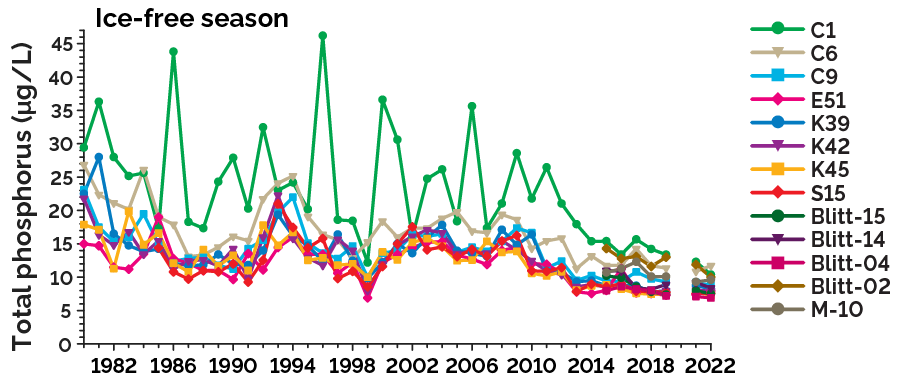
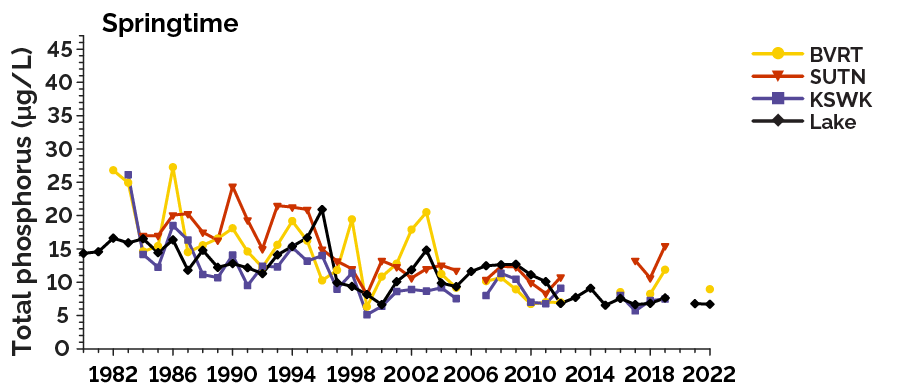
In the lake, average phosphorus concentration during the ice-free period has declined significantly since the 1980s at all 8 MECP lake stations (Figure 20). Phosphorus has been consistently low over the last decade, ranging from around 8.5 µg/L at deepwater stations to 15 µg/L at station C1, the shallowest nearshore station that also receives inputs from the Holland River. Mean annual total phosphorus concentrations were similar at the LSRCA’s nearshore sites that were measured since 2015. Total phosphorus concentrations during the spring in the lake and at the 3 water treatment plants intake stations have also significantly declined (Figure 21).
Other nutrients and water quality trends
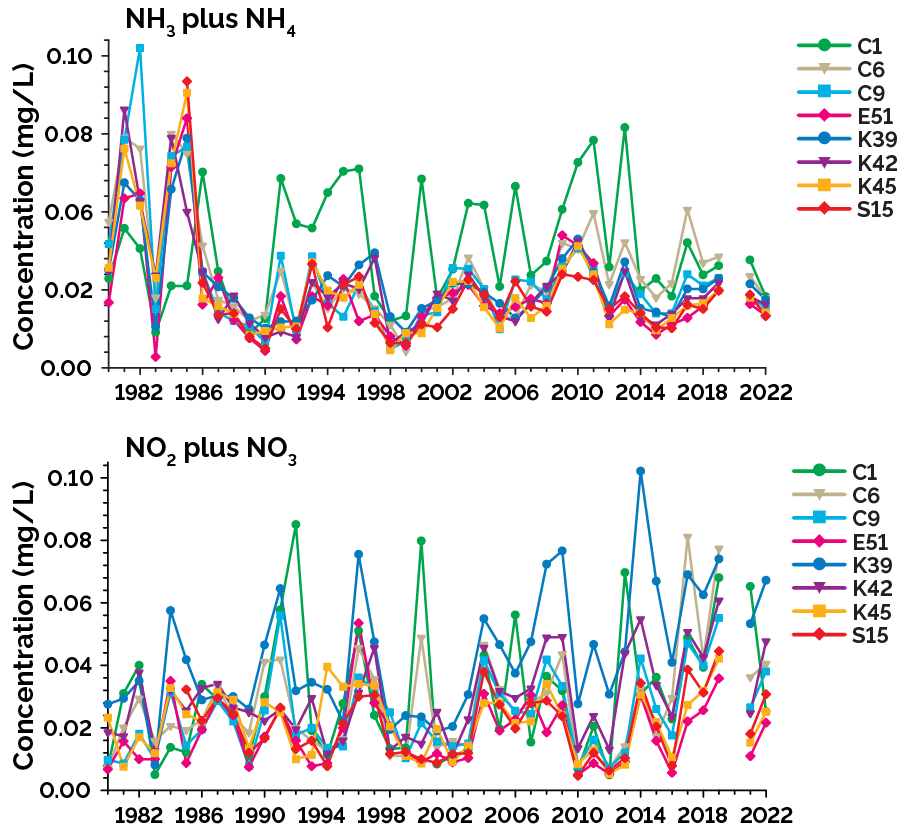
Nitrogen
Another nutrient required by plants and phytoplankton is nitrogen, which is available in many forms in lakes. There was no change in total nitrogen (not shown) or total ammonia (ammonia plus ammonium) (top of Figure 22) in Lake Simcoe over the reported period. The only detected long-term change in nitrogen was an increase in the concentration of nitrate plus nitrite at station K39 (bottom of Figure 22).
Nitrates are present in water from the decay of plant or animal material, the use of agricultural fertilizers, domestic sewage or treated wastewater contamination. The highest concentration of nitrate plus nitrite at K39 was measured in 2014 at 0.1 mg/L, which was still far below the Canadian water quality guideline for nitrate in water of 2.9 mg/L.
Silica
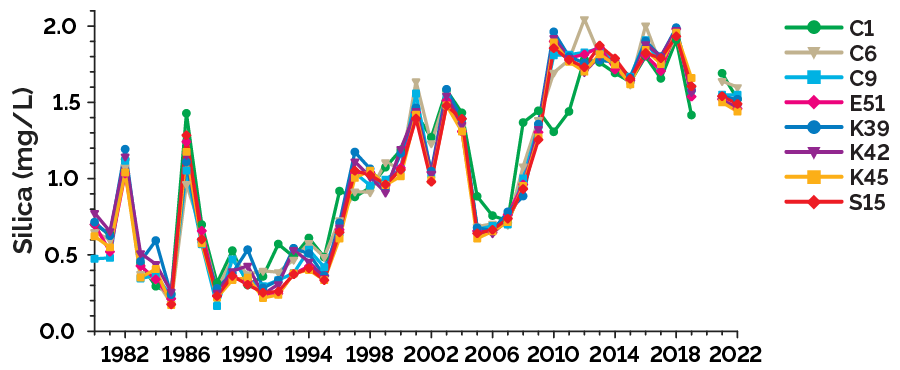
Silica, which enters lakes from the weathering of rocks, is an essential nutrient for diatoms, an important group of phytoplankton in Lake Simcoe. Silica has increased significantly overall in Lake Simcoe since 1980 (Figure 23). Silica increased after 1995, coinciding with the establishment of the zebra mussel, dropped abruptly from 2005 to 2008 and was at its highest levels (average of 1.8 mg/L) from 2010 to 2018. Increases in silica have coincided with decreases in diatom phytoplankton.
Base cations
Other components of freshwater are base cations. Concentrations of sodium, potassium and magnesium have continued to increase in Lake Simcoe, as observed in the 5-year monitoring report. Concentrations in the lake of these cations are not shown here but are available on Ontario’s Data Catalogue. Deposition from the atmosphere of calcium, sodium and magnesium has declined (see research highlight).
Changes in chemical deposition from the air
The MECP and partners recently published 1995 to 2021 atmospheric deposition data that included a bulk collector in the south of the Lake Simcoe watershed (Yao et al. 2025). The analysis showed some significant changes over time in the amount of chemical deposition from the atmosphere.
Deposition of potassium increased significantly, possibly due to changes in agricultural practices in the watershed (Weiss et al. 2013). On the other hand, the deposition of sodium, magnesium and calcium all significantly declined. There were also significant declines detected in the deposition of chloride and total nitrogen, but no significant change in total phosphorus or ammonia/ammonium. Significant declines in deposition were detected in nitrate and sulphate, which were consistent with declines in nitrogen dioxide/nitrogen oxides (NO2/NOx) and sulphur dioxide (SO2) measured in the air (Air Quality in Ontario Report) and thus may be attributed to emission control initiatives in Ontario.
Calcium, alkalinity and dissolved inorganic carbon
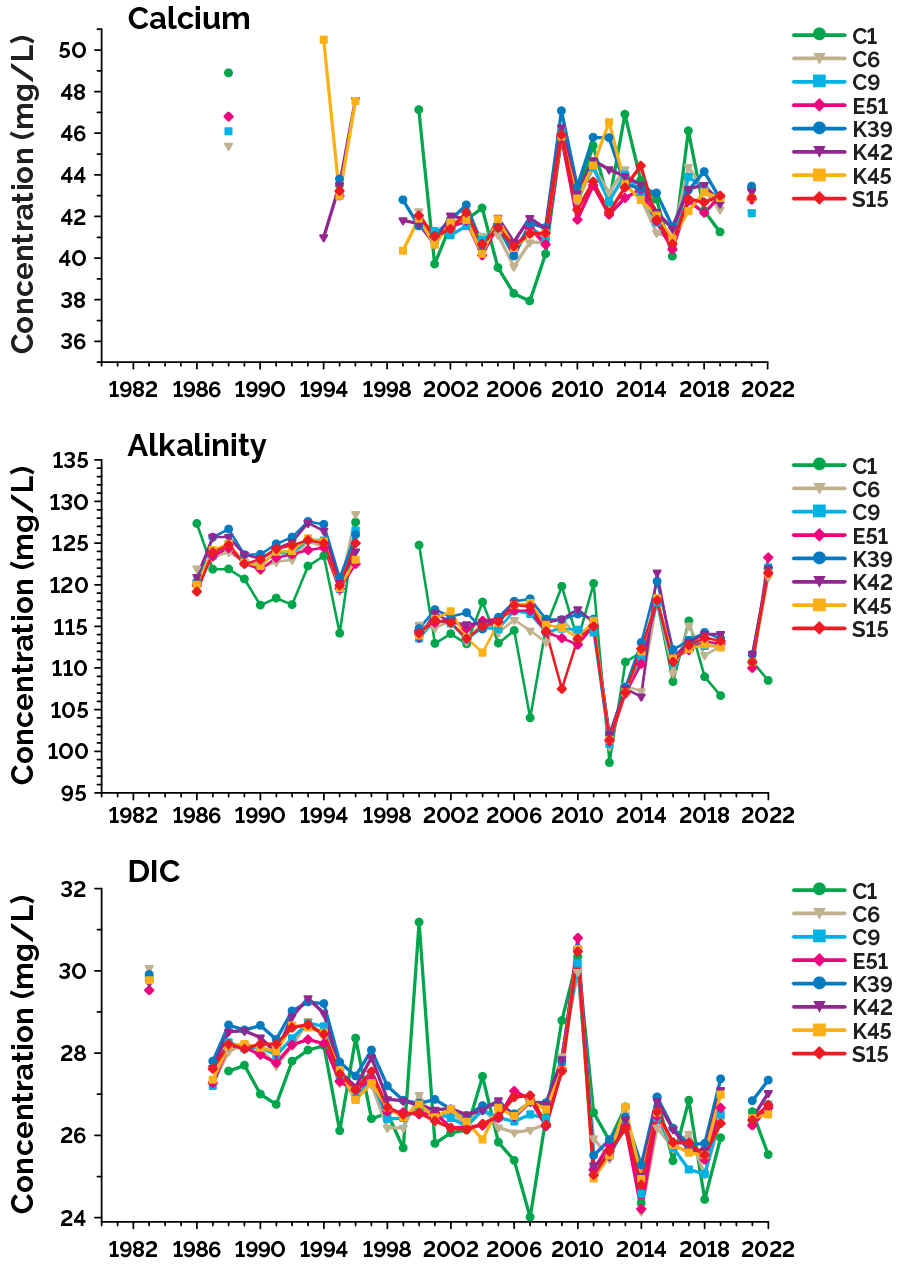
Another base cation, calcium, has been monitored regularly in Lake Simcoe since 2000. There were no significant changes in calcium concentration detected at any of the lake stations from 2000 to 2022 (top of Figure 24). Alkalinity and dissolved inorganic carbon (DIC) have been measured since the 1980s, and both have declined significantly overall at all lake stations (middle and bottom of Figure 24, respectively). Concentrations of calcium, alkalinity and DIC have been relatively stable over the past decade.
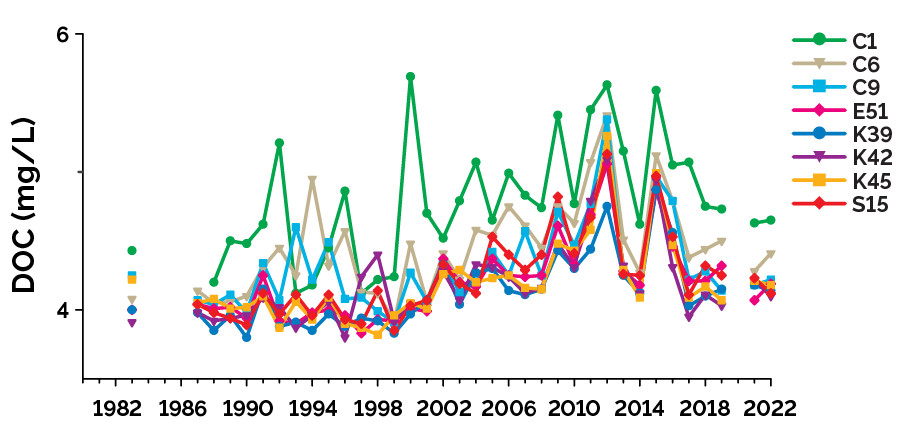
Dissolved organic carbon
Dissolved organic carbon (DOC) is a measure of decomposed organic compounds, which are less than 0.4 µm, that have entered the lake from the watershed or originate from within the lake itself.
DOC in Lake Simcoe has increased overall since 1980 (Figure 25), possibly from decomposition within the lake of the abundant aquatic plants along the shoreline. However, there has been a noticeable decline in DOC since around 2012 and particularly since 2018.
It is possible that the decline in DOC is connected to the establishment of an invasive macroalga, the starry stonewort, which now dominates the Lake Simcoe shoreline but possibly does not decompose as readily as did the previously abundant macrophytes. This is currently under investigation by the LSRCA through support by the province.
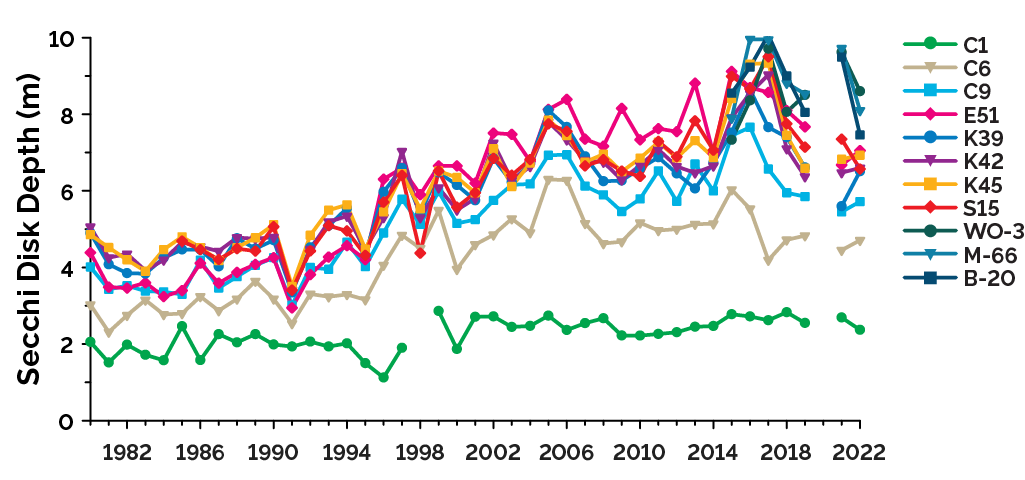
Water clarity
Water clarity is measured with a Secchi Disk that is lowered into the lake, and a depth is recorded where this disk is no longer visible. Water clarity has continued to increase significantly in Lake Simcoe at all stations since 1980 (Figure 26). In recent years, water clarity has appeared to stabilize or even decline.
Water clarity can be reduced by particles such as phytoplankton or DOC in the lake. The driver behind the recent decline in water clarity is unknown, given that both DOC and chlorophyll-a (an indicator for phytoplankton) have also declined.
Using statistical indicators as a tool to predict impending change
A collaborative study between researchers from Trent University and the MECP using the ministry’s 4 decades of long-term water-quality monitoring data from 3 lake stations was published in 2022 (Rohde et al. 2022). The study looked for significant physical or chemical changes to the lake from 1980 to 2019, and whether statistical indicators could be used retrospectively to predict impending changes to the lake. Statistical indicators successfully detected changes in total phosphorus, chlorophyll-a (an indicator of the amount of phytoplankton present) and water clarity at 2 lake stations. Overall reductions in phosphorus and chlorophyll-a and increases in water clarity suggest that water quality in the lake has improved, and these changes coincided with both substantial management actions and species invasions. The study concluded that these statistical indicators may be a useful tool for tracking the adaptive management and long-term monitoring of lake ecosystems but calls for the need for more research in this area.
Aquatic pollutants
Besides excessive nutrients, there are other pollutants that can negatively affect the aquatic biota of Lake Simcoe, as well as sometimes humans. These can include:
- total suspended solids
- chloride
- microplastics
- pharmaceuticals and personal care products
- metals
- organic contaminants
- pathogens
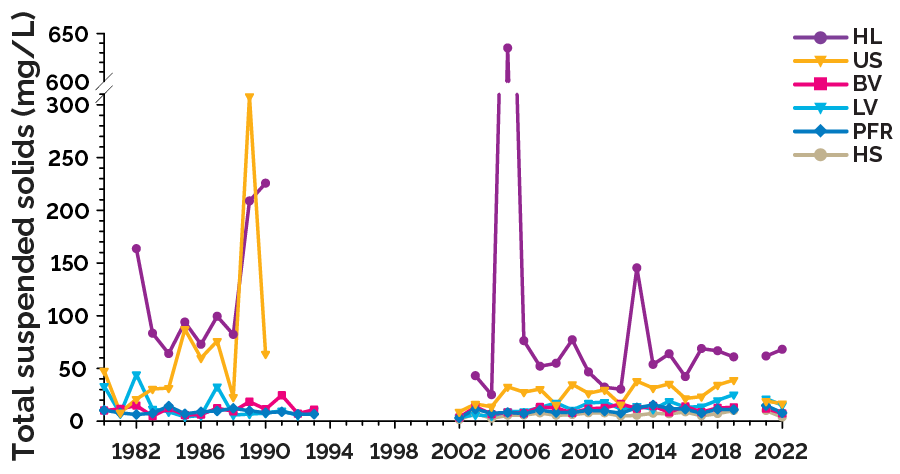
Total Suspended Solids
Total suspended solids (TSS) can sometimes be a physical contaminant of lakes and streams because suspended particles cloud the water, and thus decrease nearshore water clarity and impair habitat for spawning of some fish species. Of the tributaries presented here (Figure 27), TSS increased significantly in Lovers Creek and remained unchanged in the other 5. Additionally, the LSRCA reported that TSS increased in:
- Hotchkiss Creek
- Uxbridge Brook
- Black, Maskinonge and North Schomberg Rivers
TSS increases may be due to increases in extreme rain events that cause greater erosion and transport of TSS into the tributaries and lake (LSRCA 2024).
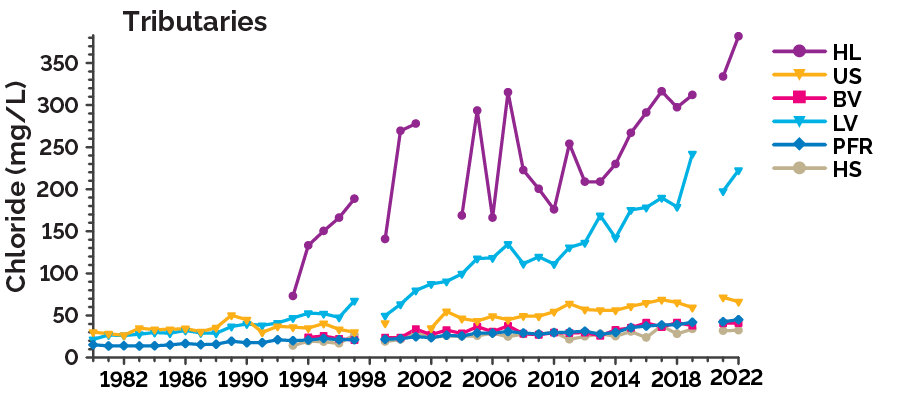
Chloride
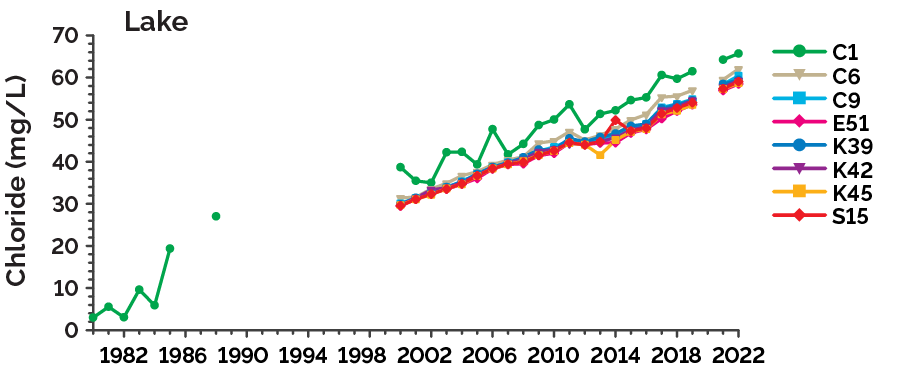
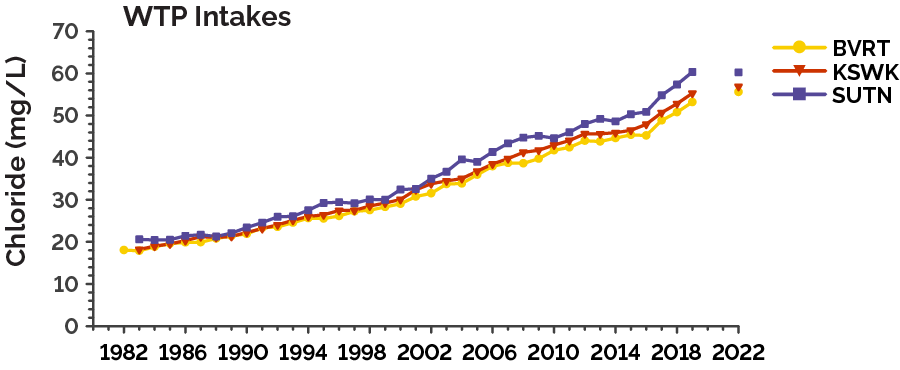
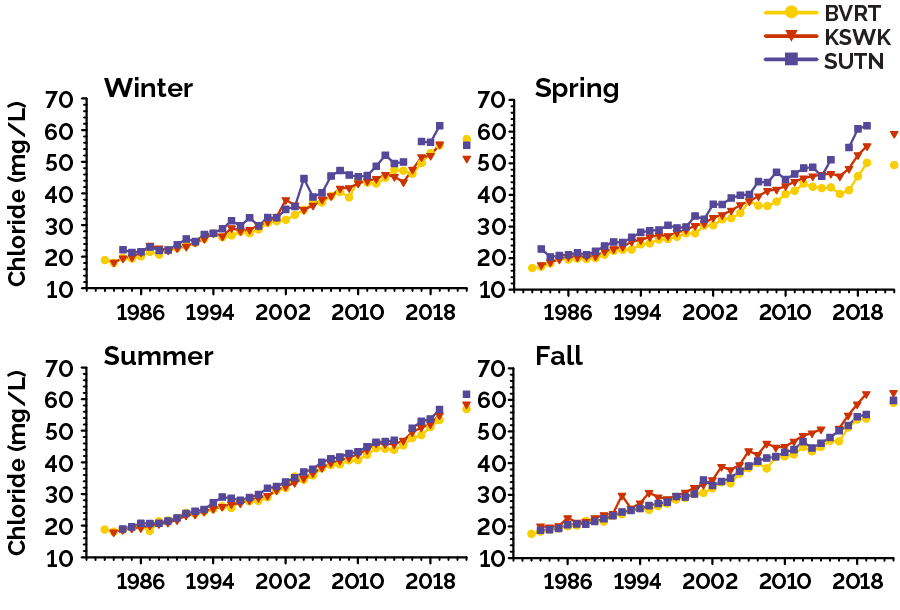
Chloride is a contaminant of concern in Ontario waterbodies that are close to roadways or urban centers (Sorichetti et al. 2022). Concentrations of chloride in Lake Simcoe have increased significantly at all monitored tributaries (Figure 28), and in the lake at 8 stations (Figure 29) and 3 WTP intakes (Figure 30) and across all seasons (Figure 31).
If the rate of recent increase in Lake Simcoe continues, chloride in the lake will reach the Canadian chronic guideline level of 120 mg/L by around 2060. Chloride at that concentration could affect sensitive biota in the lake. The LSRCA’s (2024) online report showed that chloride levels in some tributaries (for example, Bunkers and Kidds Creeks) are already above the chronic guideline, which is the level intended to protect aquatic species for indefinite exposure periods. In fact, chloride levels in these streams can at times exceed the acute guideline of 640 mg/L, which is the level when species could potentially be severely affected from short-term exposure. Biota in these streams are experiencing a constant high level of chloride. Preliminary analyses have shown that elevated concentrations of chloride have the greatest negative effect on fish and benthic invertebrate biomass in tributaries (LSRCA 2024).
Microplastics
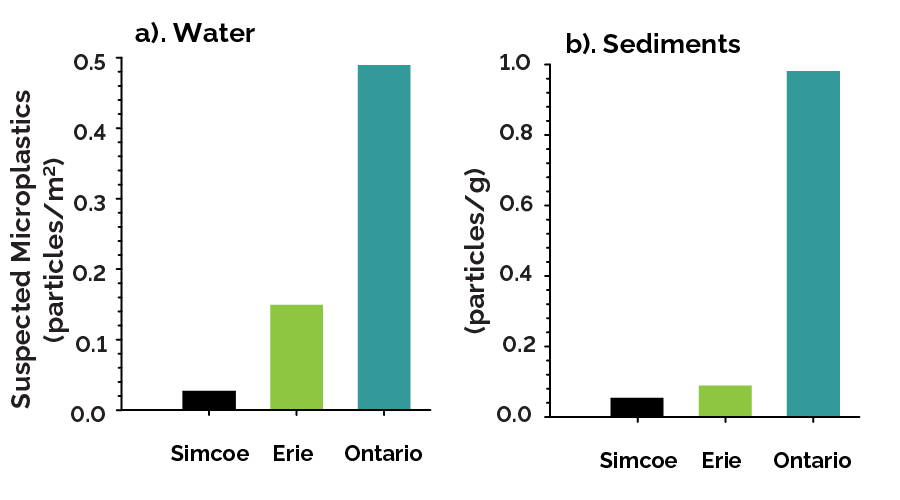
Microplastics are small particles of plastic ranging from as small as 1 µm up to 5 mm that are found in Ontario’s lakes and streams. Working together, the MECP and the University of Toronto measured the amounts and types of microplastics present along the surface of Lake Simcoe, in the sediments at the bottom of the lake, as well as in commonly caught fish (see Research Highlight).
Particles suspected to be microplastics were found in each of the water and lake-bottom sediment samples collected from 8 sites across Lake Simcoe in 2018 and 2019 (Felismino et al. 2021). Water samples were found to have from 0.003 to 0.102 suspected particles/m2, which is less than 1 particle on the area of a desktop. The amounts found in Lake Simcoe waters were less than those measured in Lake Erie and Lake Ontario waters (Figure 32a). Concentrations of suspected microplastic particles in lake sediments ranged from 0.008 to 0.107 particles/g for a size range from 125 µm to 5 mm. This was similar to amounts found in Lake Erie and less than those found in Lake Ontario nearshore lake-bottom sediments (Figure 32b) (Ballent et al. 2016, Dean et al. 2018).
On average, fragments of polyethylene and polypropylene, likely from litter-based sources, were the dominant particle in water surface samples (75%), while foam particles, for example from insulation, food containers and dock foam, were less than 10%. Fibers, such as those from clothing and textiles, were the most dominant particle type in lake sediments. As there are several sources of microplastic and plastic pollution, a range of initiatives will be required to reduce the amounts of microplastics entering Lake Simcoe.
Understanding microplastics in food webs
MECP scientists in partnership with researchers from the University of Toronto conducted a study to examine microplastic levels in fish from Lake Simcoe (McIlwraith et al. 2021). Microplastics were found in the stomachs of fish and also in their muscles (fillets) and livers, demonstrating that microplastics can migrate from the digestive system to other parts of their bodies.
The amounts and types of microplastics found varied depending on the fish species and their environment. These findings suggest that microplastics can move within the food chain when these fish are consumed by other animals, including humans. However, the study also showed that microplastics do not accumulate to higher amounts in older/larger fish like many other contaminants do. Further work is needed to understand how microplastics may impact ecosystem and human health.
Pharmaceuticals and personal care products
Pharmaceuticals and personal care products, such as prescription and over-the-counter medicines, chemicals used in cosmetics, disinfectant additives in soaps and detergents, and other consumer-use compounds like insect repellants, sunscreens, caffeine and artificial sweeteners can make their way into Ontario waters.
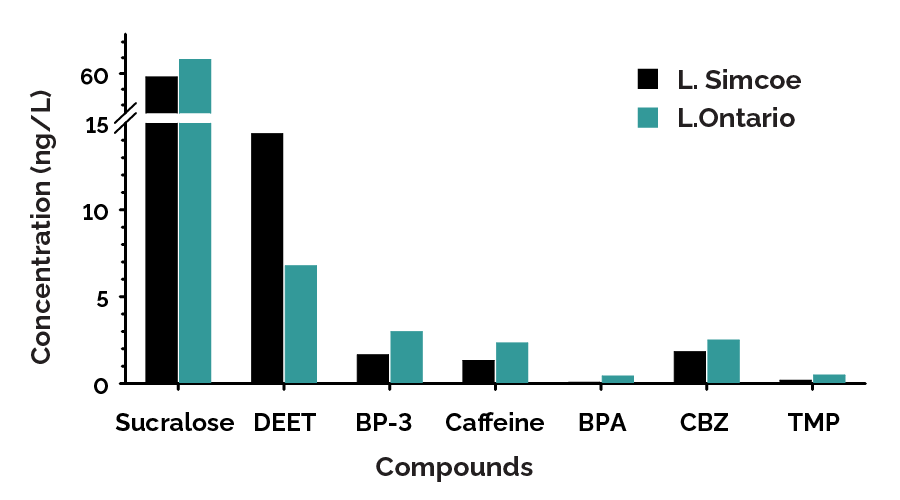
Concentrations of these emerging contaminants were sampled at Lake Simcoe sites and in the Holland River in 2018 using devices called passive samplers that are left in the water to take up chemicals that are present over time. Of the 54 compounds analyzed, approximately half were not found or only rarely detected, and most of the compounds detected were at low concentrations (less than 1 ng/L or “nanogram per litre”).
The sweetener sucralose and the insect repellant DEET were detected at the highest concentrations, followed by the anti-epileptic drug carbamazepine and caffeine (Figure 33). The average concentrations in Lake Simcoe, which were similar across the lake, were similar to or lower than those measured in Lake Ontario.
Concentrations within the Holland River were higher than in the lake, likely reflecting upstream inputs and greater dilution in the lake than in the river. Average concentrations of detected compounds were 10 to 100,000 times below existing environmental guidelines or toxicity thresholds to protect the health of aquatic organisms.
Per- and Polyfluorinated Alkyl Substances (PFAS)
Per- and polyfluorinated alkyl substances (PFAS) have been a contaminant class of concern since the early 2000s. They are a broad suite of organic chemicals containing very strong carbon-fluorine bonds that make them long-lasting in the environment. They are used widely in polymers and coatings and have been used in firefighting foams.
Their broad use has resulted in the presence of many PFAS at low concentrations in the environment, such as sediment, water, organisms and humans, with higher levels of contamination near manufacturing facilities and locations where firefighting foams have been frequently used (for example, airports and military installations). PFOS (perfluorooctane sulfonate) and PFOA (perfluorooctanoic acid) have been among the PFAS receiving the most attention.
In Canada, regulations prohibiting manufacture, import, sale and use of PFOS were introduced in 2008 and in 2016 similar regulations were introduced for PFOA and long-chain perfluorocarboxylic acids. Following restrictions on these compounds, concentrations of PFOS and PFOA were found to have declined in Ontario surface and drinking waters, and in the Great Lakes (Gewurtz et al. 2019, Kleywegt et al. 2020).
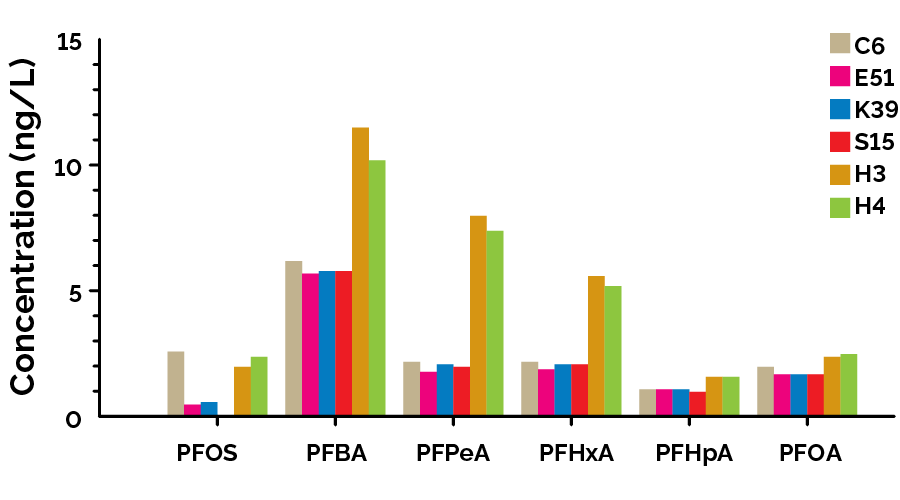
PFAS samples were collected at 4 stations in Lake Simcoe (C6, E51, K39 and S15) and 2 Holland River stations (H3 and H4), once each in the spring, summer and fall of 2023, and analyzed for 16 PFAS compounds at the MECP laboratory. PFOS was detected in 42% of samples, while PFOA and 4 shorter-chained PFAS compounds were each detected more frequently (>90% of samples). The 4 short-chained PFAS were PFBA (perfluorobutanoic acid), PFPeA (perfluoropentanoic acid), PFHxA (perfluorohexanoic acid) and PFHpA (perfluoroheptanoic acid).
Concentrations of each of the detected PFAS compounds were low (0.5 to 6 ng/L) and were consistent across the lake, while concentrations were higher in the Holland River (Figure 34). In general, concentrations of the longer chained PFOS and PFOA were similar to or less than the shorter-chained compounds, reflecting changes in usage following regulations of PFOS and PFOA. The short-chained PFBA was the compound with the highest concentrations in both the lake and Holland River.
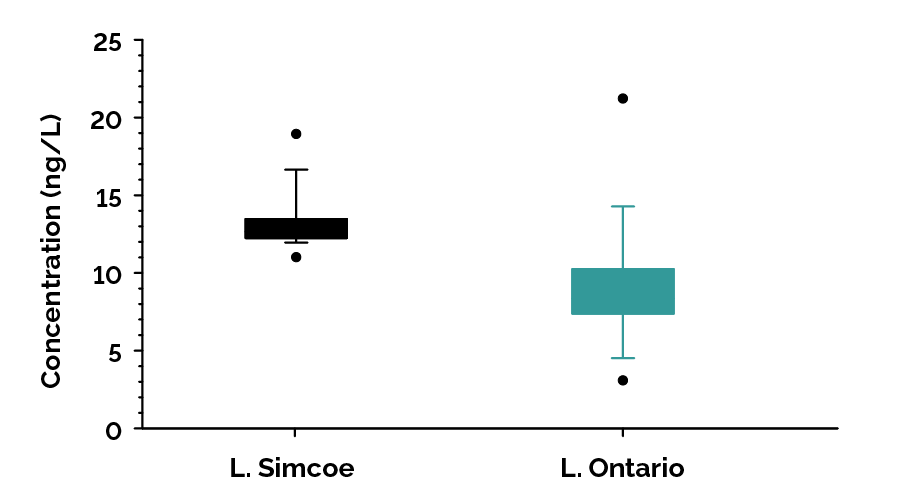
The concentrations of PFOS and PFOA in Lake Simcoe waters measured in 2023 have decreased compared to concentrations in samples collected in 2008. Lake-wide average concentrations of PFOS and PFOA were 0.92 and 3.2 ng/L, respectively, in 2008 (Helm et al. 2011), while in 2023, average concentrations were 0.68 and 1.8 ng/L. The concentrations in Lake Simcoe were similar but slightly higher than concentrations in Lake Ontario in 2023 (Figure 35) for the sum of the 16 PFAS compounds measured.
As both lakes are sources of drinking water to surrounding communities, the observed concentrations can be compared to Health Canada’s Drinking Water Objective of 30 ng/L for the sum of 25 PFAS compounds (Health Canada 2024). Lake Simcoe water sample concentrations were all below this objective value for the sum of 16 PFAS compounds tested.
The MECP has updated its laboratory analysis method for PFAS to include the detection of all 25 compounds listed under Health Canada’s objective, and monitoring in Lake Simcoe is underway to ensure concentrations are below this objective. Periodic monitoring at least every few years is recommended to ensure PFAS concentrations do not increase.
Continued research and monitoring of contaminants
Additional research and monitoring studies are undertaken periodically to evaluate levels of other pollutants within Lake Simcoe water and/or bottom sediment. Examples include a sediment survey that was conducted in 2008 that analyzed metals and organic contaminants trends across the lake and historical concentrations using a dated sediment core (Young et al. 2010).
In summer 2024, a follow up study to the 2018 work using passive samplers was conducted for the occurrence of pharmaceuticals and personal care products and current-use pesticides. In fall 2023 and spring 2024, the LSRCA performed a contaminant study [PDF] in Lake Simcoe tributaries and some lake sites with support from the province.
Taken together, the results from such studies will provide an overall assessment of the status and trends of contaminants in Lake Simcoe to detect any changes, and to help ensure the health of the system is maintained.
Fish contaminant monitoring in Lake Simcoe
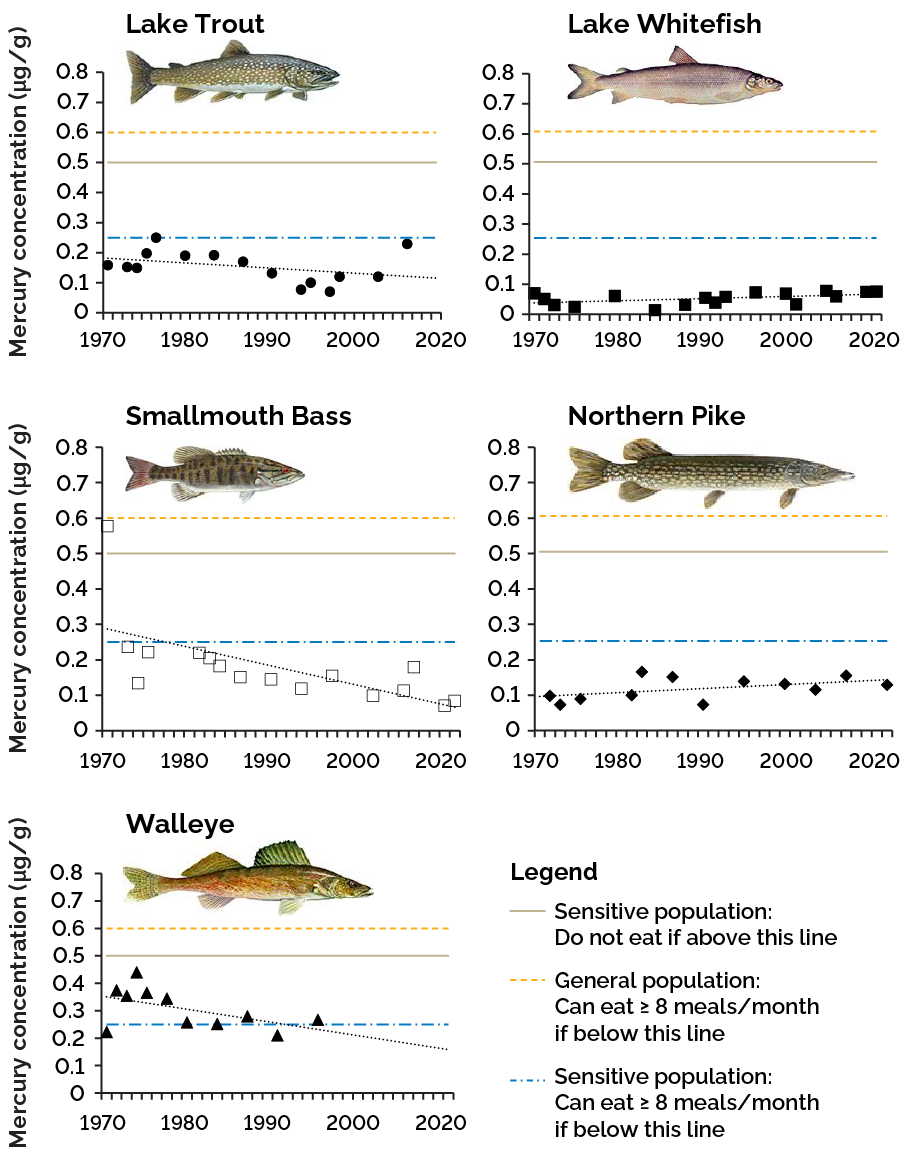
The MECP has been monitoring contaminant levels in Lake Simcoe fish since the 1970s, and fish consumption advisories are published in the Guide to Eating Ontario Fish. Analysis of mercury concentrations over time shows that levels have been decreasing in lake trout, smallmouth bass and walleye, while mercury levels in northern pike and lake whitefish have been either stable or slightly increasing over time (Figure 36).
Overall, the current mercury concentrations in Lake Simcoe fish species such as lake trout, smallmouth bass, lake whitefish and northern pike are generally below consumption guidelines for the general population. However, larger sizes of predatory fish like walleye may contain mercury levels that make them suitable only for occasional consumption (less than 8 meals a month), especially for the sensitive group of people who are, or may become pregnant, and children.
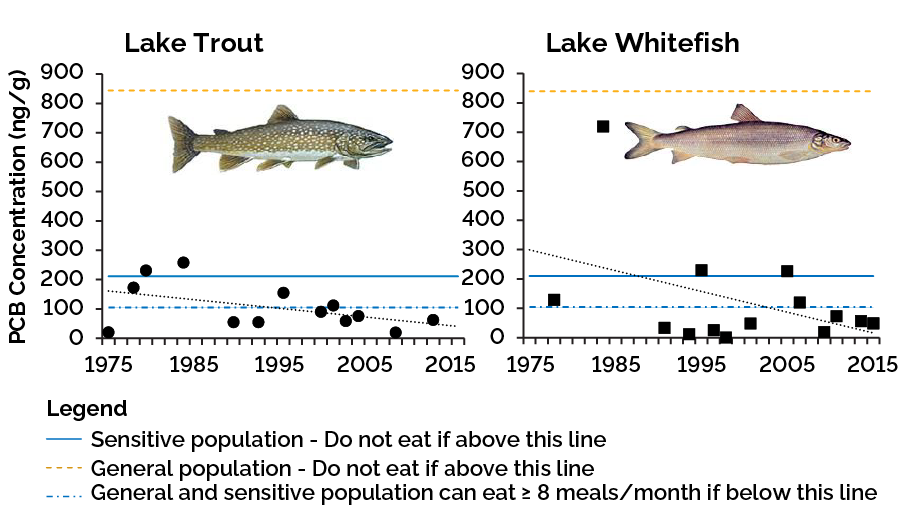
MECP has also monitored Polychlorinated Biphenyls (PCBs) levels in Lake Simcoe fish. Concentrations of PCBs have declined, particularly for lake trout and lake whitefish with concentrations below the fish consumption guidelines since 2010 (Figure 37).
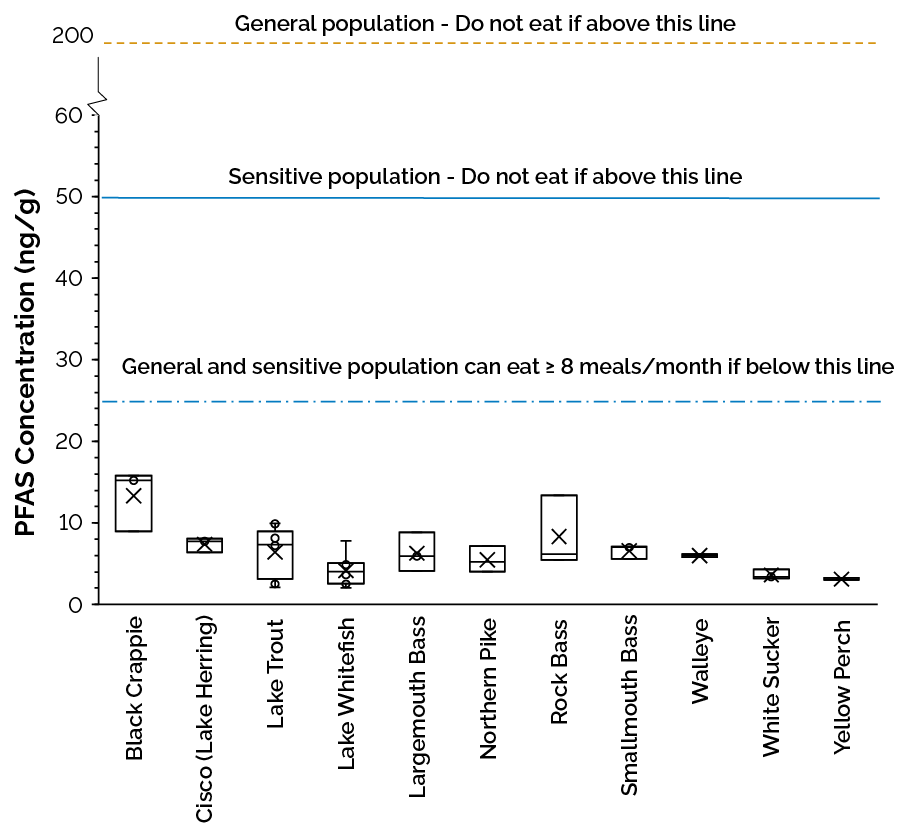
The persistence of PFAS in the environment and their potential to accumulate in living organisms has raised concerns. The current total concentrations of 16 PFAS compounds in a variety of fish monitored from Lake Simcoe are generally low and resulted in minor restrictions of 12 to 16 meals per month for certain fish types or sizes (Figure 38). Continued monitoring of mercury, PCBs and PFAS levels in Lake Simcoe fish is important to assess potential risks to human health and the ecosystem.
Pathogens
Along the vast shoreline of Lake Simcoe (around 300 km), there are many public beaches that are a popular swimming destination during the summer to both locals and visitors. These beaches fall under the jurisdiction of 3 Public Health Units:
- Simcoe-Muskoka District with 17 beaches along the western shores (includes all beaches around Kempenfelt Bay) and northern side of the main basin (includes the Ramara watershed)
- Durham Region with 3 beaches on the eastern side of the main basin
- York Region with 13 beaches along the southern side of the main basin and eastern side of Cook’s Bay
A swimming advisory is posted at a public beach when bacteria levels increase above set guidelines. Since 2018, all 3 health units have used the same Ontario health operational guideline [PDF]. Beaches are “posted” with a swimming advisory when the geometric mean of Escherichia coli across a minimum of 5 samples exceeds 200 colony forming units per 100 mL. Beaches may also be deemed unsafe due to other factors such as blue-green algal blooms or excessive weed growth, visual debris, spill of sewage or other waste, wildlife die-off or turbidity.
In addition to water sampling, health units record observations on environmental factors (for example, water clarity, recent rainfall and wind direction) and beach use indicators (for example, number of bathers or waterfowl). The frequency of water testing and re-testing at beaches can vary among and sometimes within health units. This limits comparisons among health units and over time.
Simcoe-Muskoka beaches
From 2013 to 2022, there appeared to be an overall increasing trend of the number of beach postings at all Simcoe beaches with a peak in 2021 (Table 5). At all Simcoe beaches combined, significant associations were observed between the percent of E. coli exceedances and 5 environmental factors:
- wave strength
- recent rainfall
- cloud cover
- wind direction
- water clarity
Many of these factors were likely inter-related (for example, wave strength would affect water clarity by stirring up the lake bottom into the water). There was no significant association found between high E. coli counts and beach use indicators:
- presence or density of waterfowl, bathers or dogs
- presence of algae or snails
Associations were tested with a Pearson’s chi-squared at a significance level of p<0.05.
| Year | No. of Beach Postings |
|---|---|
| 2013 | 9 |
| 2014 | 14 |
| 2015 | 17 |
| 2016 | 10 |
| 2017 | 13 |
| 2018 | 23 |
| 2019 | 21 |
| 2020 | 26 |
| 2021 | 37 |
| 2022 | 27 |
Durham beaches
There was no significant association found between year and percentage of days posted for any of the 3 Durham beaches. From 2018 to 2022, Beaverton Beach South was posted more than half of the time, whereas Beaverton Beach North and Thorah Centennial beach were posted less than a quarter of the time (Table 6).
Increased odds of either Beaverton Beach North or Thorah Centennial beach being posted were significantly associated with 2 environmental factors:
- any rain in the 48 hours prior to sampling
- water turbidity
No associations were found for Beaverton Beach South, or with other possible factors at the other 2 beaches such as:
- air and water temperature
- rainfall and sun intensity
- wind direction or wave action
- water clarity
- bather density
- presence of geese, seagulls or other waterfowl
- presence of potential blue-green algae.
Analyses for each of the Durham beaches were performed using univariate and multivariate logistic regression models.
| Year | Beaverton North (%) | Beaverton South (%) | Thorah Centennial (%) |
|---|---|---|---|
| 2018 | 62 | 38 | 23 |
| 2019 | 23 | 62 | 17 |
| 2020 | 11 | 56 | 11 |
| 2021 | 23 | 54 | 31 |
| 2022 | 31 | 62 | 23 |
York beaches
During the period from 2018 to 2022, the proportion of sampling days that resulted in a beach being posted varied between 2 to 17% across all York beaches on Lake Simcoe (Table 7). Across all beaches during the 5-year period, a significant association was only observed between posting status (yes or no) and water temperature.
Significance was not found with any of the other variables:
- air temperature
- current rainfall or humidity
- UV or cloud cover
- wind direction, average wind speed or wave height
- turbidity
- whether or not freshly raked
- number of bathers or waterfowl
- number of shore feces
- presence of algae
Beach data were evaluated using univariate and multivariate logistic regression analyses and should be interpreted with caution as individual beaches may have different factors that affect posting status, and the number of sampling days between 2018 and 2022 was variable.
| Year | % of Days Posted |
|---|---|
| 2018 | 6 |
| 2019 | 2 |
| 2021 | 5 |
| 2022 | 17 |
Overall, in recent years at all Lake Simcoe beaches, beach use (for example, the presence or density of bathers, dogs and waterfowl) was not associated with beach postings while a variety of environmental conditions such as water temperature were.
Footnotes
- footnote[1] Back to paragraph For Table 7, samples were not collected for York Region beaches during the summer of 2020 due to the global COVID-19 pandemic.