January to March, 2021
Introduction
About the Ontario Employment Report
The Ontario Employment Report is released four times a year and provides an assessment of the current trends and developments in the Ontario labour market. The Ontario Employment Report is a companion report to the Ontario Economic Accounts, which provides an overall assessment of the current state of the Ontario economy.
Methodological note
In the current issue, year-over-year change represents change between the averages in the first quarter of 2020 and the first quarter of 2021. Note that the Ontario Economic Accounts report primarily shows changes between the previous and the current quarter.
This report uses seasonally adjusted data in charts displaying data with a monthly frequency in the Overview section.
Unadjusted data is used in charts and tables showing the changes for the current quarter compared with the same quarter for the previous year. Unadjusted data is also used to calculate annual averages, year-to-date averages and 2021 first quarter averages.
All estimates in this report are based on Statistics Canada’s Labour Force Survey (LFS), which measures the current state of the national provincial and territorial labour market. The LFS is based on a household survey carried out monthly by Statistics Canada in reference weeks of the month. The reference periods for the three months of the first quarter of 2021 are January 10 to 16, February 14 to 20 and March 14 to 20.
Impact of on the labour market
Beginning in mid-March 2020, travel restrictions, business closures and physical distancing measures were put in place by various levels of government to help contain the spread of and protect the health of Ontarians. These restrictions and public health measures were in place to varying degrees throughout 2020 and in the first quarter 2021.
In January 2021, Ontario was under a provincewide shutdown and enacted additional public health measures. In February and March 2021, public health unit regions were transitioned back into the Response Framework: Keeping Ontario Safe and Open.
Overview
Ontario’s labour market overview
Employment:
- -140,900 net jobs in Q1 2021, year-over-year
- -14,900 net full-time jobs in Q1 2021, year-over-year
- +182,300 jobs in March 2021
- +106,300 full-time jobs in March 2021
Unemployment rate:
- 9.1% in the first quarter of 2021
- 7.5% in March 2021
Year-over-year, Ontario’s employment, decreased by 1.9% (-140,900) in the first quarter of 2021, while Canada’s employment decreased by 1.3% (-240,200).
In March 2021, Ontario’s employment increased by 2.5% (+182,300), and Canada’s employment also increased by 1.6% (+303,100).
Ontario’s unemployment rate was 9.1% in the first quarter of 2021, higher than the Canadian rate of 8.8%.
In March 2021, Ontario’s unemployment rate decreased by 1.7 percentage points (from 9.2% to 7.5%) and Canada’s unemployment rate decreased by 0.7 percentage points (from 8.2% to 7.5%).
Year-over-year overview
Ontario’s labour market, 2008-2021
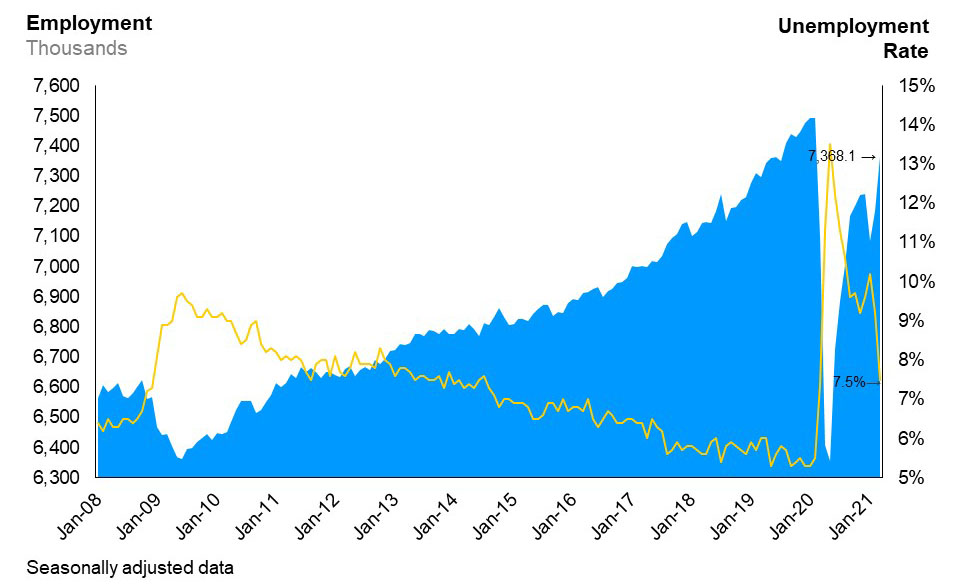
The combination line and area chart shows Ontario’s unemployment rate (line chart) and employment (area chart) from January 2008 to March 2021. Ontario’s unemployment rate has trended downwards since the 2008/09 recession, reaching 5.3% in January 2020, before rising to 13.5% in May 2020, then falling to 7.5% in March 2021. Employment in Ontario has risen steadily since the 2008/09 recession, reaching just under 7.5 million workers in January 2020, before dropping to below 6.4 million workers in May 2020, then rising to well over 7.3 million workers in March 2021.
Between the first quarter of 2020 and 2021:
- employment losses were concentrated in part-time work (-126,000, -9.4%), while full-time employment also declined (-14,900, -0.3%);
- employment declined for those who are self-employed (-6.9%) and in the private sector (-1.9%), while employment in the public sector increased (+2.0%);
- employment decreased in services-producing industries (-2.5%), with the accommodation and food services sector experiencing the largest decline in employment (-22.8%), while employment in the goods-producing industries slightly increased (+0.4%);
- the Greater Toronto Area (GTA) experienced the greatest decline in employment (-3.1%), followed by Central Ontario (-1.9%) and Northern Ontario (-3.4%), while employment slightly increased in Eastern Ontario (+0.8%) and Southwestern Ontario (+0.5%);
- youth experienced the largest decline in employment (-8.6%) compared to other age groups.
Type of Work quarterly details
Employment change by work status
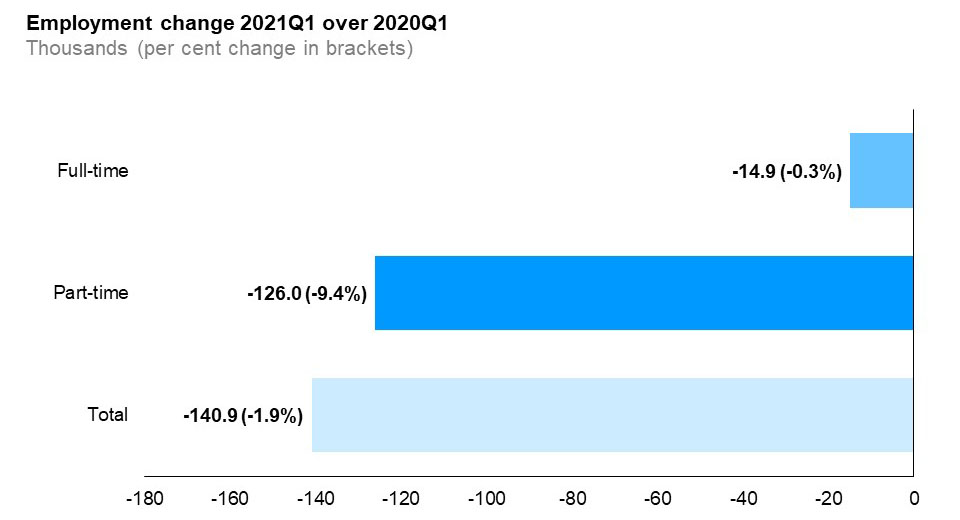
The horizontal bar chart shows a year-over-year (between the first quarters of 2020 and 2021) change in Ontario’s employment by full-time and part-time status. Total employment decreased by 1.9%, with full-time employment decreasing by 0.3%, and part-time employment decreasing by 9.4%.
Year-over-year, full-time employment decreased by 0.3% and part-time employment decreased by 9.4% in the first quarter of 2021.
Part-time workers have been disproportionally impacted by the pandemic as they are more likely to work in industries that experienced the largest decline in employment, including accommodation and food services and retail trade.
Employment change by employment sector
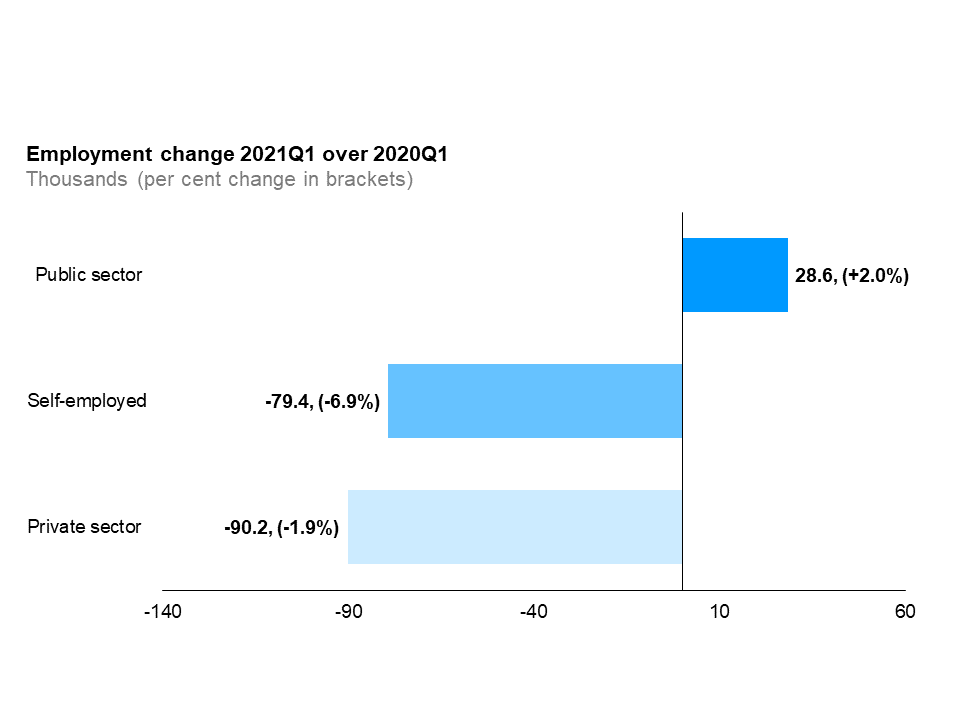
The horizontal bar chart shows a year-over-year (between the first quarters of 2020 and 2021) change in Ontario’s employment for the private sector, public sector and self-employment. Employment decreased in the private sector (-1.9%) and for the self-employed (-6.9%), and increased for the public sector (+2.0%).
Year-over-year, private sector employment decreased by 1.9%, self-employment decreased by 6.9% and public sector employment increased by 2.0%.
Employment above-average wage and below-average wage industries
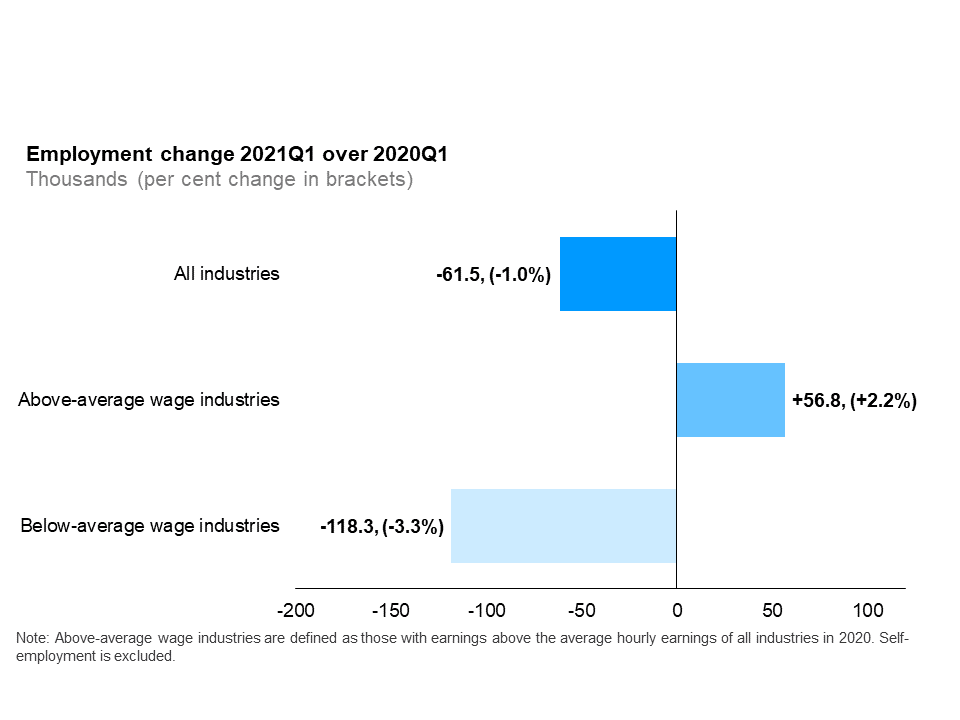
The horizontal bar chart shows a year-over-year (between the first quarters of 2020 and 2021) change in Ontario’s employment for above- and below-average wage industries, compared to the paid employment in all industries. Employment increased in above-average wage industries by 2.2% and decreased in below-average wage industries by 3.3%. Paid employment in all industries (excluding self-employment) decreased by 1.0%. Above-average wage industries are defined as those with wage rates above the average hourly wages of all industries in 2020.
Year-over-year, paid employment increased in above-average wage industries by 2.2%, while employment in below-average wage industries decreased by 3.3%.
Sector and occupation quarterly details
Employment change by industry, goods-producing industries
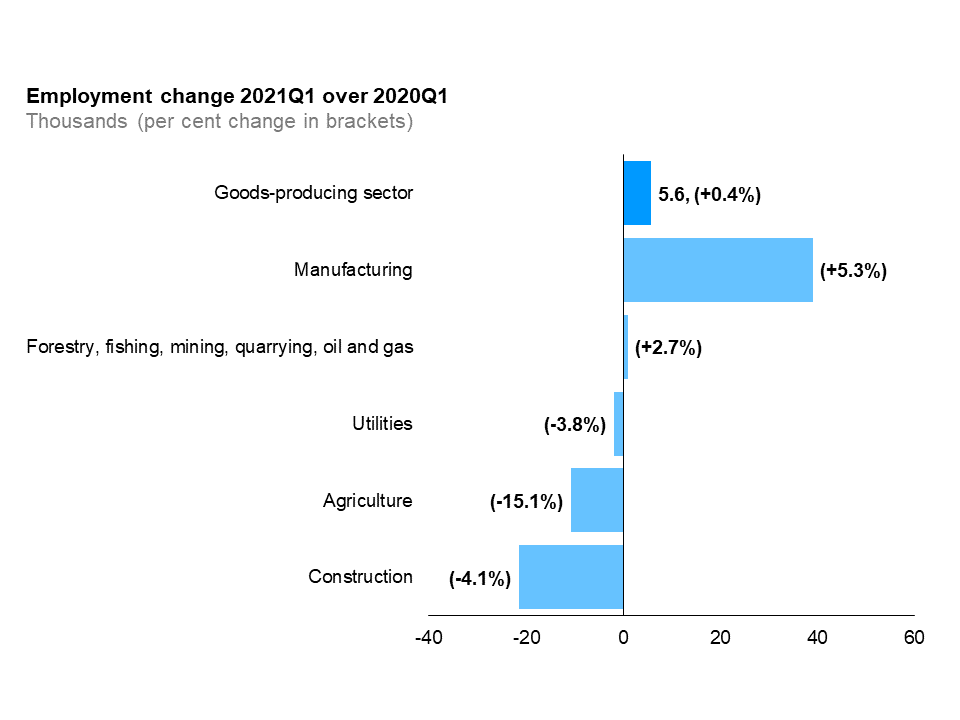
The horizontal bar chart shows a year-over-year (between the first quarters of 2020 and 2021) change in Ontario’s employment by industry for goods-producing industries, measured in thousands with percentage changes in brackets. Employment increased in two goods-producing industries: manufacturing (+39,000, +5.3%) and forestry, fishing, mining, quarrying, oil and gas (+900, +2.7%). Construction had the largest decline in employment (-21,500, -4.1%) followed by agriculture (-10,800, -15.1%) and utilities (-2,000, -3.8%). The overall employment in goods-producing industries increased by 5,600 (+0.4%).
Employment in the goods-producing industries increased slightly in the first quarter of 2021, compared to the same period in 2020. The overall gain was driven by increases in manufacturing (+5.3%) and forestry, fishing, mining, quarrying, oil and gas (+2.7%). Employment declined in utilities (-3.8%), agriculture (-15.1%) and construction (-4.1%).
Employment change by industry, services-producing industries
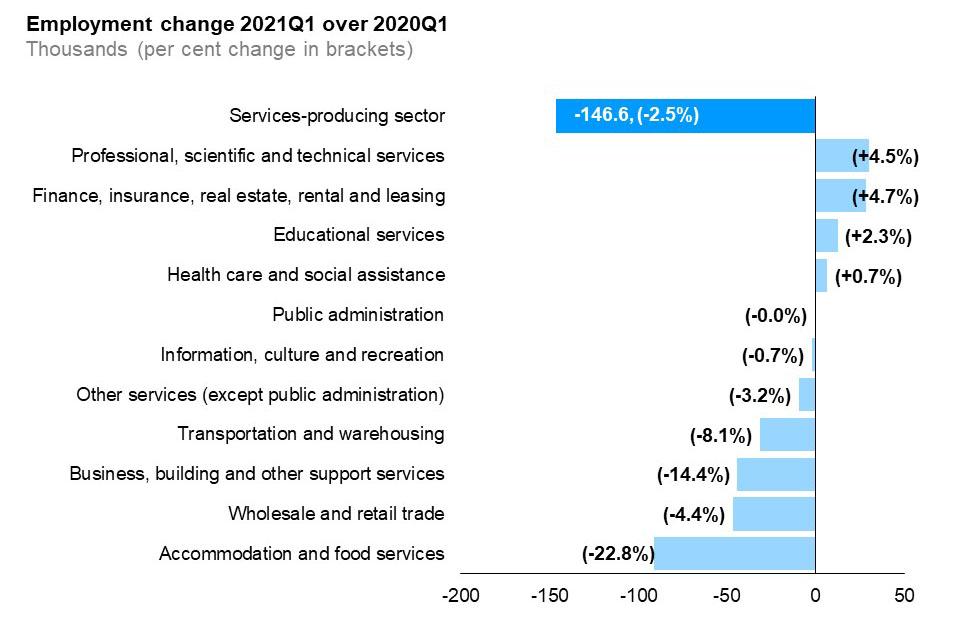
The horizontal bar chart shows a year-over-year (between the first quarters of 2020 and 2021) change in Ontario’s employment by industry for services-producing industries, measured in thousands with percentage changes in brackets. The majority of the services-producing industries experienced decline in employment. Accommodation and food services (-90,800, -22.8%) experienced the largest employment decline followed by wholesale and retail trade (-46,300, -4.4%), business, building and other support services (-44,300, -14.4%) and transportation and warehousing (-31,400, -8.1%). Among services-producing industries that saw an increase in employment, professional, scientific and technical services experienced the largest increase (+29,900, +4.5%) followed by finance, insurance, real estate, rental and leasing (+28,400, +4.7%), educational services (+12,600, +2.3%) and health care and social assistance (+6,600, +0.7%) The overall employment in services-producing industries decreased by 146,600 (-2.5%).
Employment in the majority of services-producing industries declined in the first quarter of 2021 compared to the same period in 2020. Among services-producing industries, accommodation and food services (-22.8%) experienced the largest employment losses followed by wholesale and retail trade (-4.4%), business, building and other support services (-14.4%) and transportation and warehousing (-8.1%).
Professional, scientific and technical services experienced the largest increase in employment (+4.5%), while finance, insurance, real estate, rental and leasing experienced the highest rate of employment growth (+4.7%). Educational services (+2.3%) and health care and social assistance (+0.7%) were also among services-producing industries that saw an increase in employment.
Employment change by occupational group
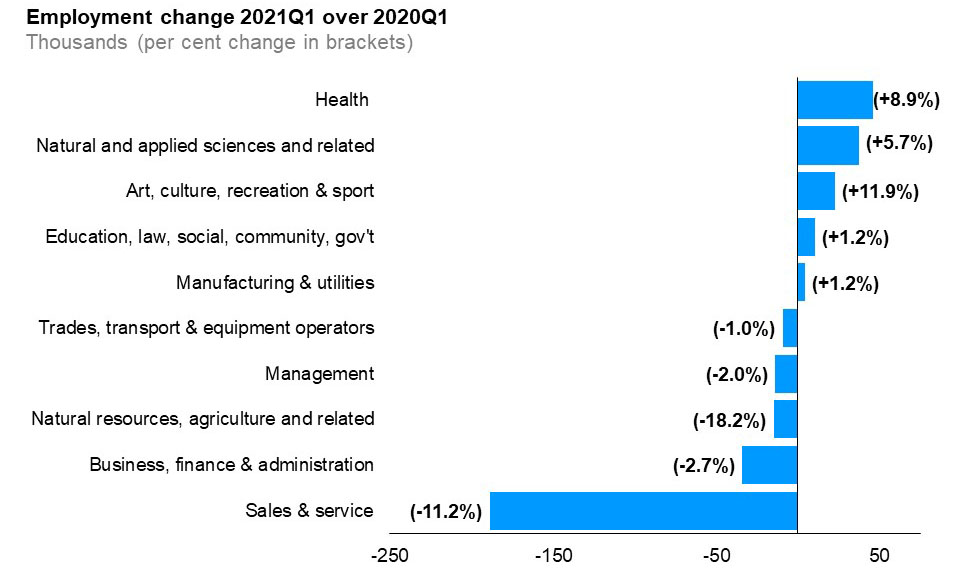
The horizontal bar chart shows a year-over-year (between the first quarters of 2020 and 2021) change in Ontario’s employment by broad occupational group measured in thousands with percentage changes in brackets. Sales and service occupations (-189,000, -11.2%) experienced the largest decline in employment followed by occupations in business, finance and administration (-34,400, -2.7%) and natural resources, agriculture and related occupations (-14,800, -18.2%). Occupations in health experienced the largest gains in employment (+46,000, +8.9%) followed by natural and applied sciences and related occupations (+37,100, +5.7%) and occupations in art, culture, recreation and sport (+22,800, +11.9%).
Among broad occupational groups, sales and service occupations (-11.2%) experienced the largest decline in employment followed by occupations in business, finance and administration (-2.7%) and natural resources, agriculture and related ooccupations (-18.2%). Occupations in health experienced the largest gains in employment (+8.9%), while art, culture, recreation and sport occupations (+11.9%) experienced the highest rate of employment growth in the first quarter of 2021 compared to the first quarter of 2020.
Geographic region
Ontario regions
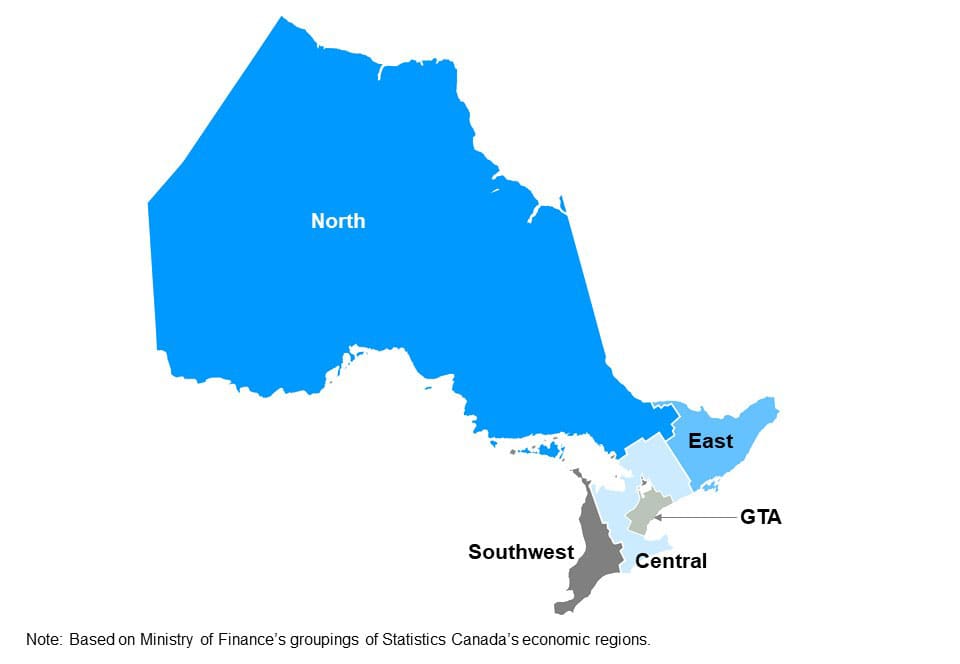
The map shows Ontario’s five regions: Northern Ontario, Eastern Ontario, Southwestern Ontario, Central Ontario and the Greater Toronto Area. This map is based on groupings of Statistics Canada’s economic regions.
Employment change by Ontario region
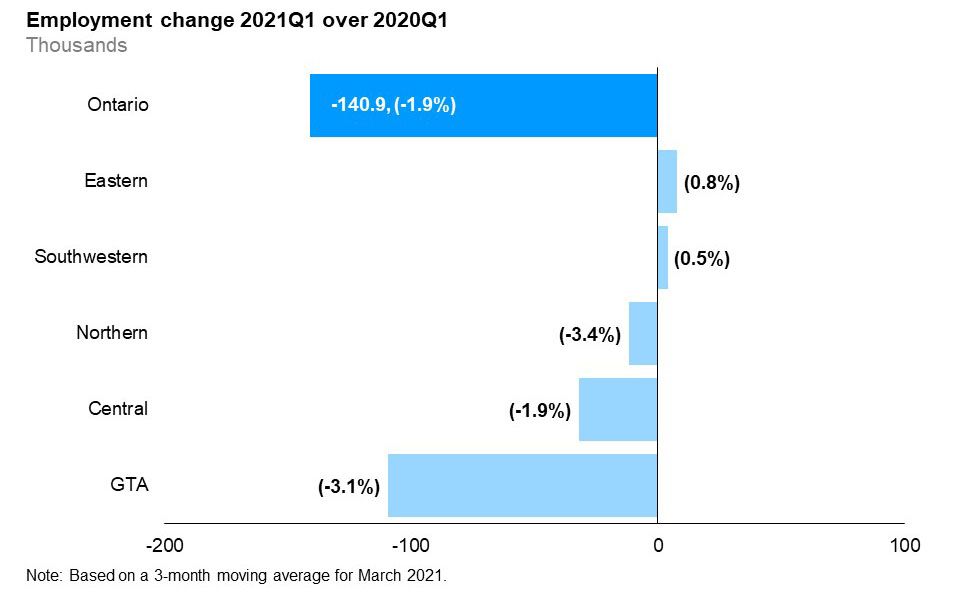
The horizontal bar chart shows a year-over-year (between the first quarters of 2020 and 2021) change in employment in the five Ontario regions: Northern Ontario, Eastern Ontario, Southwestern Ontario, Central Ontario and the Greater Toronto Area (GTA). Employment declined in the Greater Toronto Area (GTA) (-3.1%), Central Ontario (-1.9%) and Northern Ontario (-3.4%). Employment increased in Southwestern Ontario (0.5%) and Eastern Ontario (0.8%). The overall employment in Ontario declined by 1.9%.
Year-over-year, employment declined in Northern Ontario, Central Ontario and the Greater Toronto Area (GTA)
Unemployment rates by Ontario region
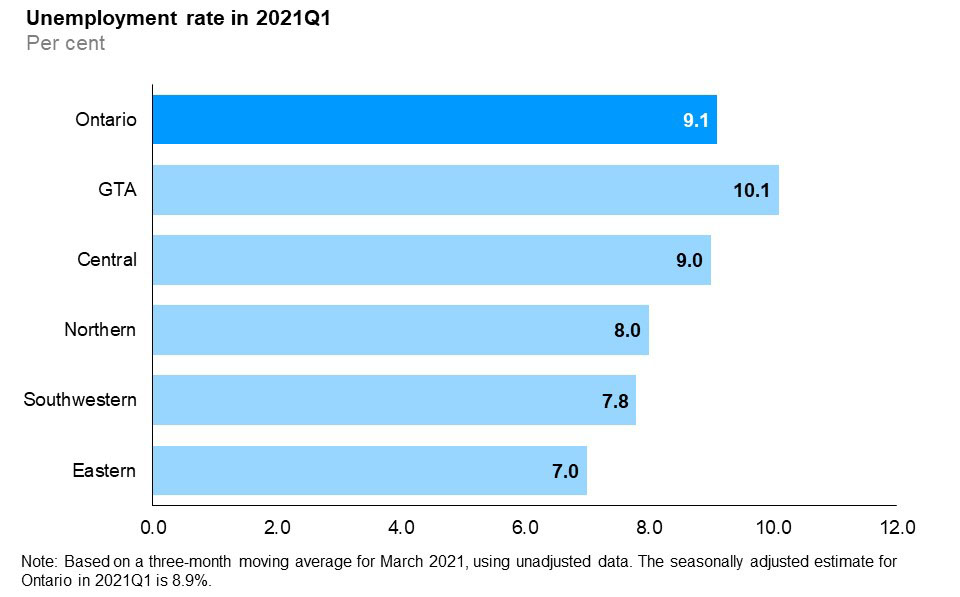
The horizontal bar chart shows unemployment rates by Ontario region in the first quarter of 2021. The unemployment rate increased in all Ontario regions. The Greater Toronto Area had the highest unemployment rate (10.1%) followed by Central Ontario (9.0%), Northern Ontario (8.0%) and Southwestern Ontario (7.8%). Eastern Ontario (7.0%) had the lowest unemployment rate. The overall unemployment rate for Ontario was 9.1%.
In the first quarter of 2021, the unemployment rate increased in every region. The GTA had the highest unemployment rate (10.1%), while Eastern Ontario had the lowest unemployment rate (7.0%).
Participation rates by Ontario region
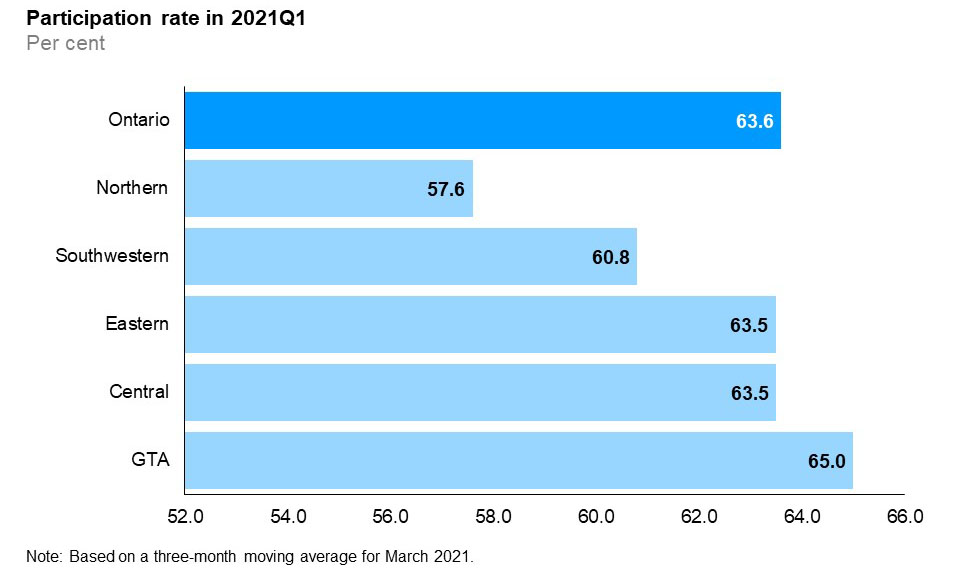
The horizontal bar chart shows participation rates by Ontario region in the first quarter of 2021. The Greater Toronto Area had the highest participation rate at 65.0%, followed by Central Ontario (63.5%), Eastern Ontario (63.5%), Southwestern Ontario (60.8%) and Northern Ontario (57.6%). The overall participation rate for Ontario was 63.6%.
In the first quarter of 2021, the labour force participation rate varied among economic regions, ranging from 57.6% in Northern Ontario to 65.0% in the GTA.
Age and gender quarterly details
Employment change by age group and gender
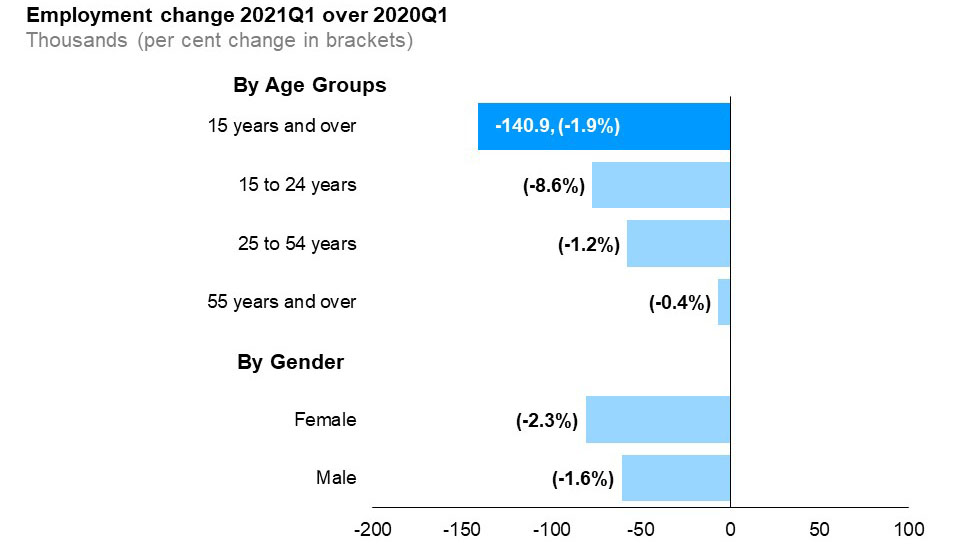
The horizontal bar chart shows a year-over-year (between the first quarters of 2020 and 2021) change in Ontario’s employment for the three major age groups, as well as by gender, compared to the overall population. This is measured in thousands with percentage changes in brackets. Employment declined among workers in all age groups. Youth aged 15 to 24 years posted the largest employment losses (-77,000, -8.6%), followed by core-aged workers aged 25 to 54 years (-57,400, -1.2%) and older workers aged 55 years and over (-6,500, -0.4%). Total employment (for population aged 15 and over) declined by 140,900 (-1.9%). Male employment decreased by 60,500 (-1.6%) and female employment declined by 80,500 (-2.3%).
Compared to the same quarter last year, employment declined among all age groups. Youth aged 15 to 24 years posted the largest employment losses (-8.6%), followed by core-aged workers aged 25 to 54 years (-1.2%) and older workers aged 55 years and over (-0.4%).
Employment losses during the pandemic have been more severe for youth. As a group, youth are more likely to work in industries that were heavily impacted by the pandemic, such as accommodation and food services and retail trade.
Year-over-year, employment decreased for males (-1.6%) and females (-2.3%).
Unemployment rates by age group and gender
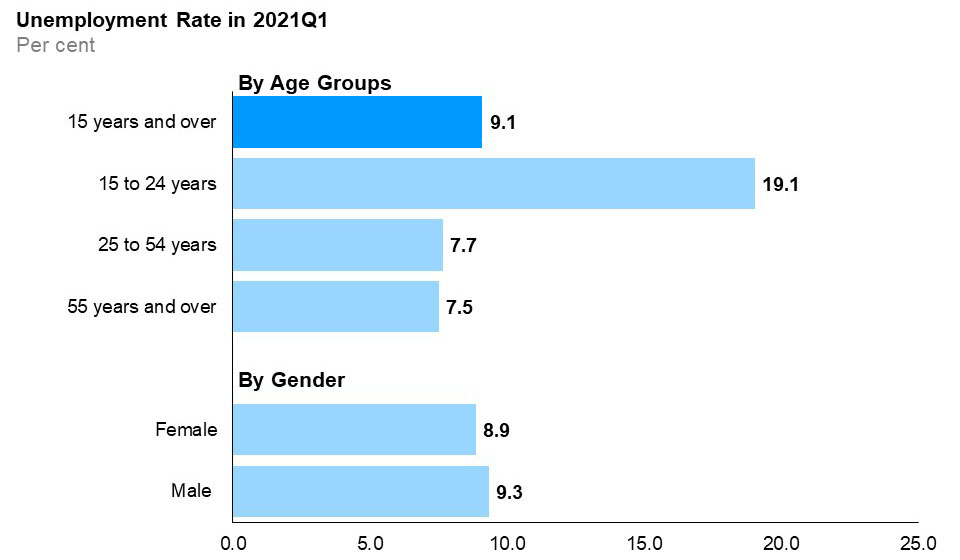
The horizontal bar chart shows unemployment rates for the three major age groups, as well as by gender, compared to the overall rate, in the first quarter of 2021. Youth (15 to 24 years) had the highest unemployment rate at 19.1%, followed by the core-aged population (25 to 54 years) at 7.7% and older Ontarians (55 years and over) at 7.5%. The overall unemployment rate in the first quarter of 2021 was 9.1%. The male unemployment rate was 9.3% and the female unemployment rate was 8.9%.
In the first quarter of 2021, youth had the highest unemployment rate (19.1%) followed core-aged people (7.7%) and older people (7.5%). Compared to the same time last year, the unemployment rate increased by 6.6 percentage points for youth, 2.2 percentage points for core-aged people and 2.8 percentage points for older people.
In the first quarter of 2021, the unemployment rate for males (9.3%) was higher than that for females (8.9%). Compared to the same time last year, the unemployment rate increased by 3.0 percentage points for males and 2.7 percentage points for females.
Participation rates by age group and gender
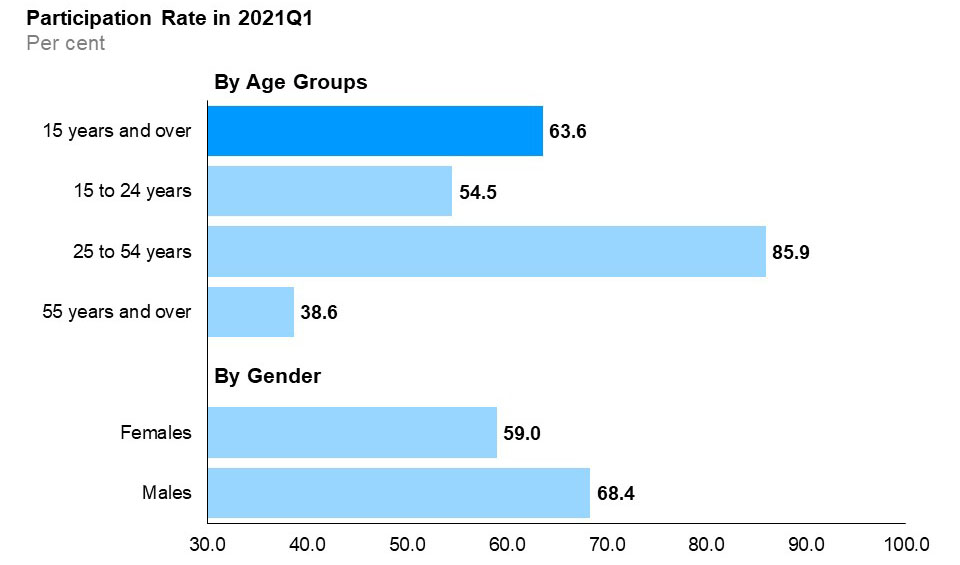
The horizontal bar chart shows labour force participation rates for the three major age groups, as well as by gender, compared to the overall rate, in the first quarter of 2021. The core-aged population (25 to 54 years old) had the highest labour force participation rate at 85.9%, followed by youth (15 to 24 years old) at 54.5%, and older Ontarians (55 years and over) at 38.6%. The overall participation rate was 63.6%. The male participation rate (68.4%) was higher than the female participation rate (59.0%).
In the first quarter of 2021, core-aged people had the highest participation rate (85.9%) followed by youth (54.5%) and older people (38.6%). Compared to the previous year, the participation rate increased among all age groups, except for youth.
Men had a higher participation rate (68.4%) than women (59.0%) in the first quarter of 2021. Compared to the same time last year, the participation rate for males increased by 0.4 percentage points, while the participation rate for females decreased by 0.2 percentage points.
Education level and immigrant status quarterly details
Employment rates by education level and immigrant status (core-aged population)
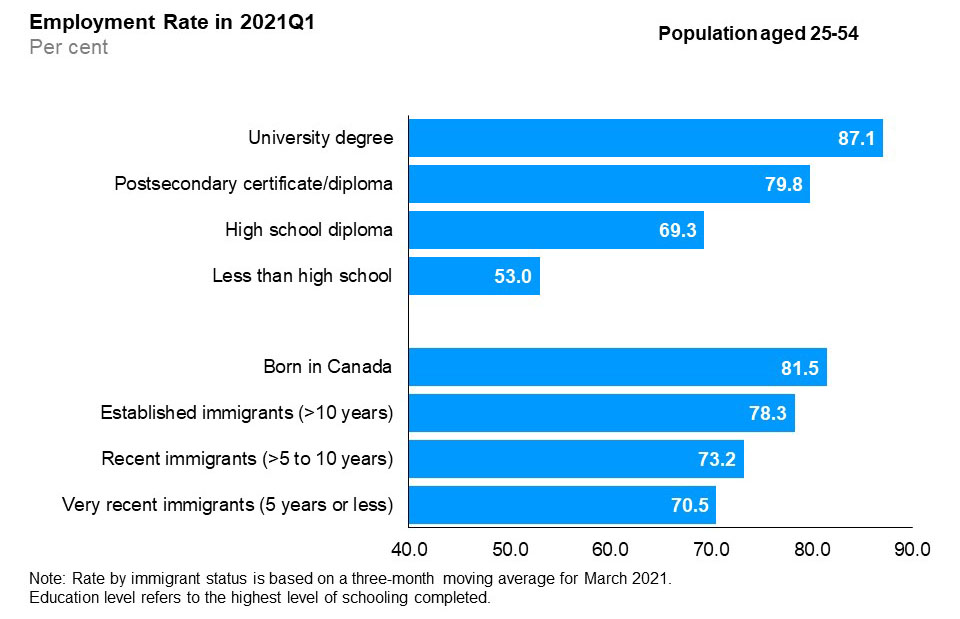
The horizontal bar chart shows employment rates by education level and immigrant status for the core-aged population (25 to 54 years old), in the first quarter of 2021. By education level, those with a university degree had the highest employment rate (87.1%), followed by those with a postsecondary certificate/diploma (79.8%), those with a high school diploma (69.3%), and those with less than high school education (53.0%). By immigrant status, those born in Canada had the highest employment rate (81.5%), followed by established immigrants with more than 10 years since landing (78.3%), recent immigrants with more than 5 to 10 years since landing (73.2%), and very recent immigrants with 5 years or less since landing (70.5%).
In the first quarter of 2020, those with less than a high school diploma continued to have the lowest employment rate (53.0%), while those with a university degree recorded the highest employment rate (87.1%), followed by those with a postsecondary certificate or diploma (79.8%).
Year-over-year, employment declined the most for those with postsecondary certificate or diploma (-86,200 or -5.4%); however, those with less than a high school diploma experienced the sharpest decline in their employment (-12.6%), while employment increased for those with a university degree (+4.1%).
Those born in Canada had the highest employment rate (81.5%), while very recent immigrants continued to have the lowest employment rate (70.5%).
Year-over-year, very recent immigrants saw the sharpest employment decline (-13.4%), while employment of recent immigrants and those born in Canada also decreased. Employment of established immigrants increased slightly (+0.7%) in the first quarter of 2021.
Unemployment rates by education level and immigrant status (core-aged population)
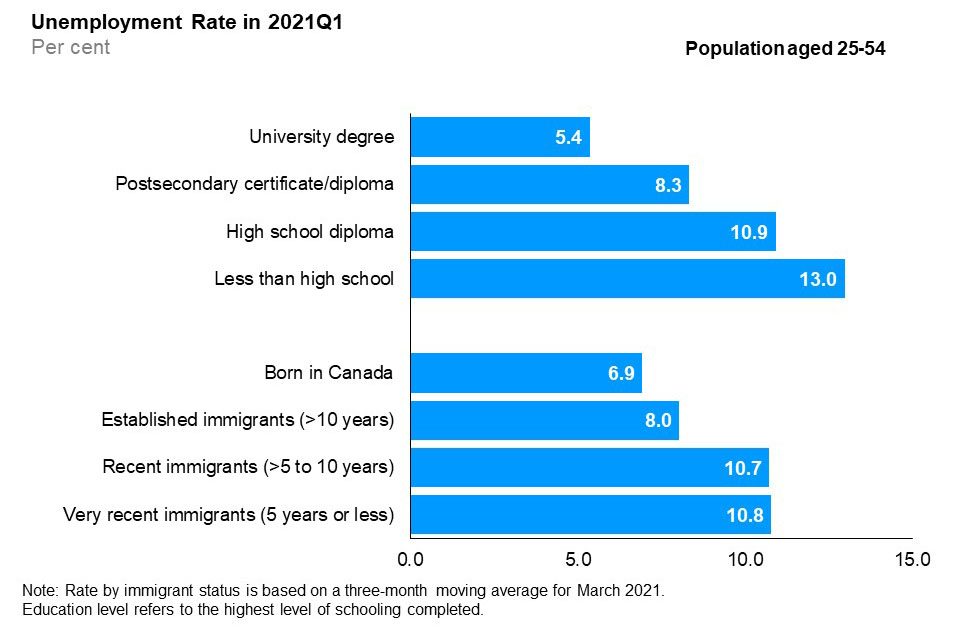
The horizontal bar chart shows unemployment rates by education level and immigrant status for the core-aged population (25 to 54 years old), in the first quarter of 2021. By education level, those with less than high school education had the highest unemployment rate (13.0%), followed by those with high school education (10.9%), those with a postsecondary certificate or diploma (8.3%) and university degree holders (5.4%). By immigrant status, very recent immigrants with 5 years or less since landing had the highest unemployment rate (10.8%), followed by recent immigrants with more than 5 to 10 years since landing (10.7%), established immigrants with more than 10 years since landing (8.0%) and those born in Canada (6.9%).
In the first quarter of 2021, those with a university degree had the lowest unemployment rate (5.4%) while those with less than a high school diploma had the highest unemployment rate (13.0%). Year-over-year, the unemployment rate of core-aged people for all education levels increased.
Year-over-year, the unemployment rate also increased for all groups by immigrant status. In the first quarter of 2021, those born in Canada had the lowest unemployment rate (6.9%), while very recent immigrants had the highest unemployment rate (10.8%).
Participation rates by education level and immigrant status (core-aged population)
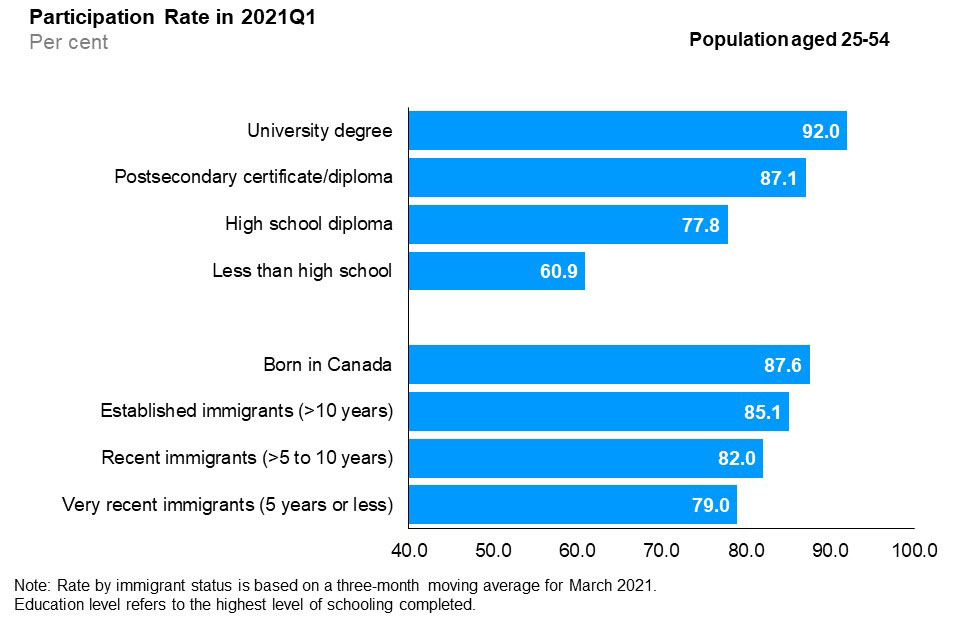
The horizontal bar chart shows labour force participation rates by education level and immigrant status for the core-aged population (25 to 54 years old), in the first quarter of 2021. By education level, university degree holders had the highest participation rate (92.0%), followed by postsecondary certificate or diploma holders (87.1%), high school graduates (77.8%), and those with less than high school education (60.9%). By immigrant status, those born in Canada had the highest participation rate (87.6%), followed by established immigrants with more than 10 years since landing (85.1%), recent immigrants with more than 5 to 10 years since landing (82.0%) and very recent immigrants with 5 years or less since landing (79.0%).
In the first quarter of 2021, those with a university degree continued to have the highest participation rate (92.0%), while those with less than a high school diploma had the lowest participation rate (60.9%). Year-over-year, the participation rate decreased for all education levels except for university graduates (+2.3 percentage points).
In the first quarter of 2021, recent immigrants and very recent immigrants continued to have the lowest participation rate compared to established immigrants and those born in Canada. Year-over-year, the participation rate increased for all groups by immigrant status with the exception of those born in Canada (-0.2 percentage points).
Wages quarterly details
Average hourly wages by employment status, 1997-2020
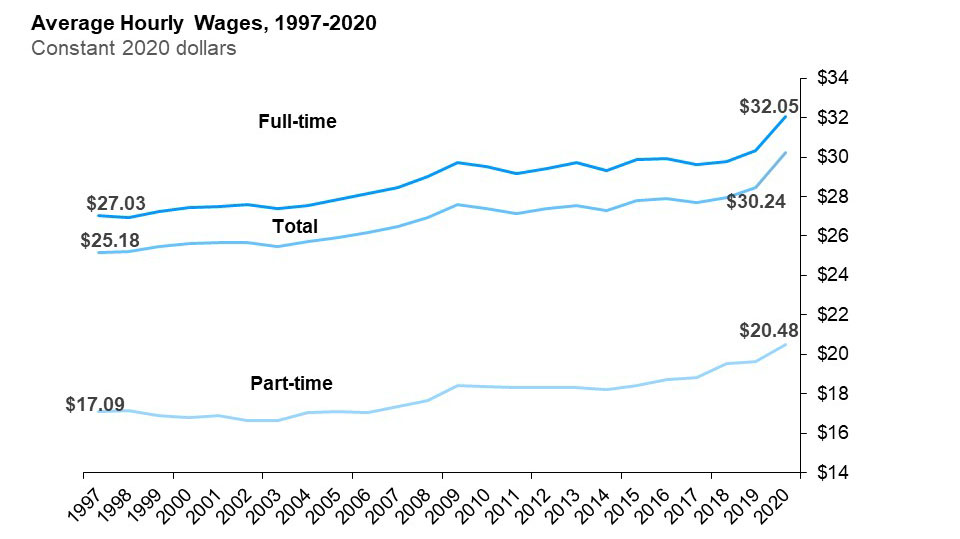
The line chart shows average hourly wages for all employees, full-time and part-time employees expressed in real 2020 dollars from 1997 to 2020. Real average hourly wages of all employees increased from $25.18 in 1997 to $30.24 in 2020; those of full-time employees increased from $27.03 in 1997 to $32.05 in 2020 and those of part-time employees increased from $17.09 in 1997 to $20.48 in 2020.
Over the last two decades, the average hourly wage increased in real terms
Hourly wage growth by type of work

The vertical bar chart shows a year-over-year (between the first quarters of 2020 and 2021) per cent change in Ontario’s nominal hourly wages by type of work. The average hourly wage increased by 5.2%. Hourly wages increased for both full-time (+4.6%) and part-time employees (+4.6%); permanent (+5.2%) and temporary employees (+4.7%) and employees with union coverage (+2.2%) and those without union coverage (6.2%). Inflation during the same period was 1.5%.
In the first quarter of 2021, the average hourly wage of Ontario employees was $30.89, an increase of 5.2% from the first quarter of 2020.
Hourly wages for both full-time and part-time employees increased by 4.6%.
Consumer Price Index inflation over the first quarter of 2021 compared to the first quarter of 2020 was 1.5%.
Average hourly wage rate and wage growth by occupational group
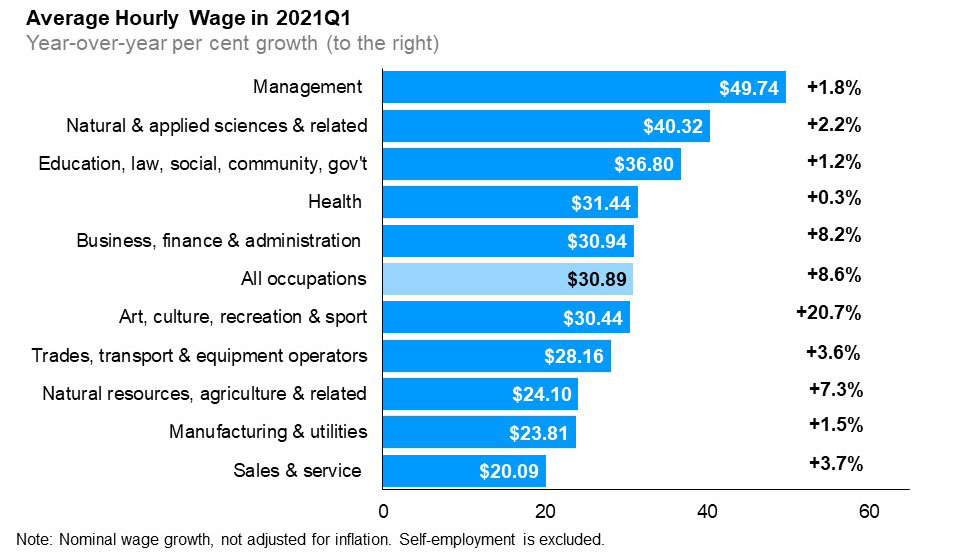
The horizontal bar chart shows average hourly wage rates in the first quarter of 2021 and year-over-year (between the first quarters of 2020 and 2021) growth in average hourly wage rate, by occupational group. In the first quarter of 2021, the average hourly wage rate for Ontario was $30.89 (+8.6%). The highest average hourly wage rate was for management occupations at $49.74 (+1.8%); followed by natural and applied sciences and related occupations at $40.32 (+2.2%); and occupations in education, law and social, community and government services at $36.80 (+1.2%). The lowest average hourly wage rate was for sales and service occupations at $20.09 (+3.7%).
Year-over-year, all broad occupational groups experienced growth in average hourly wages. The three broad occupational groups that experienced the highest wage growth were: art, culture, recreation and sport (+20.7%), business, finance and administration (+8.2%), natural resources, agriculture and related (+7.3%) and sales and service (+3.7%).
Wage increases in some industries may reflect changing composition of employment with employment declines heavily concentrated among employees earning less than $20 an hour.
Appendix I
Net employment between February 2020 and March 2021
Below are highlights (seasonally adjusted) of recent trends in Ontario’s labour market between February 2020 and March 2021 as a result of the pandemic.
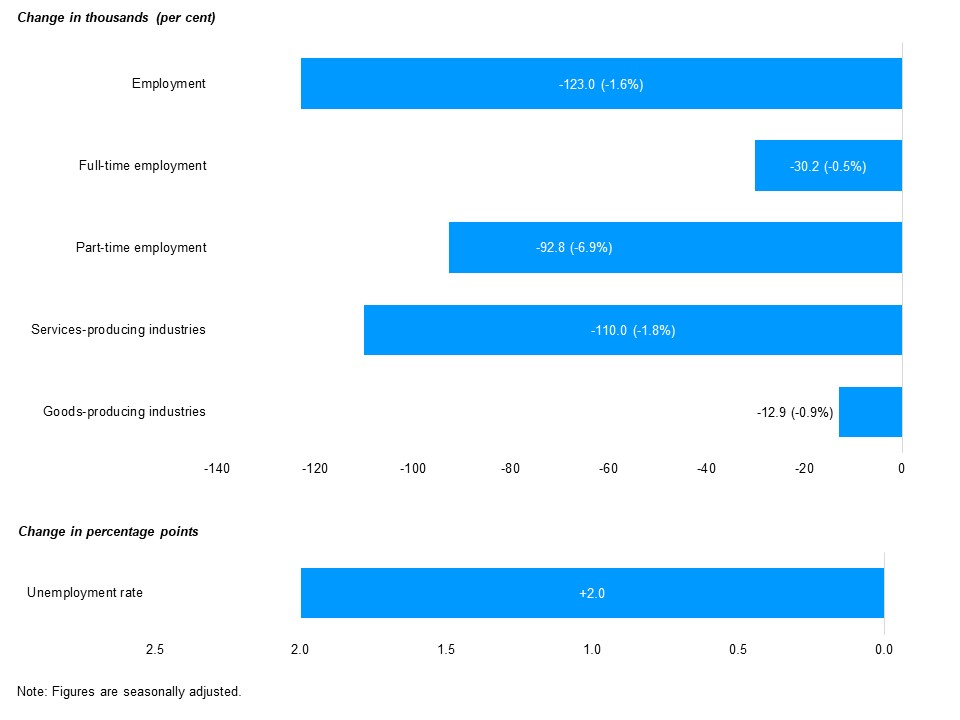
The horizontal bar chart shows seasonally adjusted changes in employment and unemployment rate between February 2020 and March 2021. Employment decreased (-123,000, -1.6%), including a decline in full-time employment (-30,200, -0.5%), as well as part-time employment (-92,800, -6.9%), employment decline in services-producing industries (-110,000, -1.8%), as well as in goods-producing industries (-12,900, -0.9%). Unemployment rate increased by 2.0 percentage points.
Appendix II
Overview of annual employment ten-year review
| 2011 | 2012 | 2013 | 2014 | 2015 | 2016 | 2017 | 2018 | 2019 | 2020 | |
|---|---|---|---|---|---|---|---|---|---|---|
| Total Labour Force (000) | 7,207.3 | 7,238.7 | 7,325.1 | 7,345.3 | 7,343.0 | 7,408.9 | 7,506.5 | 7,608.9 | 7,816.3 | 7,766.0 |
| Participation Rate (%) | 66.5 | 66.0 | 66.1 | 65.7 | 65.1 | 64.9 | 64.7 | 64.3 | 64.9 | 63.6 |
| Male Participation Rate (%) | 71.1 | 70.7 | 70.5 | 70.2 | 70.0 | 69.6 | 69.3 | 68.8 | 69.5 | 68.4 |
| Female Participation Rate (%) | 62.0 | 61.5 | 61.9 | 61.3 | 60.5 | 60.4 | 60.2 | 60.1 | 60.4 | 58.9 |
| Total Employment (000) | 6,638.2 | 6,666.7 | 6,768.1 | 6,809.1 | 6,845.4 | 6,921.4 | 7,052.5 | 7,173.3 | 7,376.9 | 7,021.6 |
| - Full-time (000) | 5,360.4 | 5,389.0 | 5,449.1 | 5,486.6 | 5,557.4 | 5,610.5 | 5,713.2 | 5,845.7 | 6,000.3 | 5,797.4 |
| - Part-time (000) | 1,277.8 | 1,277.7 | 1,318.9 | 1,322.5 | 1,288.0 | 1,310.9 | 1,339.3 | 1,327.6 | 1,376.6 | 1,224.3 |
| Employment-Population Ratio (%) | 61.2 | 60.8 | 61.1 | 60.9 | 60.7 | 60.6 | 60.8 | 60.6 | 61.2 | 57.5 |
| Male Employment (000) | 3,449.1 | 3,470.1 | 3,508.9 | 3,549.1 | 3,583.9 | 3,622.6 | 3,692.1 | 3,760.6 | 3,874.7 | 3,722.1 |
| Female Employment (000) | 3,189.1 | 3,196.6 | 3,259.1 | 3,260.1 | 3,261.4 | 3,298.8 | 3,360.4 | 3,412.7 | 3,502.2 | 3,299.6 |
| Part-Time (% of total) | 19.2 | 19.2 | 19.5 | 19.4 | 18.8 | 18.9 | 19.0 | 18.5 | 18.7 | 17.4 |
| Goods-Producing Sector Employment (000) | 1,397.4 | 1,406.8 | 1,381.0 | 1,366.4 | 1,393.8 | 1,425.1 | 1,439.4 | 1,463.9 | 1,467.3 | 1,410.7 |
| Services-Producing Sector Employment (000) | 5,240.8 | 5,259.9 | 5,387.1 | 5,442.7 | 5,451.6 | 5,496.3 | 5,613.1 | 5,709.5 | 5,909.7 | 5,610.9 |
| Private Sector Employment (000) | 4,331.1 | 4,347.1 | 4,405.3 | 4,473.5 | 4,505.5 | 4,544.1 | 4,640.1 | 4,716.7 | 4,830.6 | 4,542.0 |
| Public Sector Employment (000) | 1,303.1 | 1,289.5 | 1,310.0 | 1,298.1 | 1,281.2 | 1,293.7 | 1,318.8 | 1,359.7 | 1,375.4 | 1,358.8 |
| Self-Employment (% of total) | 15.1 | 15.4 | 15.6 | 15.2 | 15.5 | 15.7 | 15.5 | 15.3 | 15.9 | 16.0 |
| Total Unemployment (000) | 569.1 | 572.0 | 557.1 | 536.1 | 497.6 | 487.5 | 454.0 | 435.5 | 439.4 | 744.4 |
| Unemployment Rate (%) | 7.9 | 7.9 | 7.6 | 7.3 | 6.8 | 6.6 | 6.0 | 5.7 | 5.6 | 9.6 |
| Male Unemployment Rate (%) | 8.2 | 8.2 | 8.0 | 7.5 | 7.0 | 6.8 | 6.3 | 5.7 | 5.8 | 9.2 |
| Female Unemployment Rate (%) | 7.6 | 7.5 | 7.2 | 7.1 | 6.5 | 6.3 | 5.8 | 5.7 | 5.5 | 10.0 |
| Long-Term (27 wks+) (% of total) | 24.3 | 22.8 | 23.1 | 22.9 | 20.0 | 20.0 | 19.5 | 16.9 | 15.0 | 14.7 |
| Average Unemployment in Weeks | 22.5 | 22.3 | 21.9 | 22.5 | 20.0 | 20.0 | 19.3 | 17.2 | 15.8 | 15.3 |
| Youth Unemployment Rate (%) | 15.5 | 16.6 | 15.9 | 15.2 | 14.3 | 13.7 | 12.2 | 11.8 | 12.0 | 22.0 |
| 25-54 y.o. Unemployment rate (%) | 6.6 | 6.5 | 6.3 | 6.0 | 5.6 | 5.5 | 5.1 | 4.8 | 4.6 | 7.7 |
| 55+ y.o. Unemployment rate (%) | 6.1 | 5.9 | 5.6 | 5.5 | 5.0 | 5.0 | 4.6 | 4.3 | 4.2 | 7.0 |
| Average Weekly Wage Rate ($) | 862.69 | 883.62 | 869.44 | 907.05 | 938.01 | 958.16 | 965.71 | 998.41 | 1,033.38 | 1,113.99 |
| Average Hourly Wage Rate ($) | 23.56 | 24.10 | 24.50 | 24.81 | 25.58 | 26.13 | 26.38 | 27.28 | 28.26 | 30.24 |
Employment by region (000)
| 2011 | 2012 | 2013 | 2014 | 2015 | 2016 | 2017 | 2018 | 2019 | 2020 | |
|---|---|---|---|---|---|---|---|---|---|---|
| Greater Toronto Area | 3,074.9 | 3,099.6 | 3,214.9 | 3,202.7 | 3,264.8 | 3,303.9 | 3,363.5 | 3,432.8 | 3,548.3 | 3,381.8 |
| Central | 1,542.0 | 1,537.2 | 1,542.4 | 1,577.6 | 1,582.3 | 1,589.7 | 1,653.6 | 1,659.8 | 1,696.3 | 1,616.5 |
| Southwestern | 767.7 | 768.0 | 764.0 | 771.5 | 769.7 | 779.9 | 785.8 | 808.4 | 810.6 | 771.4 |
| Eastern | 893.9 | 904.1 | 890.7 | 899.4 | 881.5 | 898.2 | 898.5 | 915.1 | 964.5 | 908.5 |
| Northern | 359.7 | 357.8 | 356.1 | 358.0 | 347.1 | 349.7 | 351.0 | 357.3 | 357.2 | 343.3 |
Unemployment rate by region (%)
| 2011 | 2012 | 2013 | 2014 | 2015 | 2016 | 2017 | 2018 | 2019 | 2020 | |
|---|---|---|---|---|---|---|---|---|---|---|
| Greater Toronto Area | 8.4 | 8.8 | 8.2 | 8.0 | 7.1 | 7.0 | 6.5 | 6.2 | 6.0 | 10.7 |
| Central | 7.5 | 7.1 | 6.9 | 6.2 | 5.9 | 5.9 | 5.4 | 5.3 | 5.2 | 8.8 |
| Southwestern | 8.1 | 7.9 | 7.7 | 7.0 | 6.9 | 6.1 | 5.6 | 5.3 | 5.5 | 9.0 |
| Eastern | 6.7 | 6.6 | 6.6 | 7.0 | 6.6 | 6.4 | 5.9 | 5.0 | 4.9 | 7.7 |
| Northern | 7.8 | 7.2 | 7.5 | 6.6 | 7.2 | 7.2 | 6.5 | 6.0 | 6.1 | 7.8 |
Total employment by CMA (000)
Greater Toronto Area
| 2011 | 2012 | 2013 | 2014 | 2015 | 2016 | 2017 | 2018 | 2019 | 2020 | |
|---|---|---|---|---|---|---|---|---|---|---|
| Toronto | 2,916.7 | 2,942.9 | 3,061.1 | 3,043.4 | 3,114.1 | 3,140.1 | 3,206.7 | 3,262.4 | 3,385.7 | 3,221.8 |
| Oshawa | 188.1 | 188.3 | 191.5 | 197.3 | 191.4 | 208.3 | 204.6 | 214.6 | 213.0 | 205.5 |
Central Ontario
| 2011 | 2012 | 2013 | 2014 | 2015 | 2016 | 2017 | 2018 | 2019 | 2020 | |
|---|---|---|---|---|---|---|---|---|---|---|
| Hamilton | 373.2 | 373.7 | 369.9 | 376.9 | 377.4 | 377.3 | 408.3 | 403.0 | 411.2 | 384.9 |
| Kitchener | 280.2 | 279.0 | 284.4 | 288.9 | 288.1 | 291.7 | 301.6 | 309.4 | 322,7 | 306.2 |
| St. Catharines-Niagara | 195.0 | 200.0 | 192.2 | 194.3 | 204.4 | 204.9 | 200.8 | 205.7 | 204.3 | 190.6 |
| Peterborough | 57.3 | 58.1 | 54.2 | 59.1 | 59.8 | 58.6 | 61.3 | 64.6 | 62.0 | 53.6 |
| Brantford | 68.3 | 67.1 | 68.3 | 68.1 | 69.0 | 70.0 | 71.9 | 69.6 | 78.1 | 71.9 |
| Guelph | 81.9 | 83.6 | 78.7 | 80.5 | 89.3 | 90.1 | 90.5 | 88.2 | 91.1 | 85.1 |
| Barrie | 101.0 | 101.3 | 107.8 | 109.3 | 105.7 | 101.8 | 113.0 | 112.2 | 116.9 | 117.6 |
Eastern Ontario
| 2011 | 2012 | 2013 | 2014 | 2015 | 2016 | 2017 | 2018 | 2019 | 2020 | |
|---|---|---|---|---|---|---|---|---|---|---|
| Ottawa | 525.0 | 540.4 | 524.7 | 532.4 | 528.6 | 542.5 | 547.9 | 558.4 | 588.0 | 557.1 |
| Kingston | 78.7 | 79.2 | 80.2 | 78.5 | 79.5 | 80.3 | 84.0 | 82.9 | 83.7 | 80.0 |
| Belleville | 59.7 | 52.9 | 39.5 | 34.4 | 31.9 | 33.7 | 40.0 | 41.3 | 51.7 | 49.3 |
Southwestern Ontario
| 2011 | 2012 | 2013 | 2014 | 2015 | 2016 | 2017 | 2018 | 2019 | 2020 | |
|---|---|---|---|---|---|---|---|---|---|---|
| London | 236.3 | 240.0 | 236.2 | 238.0 | 247.5 | 242.8 | 244.3 | 254.0 | 253.8 | 257.2 |
| Windsor | 147.2 | 152.1 | 154.4 | 154.8 | 156.5 | 162.5 | 161.2 | 164.1 | 170.9 | 152.2 |
Northern Ontario
| 2011 | 2012 | 2013 | 2014 | 2015 | 2016 | 2017 | 2018 | 2019 | 2020 | |
|---|---|---|---|---|---|---|---|---|---|---|
| Sudbury | 82.7 | 81.7 | 84.0 | 83.4 | 82.1 | 82.8 | 81.7 | 83.0 | 86.9 | 81.1 |
| Thunder Bay | 60.1 | 61.5 | 62.5 | 61.3 | 59.3 | 60.0 | 61.5 | 64.3 | 62.7 | 59.0 |
Overview of quarterly employment year-over-year
| 2019 q2 | 2020 q2 | 2019 q3 | 2020 q3 | 2019 q4 | 2020 q4 | 2020 q1 | 2021 q1 | |
|---|---|---|---|---|---|---|---|---|
| Total Labour Force (000) | 7,843.7 | 7,469.6 | 7,935.6 | 7,951.7 | 7,839.5 | 7,913.7 | 7,729.1 | 7,817.6 |
| Participation Rate (%) | 65.3 | 61.2 | 65.7 | 65.0 | 64.6 | 64.5 | 63.5 | 63.6 |
| Male Participation Rate (%) | 69.9 | 66.3 | 70.8 | 70.2 | 68.9 | 69.1 | 67.9 | 68.4 |
| Female Participation Rate (%) | 60.7 | 56.3 | 60.8 | 60.0 | 60.5 | 60.1 | 59.2 | 59.0 |
| Total Employment (000) | 7,398.9 | 6,533.5 | 7,464.2 | 7,070.2 | 7,459.6 | 7,236.4 | 7,246.6 | 7,105.6 |
| - Full-time (000) | 6,032.7 | 5,526.0 | 6,157.4 | 5,860.4 | 6,027.2 | 5,904.2 | 5,898.8 | 5,883.9 |
| - Part-time (000) | 1,366.1 | 1,007.4 | 1,306.9 | 1,209.7 | 1,432.4 | 1,332.2 | 1,347.8 | 1,221.8 |
| Employment-Population Ratio (%) | 61.6 | 53.6 | 61.8 | 57.8 | 61.5 | 59.0 | 59.5 | 57.8 |
| Male Employment (000) | 3,889.0 | 3,504.2 | 3,964.3 | 3,768.7 | 3,896.1 | 3,812.8 | 3,802.5 | 3,742.0 |
| Female Employment (000) | 3,509.9 | 3,029.3 | 3,500.0 | 3,301.4 | 3,563.5 | 3,423.5 | 3,444.1 | 3,363.6 |
| Part-Time (% of total) | 18.5 | 15.4 | 17.5 | 17.1 | 19.2 | 18.4 | 18.6 | 17.2 |
| Goods-Producing Sector Employment (000) | 1,476.8 | 1,296.7 | 1,508.2 | 1,451.0 | 1,468.3 | 1,476.9 | 1,418.3 | 1,423.9 |
| Services-Producing Sector Employment (000) | 5,922.1 | 5,236.8 | 5,956.1 | 5,619.1 | 5,991.3 | 5,759.5 | 5,828.3 | 5,681.7 |
| Private Sector Employment (000) | 4,853.6 | 4,085.5 | 4,909.6 | 4,659.8 | 4,846.1 | 4,735.8 | 4,687.1 | 4,596.9 |
| Public Sector Employment (000) | 1,378.0 | 1,316.4 | 1,343.0 | 1,312.7 | 1,424.3 | 1,399.9 | 1,406.2 | 1,434.8 |
| Self-Employment (% of total) | 15.8 | 17.3 | 16.2 | 15.5 | 15.9 | 15.2 | 15.9 | 15.1 |
| Total Unemployment (000) | 444.9 | 936.1 | 471.4 | 881.5 | 379.9 | 677.3 | 482.5 | 712.0 |
| Unemployment Rate (%) | 5.7 | 12.5 | 5.9 | 11.1 | 4.8 | 8.6 | 6.2 | 9.1 |
| Male Unemployment Rate (%) | 5.8 | 11.8 | 5.6 | 10.6 | 5.1 | 8.3 | 6.3 | 9.3 |
| Female Unemployment Rate (%) | 5.6 | 13.4 | 6.4 | 11.7 | 4.6 | 8.8 | 6.2 | 8.9 |
| Long-Term (27 wks+) (% of total) | 14.4 | 6.8 | 13.7 | 12.5 | 16.3 | 29.2 | 13.7 | 29.1 |
| Average Unemployment in Weeks | 15.5 | 11.8 | 14.0 | 15.6 | 17.6 | 20.1 | 15.1 | 21.8 |
| Youth Unemployment Rate (%) | 12.4 | 29.6 | 12.6 | 26.1 | 10.5 | 19.3 | 12.4 | 19.1 |
| 25-54 y.o. Unemployment rate (%) | 4.5 | 10.1 | 4.9 | 8.5 | 4.1 | 6.9 | 5.5 | 7.7 |
| 55+ y.o. Unemployment rate (%) | 4.3 | 9.1 | 4.2 | 7.7 | 3.5 | 6.6 | 4.7 | 7.5 |
| Average Weekly Wage Rate ($) | 1,031.58 | 1,157.31 | 1,045.03 | 1,122.04 | 1,045.21 | 1,109.06 | 1,072.65 | 1,135.33 |
| Average Hourly Wage Rate ($) | 28.16 | 31.17 | 28.37 | 30.33 | 28.67 | 30.21 | 29.35 | 30.89 |
Employment by Region (000)
| 2019 q2 | 2020 q2 | 2019 q3 | 2020 q3 | 2019 q4 | 2020 q4 | 2020 q1 | 2021 q1 | |
|---|---|---|---|---|---|---|---|---|
| Greater Toronto Area (GTA) | 3,555.1 | 3,117.1 | 3,601.3 | 3,405.9 | 3,578.2 | 3,504.0 | 3,500.2 | 3,390.9 |
| Central | 1,706.3 | 1,503.0 | 1,706.2 | 1,626.2 | 1,720.0 | 1,667.6 | 1,669.2 | 1,637.5 |
| Southwestern | 814.2 | 717.7 | 815.7 | 774.7 | 824.8 | 795.2 | 798.4 | 802.4 |
| Eastern | 964.2 | 866.2 | 980.2 | 913.7 | 981.8 | 924.1 | 930.1 | 937.9 |
| Northern | 359.0 | 329.4 | 360.9 | 349.6 | 354.7 | 345.5 | 348.6 | 336.9 |
Unemployment Rate by Region (%)
| 2019 q2 | 2020 q2 | 2019 q3 | 2020 q3 | 2019 q4 | 2020 q4 | 2020 q1 | 2021 q1 | |
|---|---|---|---|---|---|---|---|---|
| Greater Toronto Area (GTA) | 6.1 | 13.7 | 6.3 | 13.1 | 5.1 | 10.1 | 6.2 | 10.1 |
| Central | 5.2 | 12.1 | 5.5 | 9.6 | 4.8 | 7.4 | 6.4 | 9.0 |
| Southwestern | 4.9 | 12.4 | 6.3 | 9.1 | 4.7 | 7.5 | 7.1 | 7.8 |
| Eastern | 5.3 | 10.0 | 5.1 | 8.8 | 4.1 | 6.3 | 5.5 | 7.0 |
| Northern | 6.9 | 10.3 | 5.8 | 8.0 | 5.3 | 6.7 | 6.2 | 8.0 |
Total Employment by CMA (000)
Greater Toronto Area
| 2019 q2 | 2020 q2 | 2019 q3 | 2020 q3 | 2019 q4 | 2020 q4 | 2020 q1 | 2021 q1 | |
|---|---|---|---|---|---|---|---|---|
| Toronto | 3,386.5 | 2,954.3 | 3,440.4 | 3,233.7 | 3,428.0 | 3,347.4 | 3,351.8 | 3,236.4 |
| Oshawa | 221.2 | 195.0 | 209.5 | 208.2 | 204.2 | 210.4 | 208.5 | 203.0 |
Central Ontario
| 2019 q2 | 2020 q2 | 2019 q3 | 2020 q3 | 2019 q4 | 2020 q4 | 2020 q1 | 2021 q1 | |
|---|---|---|---|---|---|---|---|---|
| Hamilton | 404.3 | 357.9 | 412.1 | 379.1 | 425.6 | 397.4 | 405.2 | 400.7 |
| Kitchener | 326.5 | 283.9 | 325.6 | 302.1 | 325.9 | 313.2 | 325.5 | 310.2 |
| St. Catharines-Niagara | 201.0 | 174.3 | 208.4 | 196.8 | 211.6 | 198.6 | 192.8 | 181.6 |
| Peterborough | 63.0 | 51.3 | 61.7 | 53.1 | 60.3 | 55.5 | 54.6 | 58.6 |
| Brantford | 80.3 | 68.2 | 80.1 | 74.1 | 77.0 | 74.7 | 70.7 | 73.9 |
| Guelph | 93.7 | 80.6 | 90.2 | 87.2 | 87.5 | 86.5 | 85.9 | 87.0 |
| Barrie | 115.7 | 113.9 | 116.9 | 121.8 | 122.5 | 112.2 | 122.5 | 107.1 |
Eastern Ontario
| 2019 q2 | 2020 q2 | 2019 q3 | 2020 q3 | 2019 q4 | 2020 q4 | 2020 q1 | 2021 q1 | |
|---|---|---|---|---|---|---|---|---|
| Ottawa (Ontario part) | 572.9 | 532.9 | 603.3 | 563.0 | 611.4 | 561.1 | 571.4 | 581.7 |
| Kingston | 87.0 | 75.2 | 84.0 | 80.8 | 81.7 | 83.4 | 80.5 | 82.8 |
| Belleville | 53.3 | 43.9 | 39.3 | 46.8 | 53.1 | 53.1 | 53.5 | 52.6 |
Southwestern Ontario
| 2019 q2 | 2020 q2 | 2019 q3 | 2020 q3 | 2019 q4 | 2020 q4 | 2020 q1 | 2021 q1 | |
|---|---|---|---|---|---|---|---|---|
| London | 247.4 | 237.7 | 254.3 | 261.7 | 265.2 | 264.2 | 265.2 | 273.0 |
| Windsor | 174.8 | 139.5 | 169.5 | 156.6 | 167.9 | 152.8 | 159.8 | 159.4 |
Northern Ontario
| 2019 q2 | 2020 q2 | 2019 q3 | 2020 q3 | 2019 q4 | 2020 q4 | 2020 q1 | 2021 q1 | |
|---|---|---|---|---|---|---|---|---|
| Sudbury | 87.7 | 76.6 | 86.6 | 81.6 | 86.8 | 81.9 | 84.3 | 79.0 |
| Thunder Bay | 63.2 | 54.7 | 63.6 | 59.9 | 63.5 | 60.5 | 61.0 | 57.8 |
Overview of monthly* labour force characteristics
| Feb-20 | Mar-20 | Apr-20 | May-20 | Jun-20 | Jul-20 | Aug-20 | Sep-20 | Oct-20 | Nov-20 | Dec-20 | Jan-21 | Feb-21 | Mar-21 | |
|---|---|---|---|---|---|---|---|---|---|---|---|---|---|---|
| Employment | 7,491.1 | 7,098.2 | 6,409.9 | 6,356.4 | 6,725.6 | 6,884.5 | 7,006.8 | 7,168.9 | 7,200.6 | 7,238.3 | 7,239.0 | 7,085.5 | 7,185.8 | 7,368.1 |
| Unemployment rate | 5.5 | 7.4 | 11.3 | 13.5 | 12.2 | 11.3 | 10.6 | 9.6 | 9.7 | 9.2 | 9.6 | 10.2 | 9.2 | 7.5 |
| Participation rate | 65.1 | 62.9 | 59.2 | 60.2 | 62.8 | 63.5 | 64.1 | 64.7 | 65.1 | 65.0 | 65.3 | 64.2 | 64.4 | 64.7 |
*Seasonally adjusted
Note: All estimates in this appendix are based on Statistics Canada’s Labour Force Survey.
Footnotes
- footnote[1] Back to paragraph In February and March 2021, regions were transitions back into the Response Framework: February 10: 3 regions (Hastings and Prince Edward Counties Health Unit; Kingston, Frontenac and Lennox & Addington Public Health; Renfrew County and District Health Unit). February 16: 27 regions (Algoma Public Health Unit; Brant County Health Unit; Chatham-Kent Health Unit; Durham Region Health Department; Eastern Ontario Health Unit; Grey Bruce Health Unit; Haldimand-Norfolk Health Unit; Haliburton, Kawartha, Pine Ridge District Health Unit; Halton Region Health Department; Hamilton Public Health Services; Huron Perth District Health Unit; Lambton Public Health; Leeds, Grenville and Lanark District Health Unit; Middlesex-London Health Unit; Niagara Region Public Health Department; Northwestern Health Unit; Ottawa Public Health; Peterborough Public Health; Porcupine Health Unit; Region of Waterloo, Public Health; Simcoe Muskoka District Health Unit; Southwestern Public Health; Sudbury & District Health Unit; Thunder Bay District Health Unit; Timiskaming Health Unit; Wellington-Dufferin-Guelph Public Health; Windsor-Essex County Health Unit). February 22: 1 region (York Region Public Health Services). March 8: 3 regions (North Bay Parry Sound District Health Unit; Peel Public Health; Toronto Public Health).
- footnote[2] Back to paragraph This economic region closely matches the GTA, the main exception being that it excludes the city of Burlington.
- footnote[3] Back to paragraph Real wages are based on nominal wages deflated by the Consumer Price Index (CPI) for all items. Self-employment is excluded.
- footnote[4] Back to paragraph Year-over-year comparison (between first quarters of 2020 and 2021) is in nominal dollars.
- footnote[5] Back to paragraph Measured as an increase in the all-items Consumer Price Index for Ontario between January and March of 2020 and January and March of 2021.