April to June, 2020
Introduction
About the Ontario Employment Report
The Ontario Employment Report is released four times a year and provides an assessment of the current trends and developments in the Ontario labour market. The Ontario Employment Report is a companion report to the Ontario Economic Accounts, which provides an overall assessment of the current state of the Ontario economy.
Methodological note
In the current issue, year-over-year change represents change between the averages in the second quarter of 2019 and the second quarter of 2020. Note that the Ontario Economic Accounts report primarily shows changes between the previous and the current quarter.
This report uses seasonally adjusted data in charts displaying data with a monthly frequency in the Overview section.
Unadjusted data is used in charts and tables showing the changes for the current quarter compared with the same quarter for the previous year. Unadjusted data is also used to calculate annual averages, year-to-date averages and 2020 second quarter averages.
All estimates in this report are based on Statistics Canada’s Labour Force Survey (LFS), which measures the current state of the national provincial and territorial labour market. The LFS is based on a household survey carried out monthly by Statistics Canada in reference weeks of the month. The reference periods for the three months of the second quarter of 2020 are April 12 to April 18, May 10 to May 16 and June 14 to June 20.
Impact of COVID-19 on the labour market
Beginning in mid-March 2020, a number of travel restrictions, business closures and physical distancing measures were put in place by various levels of government to help contain the spread of COVID-19 and protect the health of Ontarians. As a result of the significant health and economic impacts from the pandemic, Ontario experienced an unprecedented decline in employment during March.
The second quarter of 2020 included data from April and May, during which employment continued to decline as a result of the COVID-19 pandemic.
The quarter also included data from June 2020, reflecting the early stages of reopening the provincial economy.
Appendix I of this report provides highlights of recent trends and challenges in Ontario’s labour market as a result of the COVID-19 pandemic and the impact of the economy reopening in June.
Overview
Ontario’s labour market overview
Employment:
- 889,100 net job losses in Q2 2020, year-over-year
- 526,600 net full-time jobs in Q2 2020, year-over-year
- +377,900 jobs in June 2020
- +219,500 full-time jobs in June 2020
Unemployment rate:
- 12.5% in the second quarter of 2020
- 12.2% in June 2020
Year-over-year, Ontario’s employment, decreased by 11.9% (-889,100) in the second quarter of 2020, while Canada’s employment decreased by 12.3% (-2,354,000).
In June 2020, Ontario’s employment increased by 5.0% (+377,900) as the economy started to reopen, and Canada’s employment also increased by 5.0% (+952,900).
Ontario’s unemployment rate was 12.5% in the second quarter of 2020, lower than the Canadian rate of 13.0%.
In June 2020, Ontario’s unemployment rate decreased by 1.4 percentage points (from 13.6% to 12.2%), and Canada’s unemployment rate also decreased by 1.4 percentage points (from 13.7% to 12.3%).
Year-over-year overview
Ontario’s labour market, 2008-2020
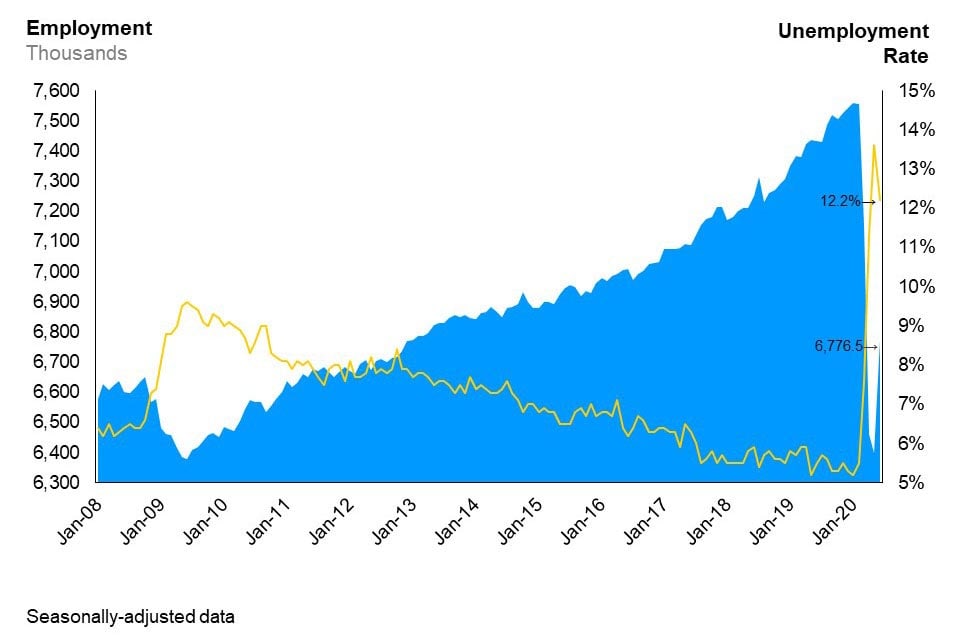
The combination line and area chart shows Ontario’s unemployment rate (line chart) and employment (area chart) from January 2008 to June 2020. Ontario’s unemployment rate has trended downwards since the 2008/09 recession, reaching 5.2% in January 2020, before it rises to 13.6% in May 2020, then falling to 12.2% in June 2020. Employment in Ontario has risen steadily since the 2008/09 recession, reaching just over 7.5 million workers in January 2020, before dropping to 6.4 million workers in May 2020, then rising to 6.8 million workers in June 2020.
As a result of the pandemic’s unprecedented economic disruption, between the second quarter of 2019 and 2020:
- the decline in employment was driven by decreases in full-time employment (-526,600, -8.6%) and part-time employment (-362,500, -26.3%).
- employment declined more sharply in the private sector (-15.8%) compared to the public sector (-4.2%) and those who are self-employed (-4.9%).
- employment decreased in both the goods-producing industries (-12.0%) and services-producing industries (-11.9%) with accommodation and food services experiencing the largest decline in employment (-44.3%).
- all five Ontario regions posted employment losses with the GTA experiencing the largest decline in employment (-12.4%).
- youth experienced the largest decline in employment (-30.3%) compared to other age groups.
Type of Work quarterly details
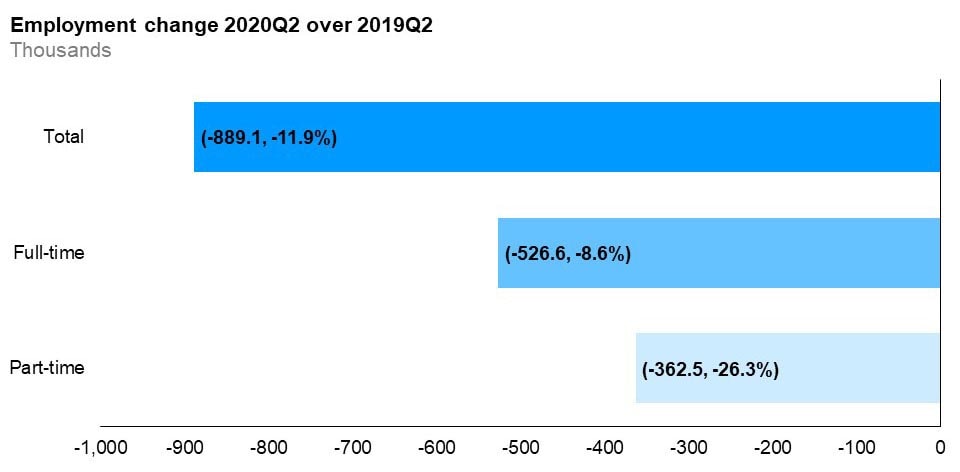
The horizontal bar chart shows a year-over-year (between the second quarters of 2019 and 2020) change in Ontario’s employment by full-time and part-time status. Total employment decreased by 11.9%, with full-time employment decreasing by 8.6%, and part-time employment decreasing by 26.3%.
Year-over-year, full-time employment decreased by 8.6% and part-time employment decreased by 26.3% in the second quarter of 2020.
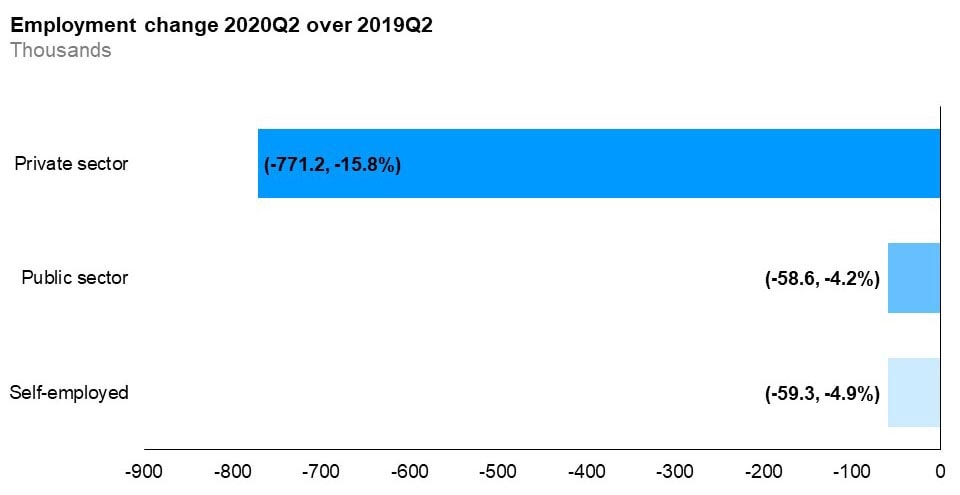
The horizontal bar chart shows a year-over-year (between the second quarters of 2019 and 2020) change in Ontario’s employment for the private sector, public sector and self-employment. Employment decreased in the private sector (-15.8%), public sector (-4.2%) and self-employment (-4.9%).
Year-over-year, private sector employment decreased by 15.8%, self-employment decreased by 4.9% and public sector employment decreased by 4.2%.
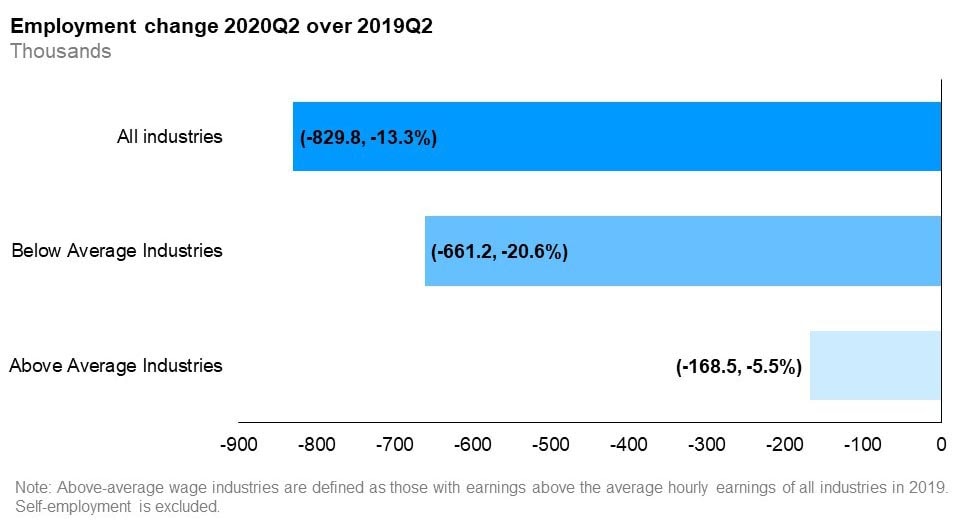
The horizontal bar chart shows a year-over-year (between the second quarters of 2019 and 2020) change in Ontario’s employment for above- and below-average wage industries, compared to the paid employment in all industries. Employment decreased in above-average wage industries by 5.5% and in below-average wage industries by 20.6%. Paid employment in all industries (excluding self-employment) decreased by 13.3%. Above-average wage industries are defined as those with wage rates above the average hourly wages of all industries in 2019.
Year-over-year, paid employment decreased in above-average wage industries by 5.5%, while employment in below-average wage industries decreased by 20.6%.
Sector and occupation quarterly details
Employment change by industry, goods-producing industries
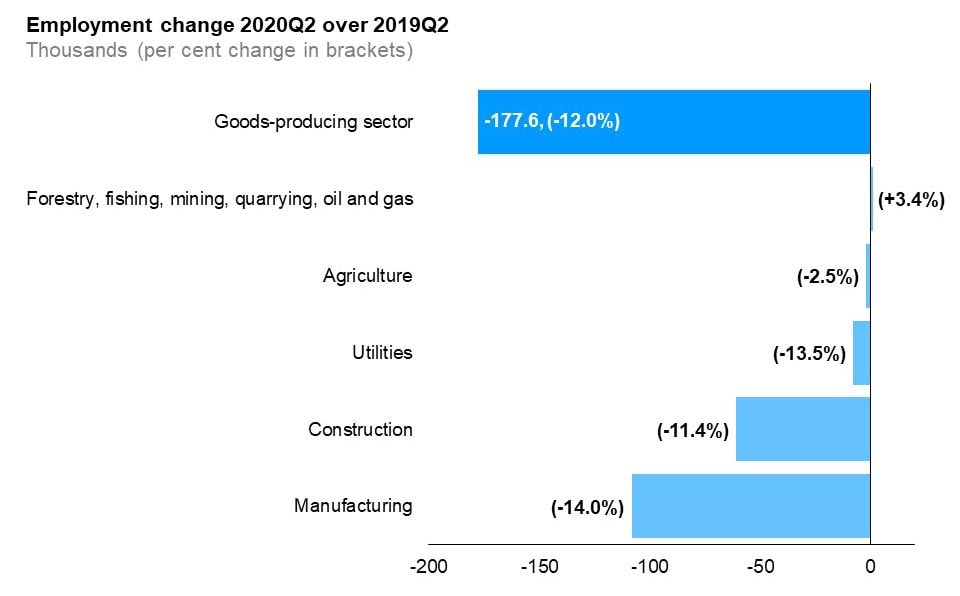
The horizontal bar chart shows a year-over-year (between the second quarters of 2019 and 2020) change in Ontario’s employment by industry for goods-producing industries. Employment in all goods-producing industries declined over this period except for forestry, fishing, mining, quarrying, oil and gas which saw 3.4% growth. Manufacturing had the largest decline in employment (-14.0%) followed by construction (+11.4%), utilities (-13.5%) and agriculture (-2.5%). The overall employment in goods-producing industries decreased by 12.0%.
Employment in the majority of goods-producing industries declined in the second quarter of 2020, compared to the same period in 2019. The only exception was in forestry, fishing, mining, quarrying, oil and gas, which saw a 3.4% growth in employment. Manufacturing had the largest decline in employment (-14.0%) followed by construction (-11.4%), utilities (-13.5%) and agriculture (-2.5%).
Employment change by industry, services-producing industries
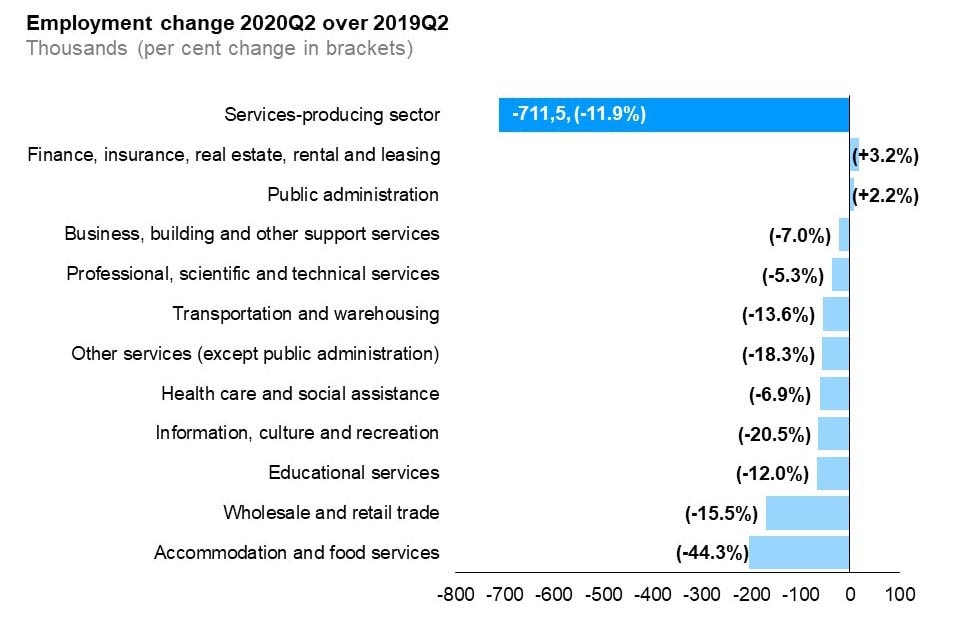
The horizontal bar chart shows a year-over-year (between the second quarters of 2019 and 2020) change in Ontario’s employment by industry for services-producing industries. The majority of the services-producing industries experienced decline in employment. Finance, insurance, real estate, rental and leasing (+3.2%) and public administration (+2.2%) were the only industries that gained jobs over this period. The largest employment decline occurred in accommodation and food services (-44.3%) followed by wholesale and retail trade (-15.5%) and educational services (-12.0%). The overall employment in services-producing industries decreased by 11.9%.
Employment in the majority of service-producing industries declined in the second quarter of 2020 compared to the same period in 2019. Among services-producing industries, finance, insurance, real estate, rental and leasing (+3.2%) and public adiministation (+2.2%) were the only industries that gained jobs over this period.
Accommodation and food services (-44.3%) lost the highest number of jobs compared to the second quarter of 2019 followed by wholesale and retail trade (-15.5%). Educational services (-12.0%), information, culture and recreation (-20.5%) and health care and social assistance (-6.9%) experienced large declines in employment.
Employment change by occupational group
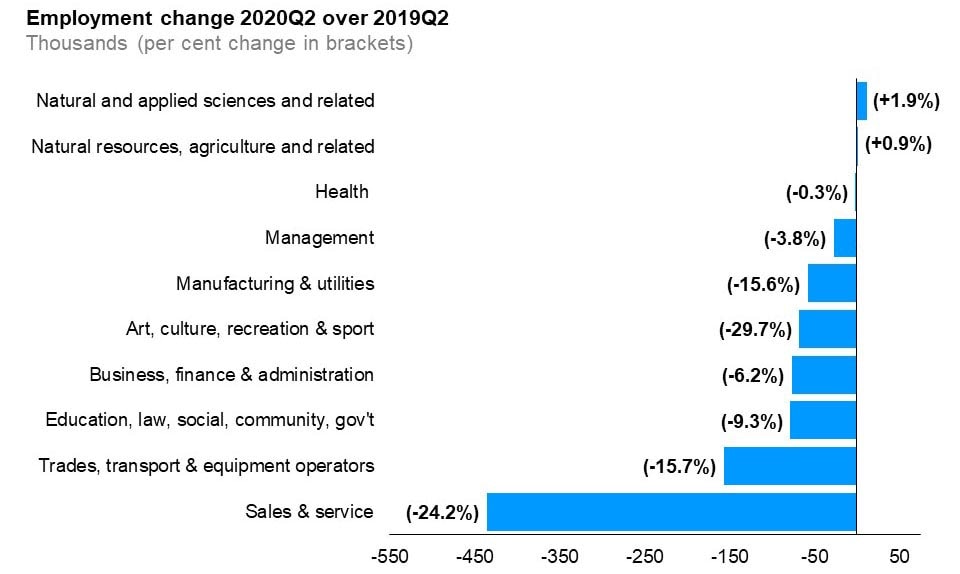
The horizontal bar chart shows a year-over-year (between the second quarters of 2019 and 2020) change in Ontario’s employment by broad occupational group. Natural and applied sciences and related occupations (+1.9%) experienced employment gain followed by natural resources, agriculture and related occupations (+0.9%). Employment in sales and service occupations (-24.2%) and trade, transport and equipment operators occupations (-15.7%) declined the most followed by occupations in education, law and social, community and government services (-9.3%) and business, finance and administration occupations (-6.2%).
Among broad occupational groups, natural and applied sciences and related occupations (+1.9%) and natural resources, agriculture and related occupations (+0.9%) experienced employment gains compared to the second quarter of 2019. Employment in sales and service occupations (-24.2%) and trade, transport and equipment operators occupations (-15.7%) experienced the largest decline followed by occupations in education, law and social, community and governmnet services (-9.3%) and business, finance and administration occupations (-6.2%).
Geographic region
Ontario regions
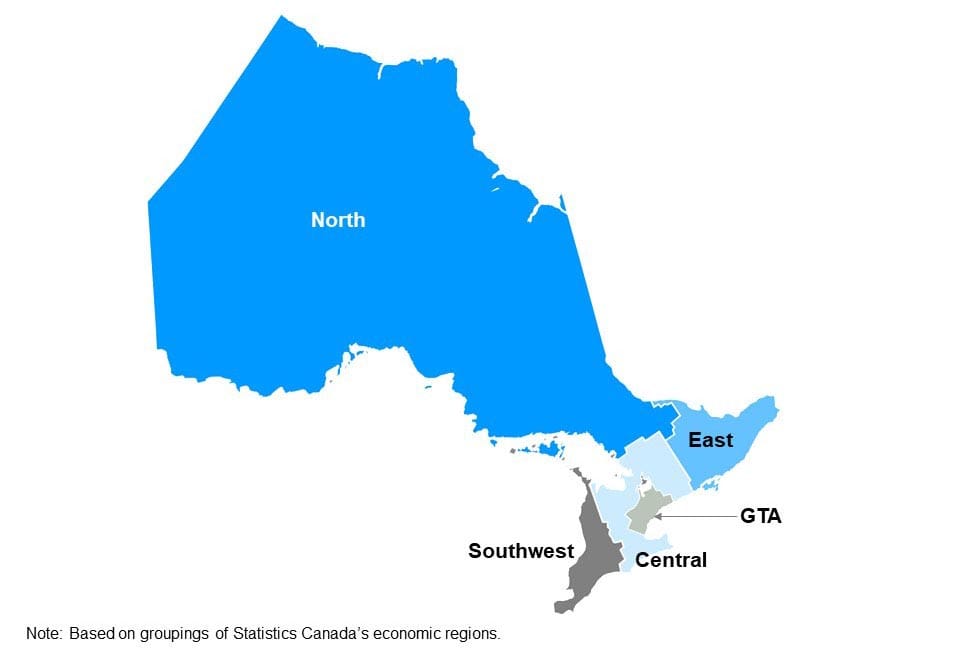
The map shows Ontario’s five regions: Northern Ontario, Eastern Ontario, Southwestern Ontario, Central Ontario and the Greater Toronto Area. This map is based on groupings of Statistics Canada’s economic regions.
Employment change by Ontario region
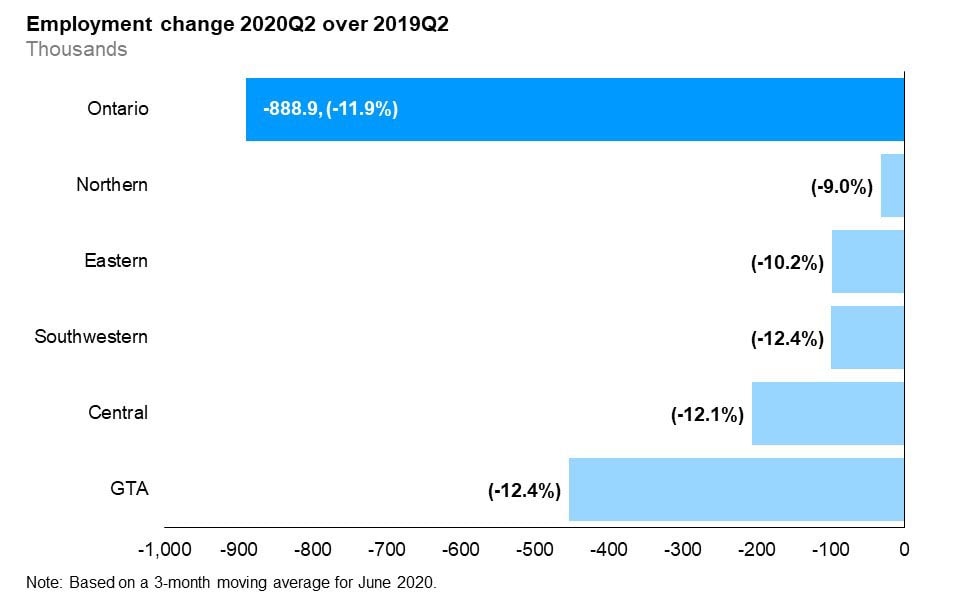
The horizontal bar chart shows a year-over-year (between the second quarters of 2019 and 2020) change in employment in the five Ontario regions: Northern Ontario, Eastern Ontario, Southwestern Ontario, Central Ontario and the Greater Toronto Area (GTA). Employment declined in all Ontario regions over this period. The rate of employment decline was highest in the Greater Toronto Area (GTA) and Southwestern Ontario (-12.4% each) followed by Central Ontario (-12.1%), Eastern Ontario (-10.2%) and Northern Ontario (-9.0%). The overall employment in Ontario declined by 11.9%.
Year-over-year, employment declined across all Ontario regions. The rate of employment decline was the largest in the Greater Toronto Area (GTA)
In June 2020, restrictions related to the COVID-19 pandemic started to ease in parts of the province with some regions able to enter stage 2 of reopening. However, tighter restrictions remained in place in much of southwestern Ontario and Toronto for most of June.
Unemployment rates by Ontario region
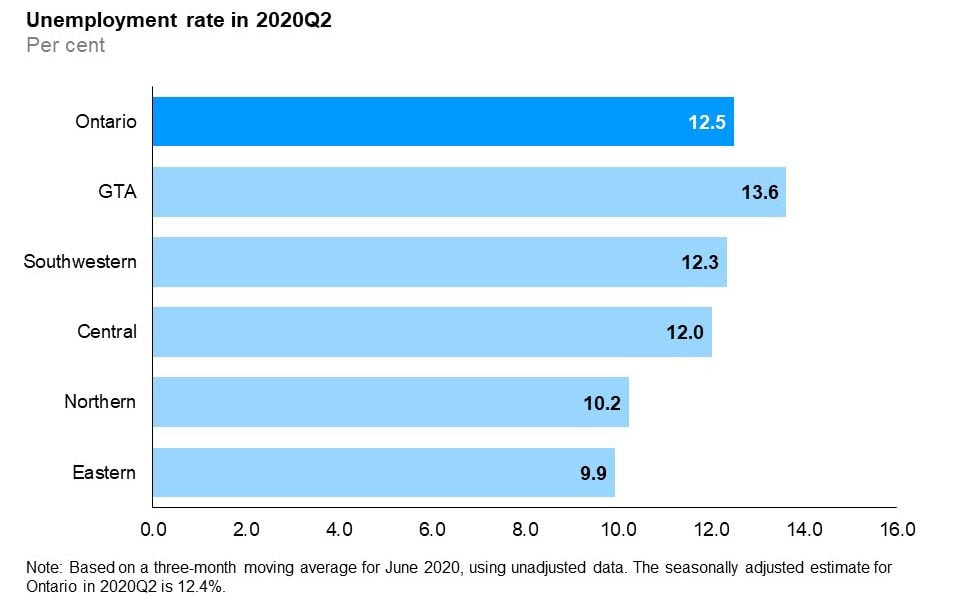
The horizontal bar chart shows unemployment rates by Ontario region in the second quarter of 2020. The unemployment rate increased significantly in all Ontario regions. The Greater Toronto Area had the highest unemployment rate (13.6%) followed by Southwestern Ontario (12.3%) and Central Ontario (12.0%). Northern Ontario (10.2%) and Eastern Ontario (9.9%) had the lowest unemployment rates. The overall unemployment rate for Ontario was 12.5%.
In the second quarter of 2020, the unemployment rate increased in every region. The GTA had the highest unemployment rate (13.6%), while Eastern Ontario had the lowest unemployment rate (9.9%).
Participation rates by Ontario region
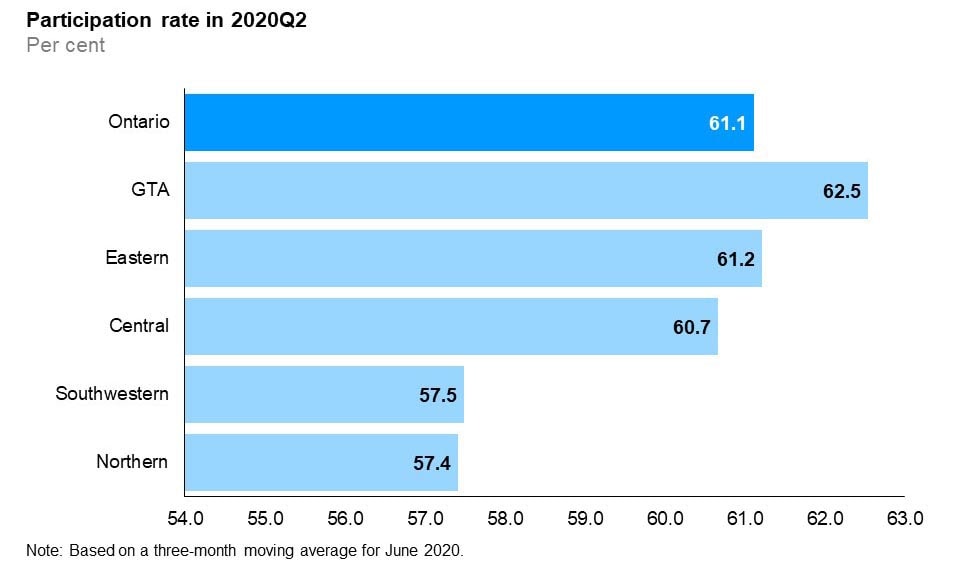
The horizontal bar chart shows participation rates by Ontario region in the second quarter of 2020. The Greater Toronto Area had the highest participation rate at 62.5%, followed by Eastern Ontario (61.2%), Central Ontario (60.7%), Southwestern Ontario (57.5%) and Northern Ontario (57.4%). The overall participation rate for Ontario was 61.1%.
The quarterly labour force participation rate varied among economic regions. In the second quarter of 2020, the participation rate ranged from 57.4% in Northern Ontario to 62.5% in the GTA.
Age and gender quarterly details
Employment change by age appensgroup and gender
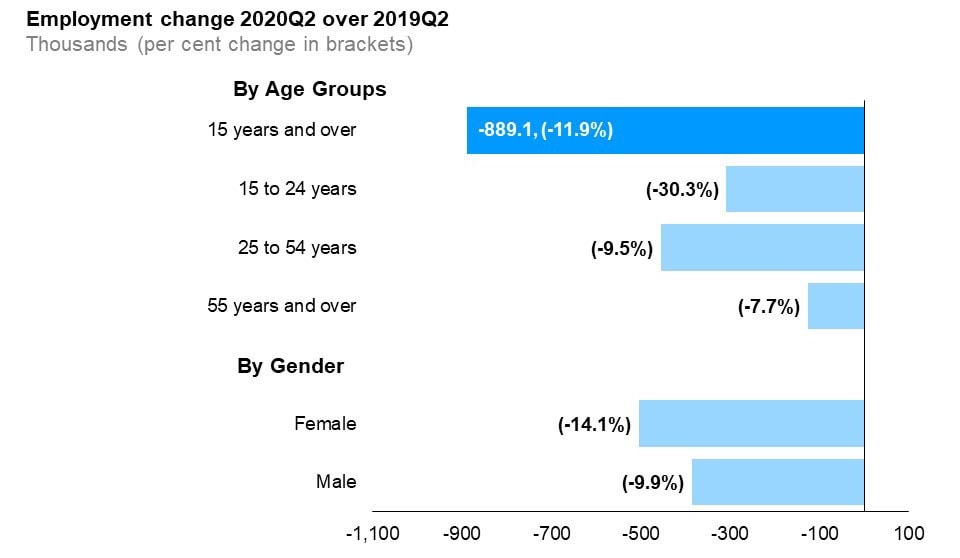
The horizontal bar chart shows a year-over-year (between the second quarters of 2019 and 2020) change in Ontario’s employment for the three major age groups, as well as by gender, compared to the overall population. Employment declined among workers in all age groups. Ontarians aged 15 to 24 years are had the highest number of job losses (-9.5%). Employment for Ontarians aged 15 to 24 years declined by 30.3% and for Ontarians aged 55 years and over declined by 7.7%. Total employment (for population aged 15 and over) declined by 11.9%. Male employment decreased year-over-year by 9.9% and female employment declined by 14.1%.
Compared to the same quarter last year, employment declined among all age groups. Employment among core-aged workers (25 to 54 years) decreased the most by 9.5% followed by youth aged 15 to 24 years (-30.3%) and older workers aged 55 years and over (-7.7%).
Year-over-year, male employment decreased by 9.9% and female employment decreased by 14.1%.
Unemployment rates by age group and gender
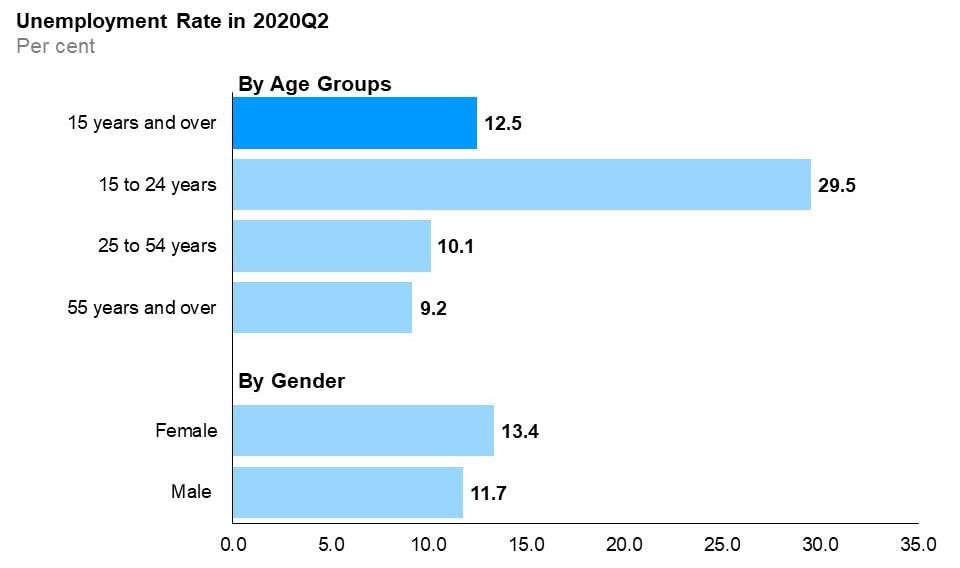
The horizontal bar chart shows unemployment rates for the three major age groups, as well as by gender, compared to the overall rate, in the second quarter of 2020. Youth (15 to 24 years) had the highest unemployment rate at 29.5%, followed by the core-aged population (25 to 54 years) at 10.1% and older Ontarians (55 years and over) at 9.2%. The overall unemployment rate in the second quarter of 2020 was 12.5%. The male unemployment rate was 11.7% and the female unemployment rate was 13.4%.
In the second quarter of 2020, compared to the same time last year, the unemployment rate increased by 6.1 percentage points for males and 7.9 percentage points for females. The unemployment rate for youth (15 to 24 years) increased by 17.0 percentage points to 29.5% and remained the highest among the three age groups. The unemployment rate increased by 5.6 percentage points to 10.1% for core-aged people (25 to 54 years) and by 5.0 percentage points to 9.2% for older people (55 years and over).
Participation rates by age group and gender
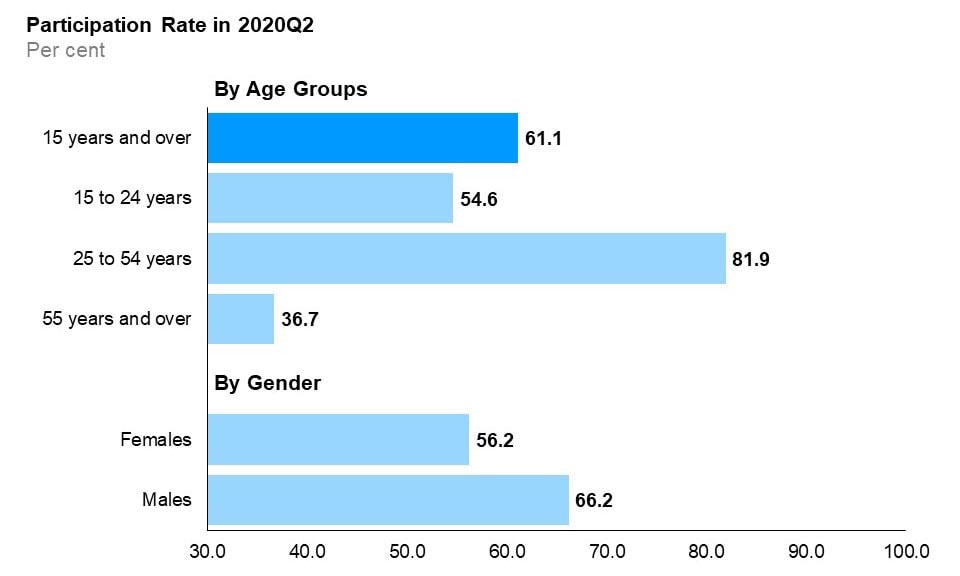
The horizontal bar chart shows labour force participation rates for the three major age groups, as well as by gender, compared to the overall rate, in the second quarter of 2020. The core-aged population (25 to 54 years old) had the highest labour force participation rate at 81.9%, followed by youth (15 to 24 years old) at 54.6%, and older Ontarians (55 years and over) at 36.7%. The overall participation rate was 61.1%. The male participation rate (66.2%) was higher than the female participation rate (56.2%).
In the second quarter of 2020, core-aged people had the highest participation rate at 81.9%, followed by youth (54.6%) and older people (36.7%). Compared to the previous year, the participation rate decreased among all age groups and for both males and females (by 3.8 and 4.8 percentage points, respectively).
Education level and immigrant status quarterly details
Employment rates by education level and immigrant status (core-aged population)
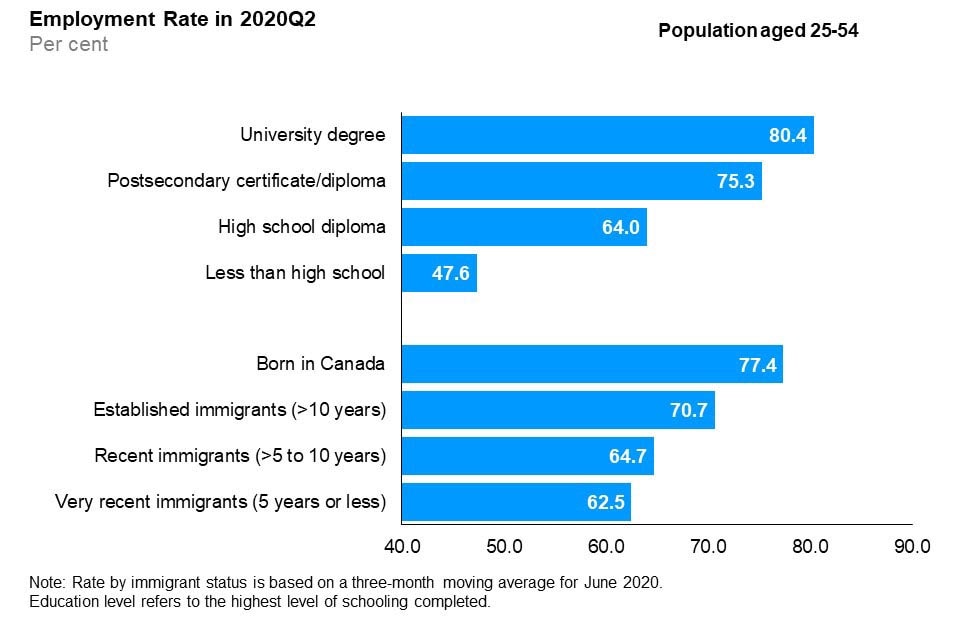
The horizontal bar chart shows employment rates by education level and immigrant status for the core-aged population (25 to 54 years old), in the second quarter of 2020. By education level, those with a university degree had the highest employment rate (80.4%), followed by those with a postsecondary certificate/diploma (75.3%), those with a high school diploma (64.0%), and those with less than high school education (47.6%). By immigrant status, those born in Canada had the highest employment rate (77.4%), followed by established immigrants with more than 10 years since landing (70.7%), recent immigrants with more than 5 to 10 years since landing (64.7%), and very recent immigrants with 5 years or less since landing (62.5%).
In the second quarter of 2020, those with less than a high school diploma continued to have the lowest employment rate (47.6%), while those with a university degree recorded the highest employment rate (80.4%), followed by those with a postsecondary certificate and diploma (75.3%). Year-over-year, those with a postsecondary certificate experienced the sharpest decline in their employment rate.
Those born in Canada recorded the highest employment rate (77.4%), while very recent immigrants continued to have the lowest employment rate (62.5%).
Unemployment rates by education level and immigrant status (core-aged population)
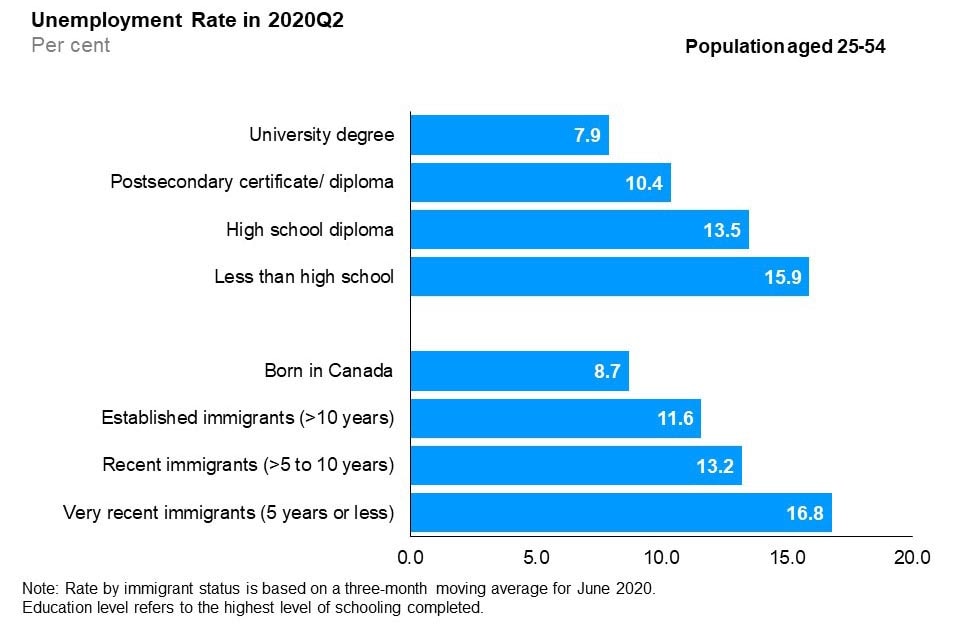
The horizontal bar chart shows unemployment rates by education level and immigrant status for the core-aged population (25 to 54 years old), in the second quarter of 2020. By education level, those with less than high school education had the highest unemployment rate (15.9%), followed by high school graduates (13.5%), those with a postsecondary certificate or diploma (10.4%), and university degree holders (7.9%). By immigrant status, very recent immigrants with 5 years or less since landing had the highest unemployment rate (16.8%), followed by recent immigrants with more than 5 to 10 years since landing (13.2%), established immigrants with more than 10 years since landing (11.6%) and those born in Canada (8.7%).
In the second quarter of 2020, those with a university degree recorded the lowest unemployment rate (7.9%) while those with less than a high school diploma had the highest unemployment rate (15.9%). Year-over-year, the unemployment rate of core-aged people for all education levels increased.
Year-over-year, the unemployment rate increased for all groups by immigrant status. In the second quarter of 2020, those born in Canada recorded the lowest unemployment rate (8.7%), while very recent immigrants had the highest unemployment rate (16.8%).
Participation rates by education level and immigrant status (core-aged population)
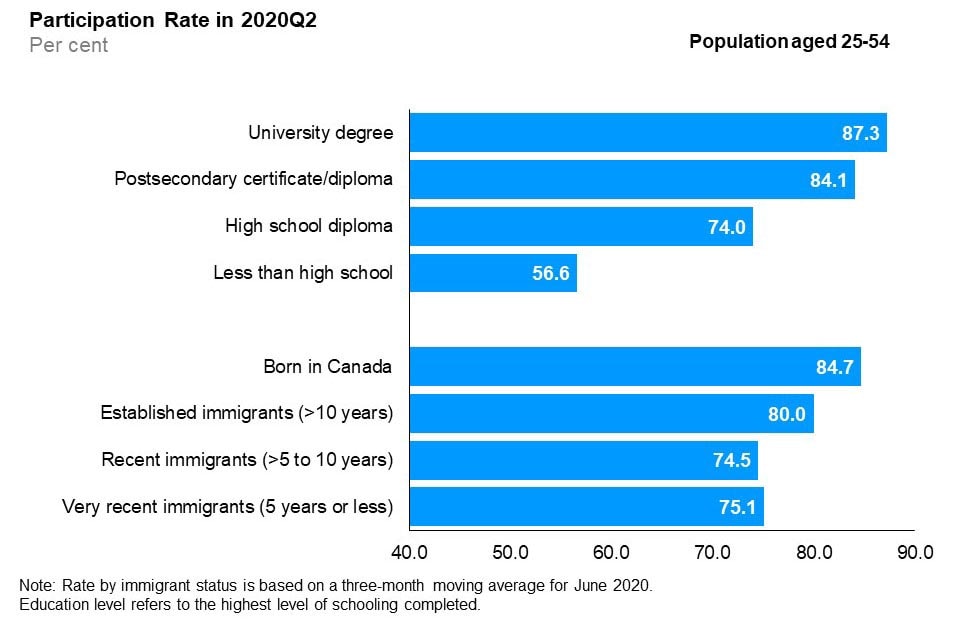
The horizontal bar chart shows labour force participation rates by education level and immigrant status for the core-aged population (25 to 54 years old), in the second quarter of 2020. By education level, university degree holders had the highest participation rate (87.3%), followed by postsecondary certificate or diploma holders (84.1%), high school graduates (74.0%), and those with less than high school education (56.6%). By immigrant status, those born in Canada had the highest participation rate (84.7%), followed by established immigrants with more than 10 years since landing (80.0%), recent immigrants with more than 5 to 10 years since landing (74.5%) and very recent immigrants with 5 years or less since landing (75.1%).
In the second quarter of 2020, those with a university degree continued to record the highest participation rate (87.3%), while those with less than a high school diploma had the lowest participation rate (56.6%). Year-over-year, the participation rate decreased for all education levels.
In the second quarter of 2020, recent immigrants and very recent immigrants continued to have the lowest participation rate compared to established immigrants and those born in Canada. Year-over-year, the participation rate increased for very recent immigrants (+3.2 percentage points) and decreased for established and recent immigrants and those born in Canada.
Wages quarterly details
Average hourly wages by employment status, 1997-2019
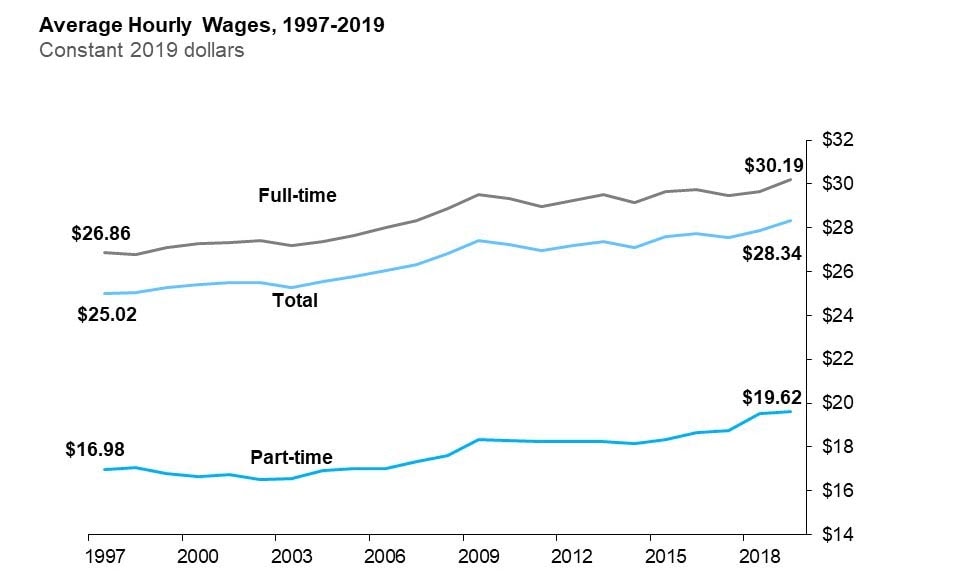
The line chart shows average hourly wages for all employees, full-time and part-time employees expressed in real 2019 dollars from 1997 to 2019. Real average hourly wages of all employees increased from $25.02 in 1997 to $28.34 in 2019; those of full-time employees increased from $26.86 in 1997 to $30.19 in 2019 and those of part-time employees increased from $16.98 in 1997 to $19.62 in 2019.
Over the last two decades, the average hourly wage increased in real terms
Hourly wage growth by type of work
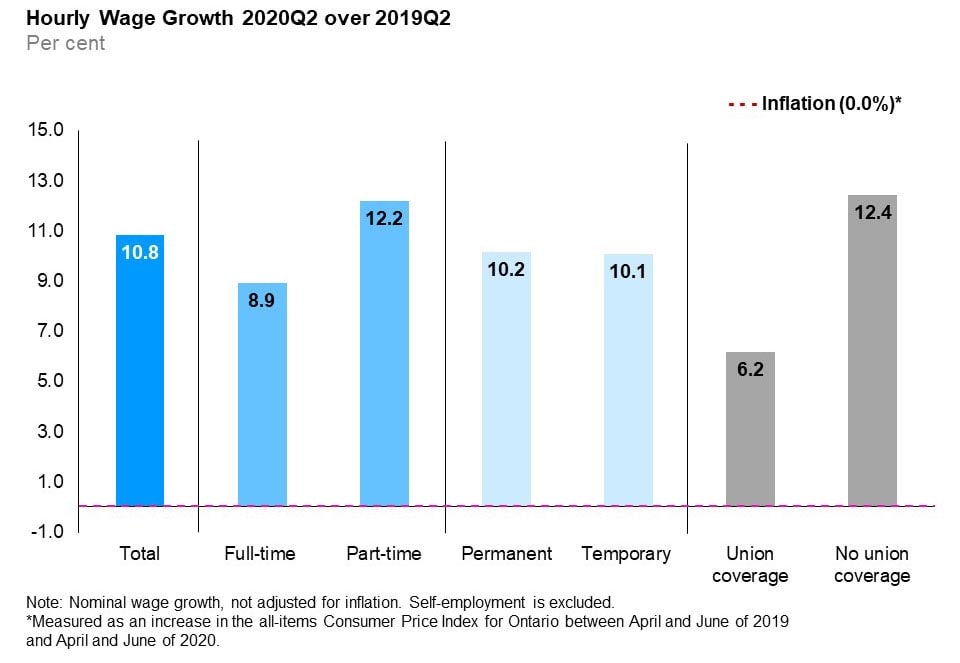
The vertical bar chart shows a year-over-year (between the second quarters of 2019 and 2020) per cent change in Ontario’s nominal hourly wages by type of work. The average hourly wage increased by 10.8%. Hourly wages increased for both full-time (+8.9%) and part-time employees (+12.2%); permanent (+10.2%) and temporary employees (+10.1%) and employees with union coverage (+6.2%) and those without union coverage (+12.4%). Inflation during the same period was 0.0%.
In the second quarter of 2020, the average hourly wage of Ontario employees was $31.31, an increase of 10.8% from the second quarter of 2019.
The increase in average hourly wages can be attributed in part to larger employment declines in relatively low-paying industries, which has resulted in an increase of the overall average hourly wage. In the second quarter of 2020, more than 40% of the year-over-year decline in employment was observed in accommodation and food services and wholesale and retail trade, two of the lowest-paying industries. Meanwhile, employment in certain occupations with higher wage rates increased during the pandemic (e.g. professional occupations in nursing, management occupations, and natural and applied sciences and related occupations)
Consumer Price Index inflation over the same period was 0.0%.
Average hourly wage rate and wage growth by occupational group
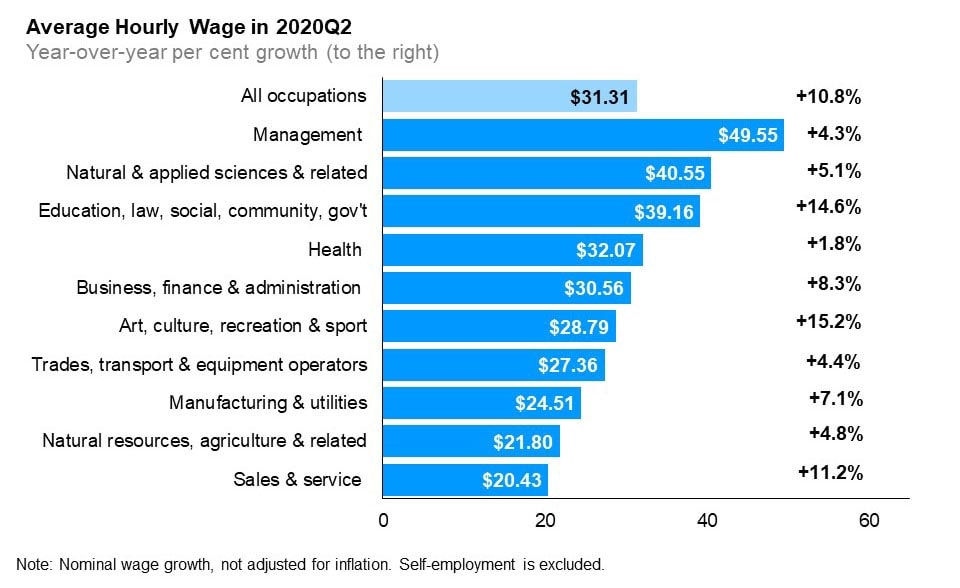
The horizontal bar chart shows average hourly wage rates in the second quarter of 2020 and year-over-year (between the second quarters of 2019 and 2020) wage growth in average hourly wage rate, by occupational group. In the second quarter of 2020, the average hourly wage rate for Ontario was $31.31 (+10.8%). The highest average hourly wage rate was for management occupations at $49.55 (+4.3%); followed by natural and applied sciences and related occupations at $40.55 (+5.1%); and occupations in education, law and social, community and government services at $39.16 (+14.6%). The lowest average hourly wage rate was for sales and service occupations at $20.43 (+11.2%).
Year-over-year, all broad occupational groups experienced growth in average hourly wages. The three broad occupational groups that experienced the highest wage growth were: art, culture, recreation and sport (+15.2%), education, law and social, community and government services (+14.6%), and sales and service (+11.2%).
Appendix I
Employment rebounds in June as COVID-19 restrictions started to ease, but remains below February levels
Beginning in mid-March 2020, a number of travel restrictions, business closures and physical distancing measures were put in place by various levels of government to help contain the spread of COVID-19 and protect the health of Ontarians. As a result of the pandemic, Ontario experienced an unprecedented decline in employment during March.
The second quarter of 2020 included data from April and May, during which employment continued to decline as a result of the COVID-19 pandemic.
The quarter also included data from June 2020, reflecting the early stages of reopening the provincial economy.
Below are highlights (seasonally adjusted) of recent trends and challenges in Ontario’s labour market as a result of the COVID-19 pandemic and the impact of the economy reopening in June.
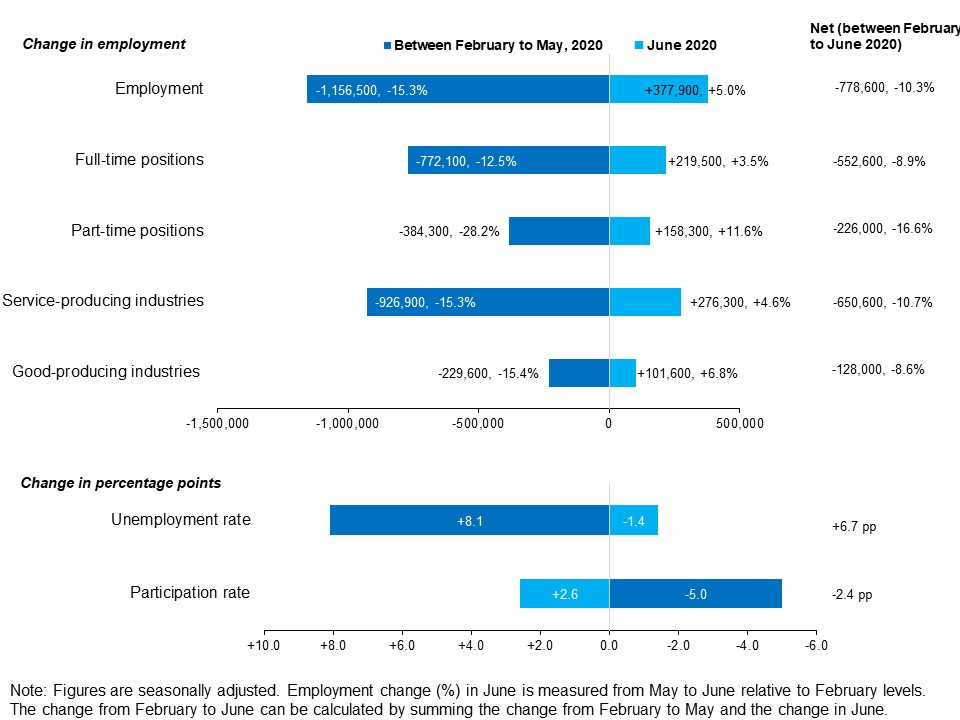
The horizontal bar chart shows seasonally adjusted changes in employment, unemployment rate and participation rate between February to May 2020, in June 2020 and the net change (between February to June 2020).
Between February to May 2020, employment decreased (-1,156,500, -15.3%), as well as full-time positions (-772,100, -12.5%), part-time positions (-384,300, -28.2%), employment in service-producing industries (-926,900, -15.3%) and employment in good-producing industries (-229,600, -15.4%). Unemployment rate increased by 8.1 percentage points while participation rate decreased by 5.0 percentage points.
In June 2020, employment increased (+377,900, +5.0%), as well as full-time positions (+219,500, +3.5%), part-time positions (+158,300, +11.6%), employment in service-producing industries (+276,300, +4.6%) and employment in good-producing industries (+101,600, +6.8%). Unemployment rate decreased by 1.4 percentage points while participation rate increased by 2.6 percentage points.
Between February to June 2020, employment decreased (-778,600, -10.3%), as well as full-time positions (-552,600, -8.9%), part-time positions (-226,000, -16.6%), employment in service-producing industries (-650,600, -10.7%) and employment in good-producing industries (-128,000, -8.6%). Unemployment rate increased by 6.7 percentage points while participation rate decreased by 2.4 percentage points.
Appendix II
Overview of annual employment ten-year review
| 2010 | 2011 | 2012 | 2013 | 2014 | 2015 | 2016 | 2017 | 2018 | 2019 | |
|---|---|---|---|---|---|---|---|---|---|---|
| Total Labour Force (000) | 7,160.9 | 7,227.4 | 7,276.4 | 7,383.8 | 7,418.6 | 7,426.1 | 7,489.5 | 7,579.8 | 7,673.0 | 7,890.6 |
| Participation Rate (%) | 66.8 | 66.6 | 66.2 | 66.3 | 65.8 | 65.2 | 65.0 | 64.9 | 64.5 | 65.1 |
| Male Participation Rate (%) | 71.1 | 71.1 | 70.7 | 70.5 | 70.3 | 70 | 69.5 | 69.2 | 68.7 | 69.6 |
| Female Participation Rate (%) | 62.8 | 62.3 | 61.9 | 62.2 | 61.6 | 60.7 | 60.7 | 60.7 | 60.5 | 60.7 |
| Total Employment (000) | 6,537.8 | 6,658.4 | 6,702.6 | 6,823.4 | 6,877.9 | 6,923.2 | 6,999.6 | 7,128.0 | 7,242.4 | 7,452.6 |
| - Full-time (000) | 5,256.1 | 5,373.5 | 5,412.0 | 5,489.5 | 5,540.0 | 5,618.2 | 5,672.6 | 5,778.7 | 5,909.0 | 6,065.8 |
| - Part-time (000) | 1,281.8 | 1,284.8 | 1,290.6 | 1,334.0 | 1,337.9 | 1,305.0 | 1,327.0 | 1,349.3 | 1,333.4 | 1,386.8 |
| Employment-Population Ratio (%) | 61.0 | 61.4 | 60.9 | 61.2 | 61.0 | 60.8 | 60.7 | 61.0 | 60.9 | 61.4 |
| Male Employment (000) | 3,363.6 | 3,450.4 | 3,471.5 | 3,522.8 | 3,567.1 | 3,607.1 | 3,635.9 | 3,700.9 | 3,763.9 | 3,894.7 |
| Female Employment (000) | 3,174.2 | 3,207.9 | 3,231.1 | 3,300.6 | 3,310.8 | 3,316.1 | 3,363.7 | 3,427.1 | 3,478.5 | 3,557.9 |
| Part-Time (% of total) | 19.6 | 19.3 | 19.3 | 19.6 | 19.5 | 18.8 | 19.0 | 18.9 | 18.4 | 18.6 |
| Goods-Producing Sector Employment (000) | 1,380.6 | 1,408.7 | 1,415.3 | 1,397.5 | 1,382.0 | 1,401.4 | 1,418.1 | 1,432.6 | 1,453.1 | 1,467.8 |
| Services-Producing Sector Employment (000) | 5,157.3 | 5,249.7 | 5,287.3 | 5,425.9 | 5,495.9 | 5,521.7 | 5,581.4 | 5,695.4 | 5,789.2 | 5,984.8 |
| Private Sector Employment (000) | 4,268.2 | 4,339.7 | 4,373.0 | 4,447.0 | 4,517.0 | 4,540.7 | 4,597.3 | 4,690.6 | 4,740.6 | 4,863.4 |
| Public Sector Employment (000) | 1,254.7 | 1,294.3 | 1,286.0 | 1,314.0 | 1,305.4 | 1,294.1 | 1,306.4 | 1,329.1 | 1,376.7 | 1,385.9 |
| Self-Employment (% of total) | 15.5 | 15.4 | 15.6 | 15.6 | 15.3 | 15.7 | 15.7 | 15.5 | 15.5 | 16.1 |
| Total Unemployment (000) | 623.1 | 569.1 | 573.8 | 560.3 | 540.7 | 502.9 | 489.9 | 451.8 | 430.7 | 438.0 |
| Unemployment Rate (%) | 8.7 | 7.9 | 7.9 | 7.6 | 7.3 | 6.8 | 6.5 | 6.0 | 5.6 | 5.6 |
| Male Unemployment Rate (%) | 9.4 | 8.2 | 8.3 | 8.0 | 7.5 | 7 | 6.8 | 6.2 | 5.6 | 5.7 |
| Female Unemployment Rate (%) | 8.0 | 7.6 | 7.5 | 7.2 | 7.1 | 6.5 | 6.3 | 5.7 | 5.6 | 5.4 |
| Long-Term (27 wks+) (% of total) | 24.9 | 24.1 | 22.7 | 22.9 | 22.8 | 20.0 | 19.9 | 19.5 | 16.9 | 15.1 |
| Average Unemployment in Weeks | 22.0 | 22.4 | 22.2 | 21.8 | 22.4 | 20.0 | 19.9 | 19.3 | 17.2 | 15.9 |
| Youth Unemployment Rate (%) | 17.4 | 15.9 | 17.0 | 16.2 | 15.7 | 14.7 | 14.0 | 12.3 | 11.9 | 12.1 |
| 25-54 y.o. Unemployment rate (%) | 7.3 | 6.5 | 6.4 | 6.2 | 5.9 | 5.6 | 5.4 | 5.0 | 4.7 | 4.6 |
| 55+ y.o. Unemployment rate (%) | 6.4 | 6.0 | 5.8 | 5.5 | 5.3 | 4.9 | 4.9 | 4.5 | 4.2 | 4.1 |
| Average Weekly Wage Rate ($) | 842.35 | 862.45 | 883.12 | 895.56 | 907.17 | 938.09 | 958.5 | 967.44 | 1,001.74 | 1,036.51 |
| Average Hourly Wage Rate ($) | 23.09 | 23.55 | 24.09 | 24.48 | 24.82 | 25.59 | 26.15 | 26.43 | 27.36 | 28.34 |
Employment by region (000)
| 2010 | 2011 | 2012 | 2013 | 2014 | 2015 | 2016 | 2017 | 2018 | 2019 | |
|---|---|---|---|---|---|---|---|---|---|---|
| Greater Toronto Area | 3,034.6 | 3,077.8 | 3,112.3 | 3,240.2 | 3,241.1 | 3,320.4 | 3,373.2 | 3,442.9 | 3,521.6 | 3,652.9 |
| Central | 1,508.1 | 1,552.0 | 1,551.4 | 1,559.5 | 1,597.2 | 1,597.5 | 1,598.0 | 1,655.2 | 1,656.9 | 1,690.8 |
| Southwestern | 761.7 | 771.1 | 772.9 | 769.4 | 775.0 | 770.5 | 775.8 | 778.4 | 794.3 | 793.5 |
| Eastern | 879.6 | 897.0 | 908.7 | 898.4 | 907.9 | 889.2 | 904.9 | 903.4 | 916.0 | 963.6 |
| Northern | 354.0 | 360.4 | 357.3 | 355.9 | 356.6 | 345.5 | 347.7 | 348.2 | 353.6 | 351.9 |
Unemployment rate by region (%)
| 2010 | 2011 | 2012 | 2013 | 2014 | 2015 | 2016 | 2017 | 2018 | 2019 | |
|---|---|---|---|---|---|---|---|---|---|---|
| Greater Toronto Area | 9.2 | 8.4 | 8.8 | 8.2 | 8.0 | 7.1 | 6.9 | 6.4 | 6.1 | 5.9 |
| Central | 8.4 | 7.4 | 7.0 | 6.9 | 6.2 | 5.9 | 5.9 | 5.3 | 5.2 | 5.1 |
| Southwestern | 9.1 | 8.1 | 7.8 | 7.7 | 7.0 | 6.9 | 6.1 | 5.6 | 5.2 | 5.5 |
| Eastern | 7.2 | 6.7 | 6.6 | 6.6 | 7.0 | 6.7 | 6.4 | 5.7 | 4.9 | 4.9 |
| Northern | 8.3 | 7.8 | 7.2 | 7.4 | 6.6 | 7.2 | 7.1 | 6.4 | 5.8 | 6.0 |
Total employment by CMA (000)
Greater Toronto Area
| 2010 | 2011 | 2012 | 2013 | 2014 | 2015 | 2016 | 2017 | 2018 | 2019 | |
|---|---|---|---|---|---|---|---|---|---|---|
| Toronto | 2,880.3 | 2,923.4 | 2,960.6 | 3,092.1 | 3,087.4 | 3,176.7 | 3,215.0 | 3,289.6 | 3,353.0 | 3,491.5 |
| Oshawa | 184.3 | 189.0 | 190.0 | 194.5 | 201.4 | 196.4 | 214.0 | 210.4 | 220.6 | 218.6 |
Central Ontario
| 2010 | 2011 | 2012 | 2013 | 2014 | 2015 | 2016 | 2017 | 2018 | 2019 | |
|---|---|---|---|---|---|---|---|---|---|---|
| Hamilton | 369.1 | 375.1 | 376.6 | 374.8 | 383.7 | 385.4 | 385.8 | 417.9 | 413.8 | 422.8 |
| Kitchener | 258.1 | 270.5 | 271.6 | 278.9 | 283.1 | 279.8 | 281.6 | 287.8 | 292.2 | 302.1 |
| St. Catharines-Niagara | 190.4 | 196.1 | 201.8 | 193.5 | 195.4 | 204.1 | 203.1 | 197.6 | 201.7 | 199.6 |
| Peterborough | 56.6 | 57.6 | 58.5 | 54.9 | 60.5 | 61.2 | 59.5 | 61.2 | 63.6 | 61.1 |
| Brantford | 67.4 | 68.5 | 67.5 | 68.9 | 68.6 | 69.3 | 70.2 | 72.3 | 70.0 | 78.7 |
| Guelph | 79.2 | 82.0 | 83.9 | 79.8 | 81.8 | 90.5 | 90.6 | 90.8 | 88.8 | 92.6 |
| Barrie | 99.1 | 101.5 | 102.3 | 109.4 | 111.6 | 108.4 | 104.2 | 115.6 | 114.6 | 119.2 |
Eastern Ontario
| 2010 | 2011 | 2012 | 2013 | 2014 | 2015 | 2016 | 2017 | 2018 | 2019 | |
|---|---|---|---|---|---|---|---|---|---|---|
| Ottawa | 515.3 | 517.4 | 535.4 | 523.5 | 533.8 | 531.1 | 543.4 | 546.7 | 557.6 | 590.1 |
| Kingston | 76.7 | 79.3 | 80.6 | 82.6 | 81.4 | 82.9 | 83.6 | 87.3 | 86.4 | 87.5 |
Southwestern Ontario
| 2010 | 2011 | 2012 | 2013 | 2014 | 2015 | 2016 | 2017 | 2018 | 2019 | |
|---|---|---|---|---|---|---|---|---|---|---|
| London | 239.6 | 237.7 | 242.3 | 240.4 | 243.0 | 252.0 | 245.9 | 245.8 | 252.9 | 251.2 |
| Windsor | 147.5 | 147.9 | 153.3 | 154.8 | 155.2 | 158.0 | 164.1 | 162.8 | 164.5 | 170.4 |
Northern Ontario
| 2010 | 2011 | 2012 | 2013 | 2014 | 2015 | 2016 | 2017 | 2018 | 2019 | |
|---|---|---|---|---|---|---|---|---|---|---|
| Sudbury | 80.7 | 82.1 | 80.8 | 83.3 | 83.1 | 82.3 | 81.7 | 81.1 | 81.4 | 85.2 |
| Thunder Bay | 60.2 | 60.3 | 61.8 | 62.8 | 61.5 | 59.7 | 60.1 | 61.5 | 63.7 | 61.7 |
Overview of quarterly employment year-over-year
| 2018q3 | 2019q3 | 2018q4 | 2019q4 | 2019q1 | 2020q1 | 2019q2 | 2020q2 | |
|---|---|---|---|---|---|---|---|---|
| Total Labour Force (000) | 7,782.4 | 8,002.8 | 7,682.1 | 7,917.9 | 7,728.0 | 7,804.0 | 7,913.8 | 7,523.2 |
| Participation Rate (%) | 65.2 | 65.8 | 64.1 | 64.8 | 64.2 | 63.6 | 65.4 | 61.1 |
| Male Participation Rate (%) | 69.6 | 70.8 | 68.4 | 69.0 | 68.6 | 68.0 | 70.0 | 66.2 |
| Female Participation Rate (%) | 61.1 | 61.0 | 60.0 | 60.7 | 60.0 | 59.3 | 61.0 | 56.2 |
| Total Employment (000) | 7,315.2 | 7,535.0 | 7,302.7 | 7,535.2 | 7,268.2 | 7,317.0 | 7,472.1 | 6,583.0 |
| - Full-time (000) | 6,049.1 | 6,218.9 | 5,909.0 | 6,089.8 | 5,858.2 | 5,955.2 | 6096.2 | 5569.6 |
| - Part-time (000) | 1,266.0 | 1,316.1 | 1,393.7 | 1,445.4 | 1,409.9 | 1,361.8 | 1375.9 | 1013.4 |
| Employment-Population Ratio (%) | 61.3 | 61.9 | 60.9 | 61.6 | 60.4 | 59.6 | 61.8 | 53.5 |
| Male Employment (000) | 3,833.8 | 3,982.6 | 3,794.3 | 3,919.1 | 3,771.2 | 3,827.7 | 3,906.0 | 3520.9 |
| Female Employment (000) | 3,481.3 | 3,552.4 | 3,508.4 | 3,616.1 | 3,497.0 | 3,489.3 | 3,566.1 | 3062.1 |
| Part-Time (% of total) | 17.3 | 17.5 | 19.1 | 19.2 | 19.4 | 18.6 | 18.4 | 15.4 |
| Goods-Producing Sector Employment (000) | 1,491.0 | 1,512.0 | 1,463.0 | 1,474.2 | 1,411.0 | 1,422.8 | 1,474.0 | 1,296.4 |
| Services-Producing Sector Employment (000) | 5,824.2 | 6,023.0 | 5,839.7 | 6,061.0 | 5,857.2 | 5,894.1 | 5,998.1 | 5,286.6 |
| Private Sector Employment (000) | 4,810.7 | 4,944.3 | 4,774.8 | 4,885.3 | 4,751.6 | 4,729.6 | 4872.6 | 4101.4 |
| Public Sector Employment (000) | 1,373.5 | 1,350.5 | 1,385.1 | 1,435.4 | 1,368.5 | 1,413.3 | 1389.3 | 1330.7 |
| Self-Employment (% of total) | 15.5 | 16.5 | 15.6 | 16.1 | 15.8 | 16.0 | 16.2 | 17.5 |
| Total Unemployment (000) | 467.2 | 467.8 | 379.4 | 382.7 | 459.8 | 487.0 | 441.7 | 940.2 |
| Unemployment Rate (%) | 6.0 | 5.8 | 4.9 | 4.8 | 5.9 | 6.2 | 5.6 | 12.5 |
| Male Unemployment Rate (%) | 5.5 | 5.4 | 5.2 | 5.0 | 6.6 | 6.3 | 5.7 | 11.7 |
| Female Unemployment Rate (%) | 6.6 | 6.3 | 4.6 | 4.6 | 5.3 | 6.2 | 5.5 | 13.4 |
| Long-Term (27 wks+) (% of total) | 16.9 | 13.8 | 17.3 | 16.4 | 16.0 | 14.3 | 14.4 | 6.9 |
| Average Unemployment in Weeks | 16.8 | 14.1 | 17.5 | 17.6 | 16.6 | 15.4 | 15.5 | 11.8 |
| Youth Unemployment Rate (%) | 12.1 | 12.7 | 10.8 | 10.5 | 12.4 | 12.3 | 12.5 | 29.5 |
| 25-54 y.o. Unemployment rate (%) | 5.2 | 4.8 | 4.2 | 4.1 | 5.0 | 5.5 | 4.5 | 10.1 |
| 55+ y.o. Unemployment rate (%) | 4.1 | 4.1 | 3.5 | 3.4 | 4.9 | 4.8 | 4.2 | 9.2 |
| Average Weekly Wage Rate ($) | 1,004.2 | 1,048.3 | 1,000.7 | 1,047.6 | 1,014.3 | 1,074.9 | 1,035.1 | 1,162.4 |
| Average Hourly Wage Rate ($) | 27.3 | 28.5 | 27.5 | 28.7 | 27.9 | 29.4 | 28.3 | 31.3 |
Employment by Region (000)
| 2018q3 | 2019q3 | 2018q4 | 2019q4 | 2019q1 | 2020q1 | 2019q2 | 2020q2 | |
|---|---|---|---|---|---|---|---|---|
| Greater Toronto Area (GTA) | 3,535.7 | 3,704.3 | 3,545.4 | 3,684.9 | 3,563.5 | 3,603.6 | 3659.1 | 3205.7 |
| Central | 1,686.1 | 1,698.7 | 1,696.3 | 1,714.2 | 1,650.7 | 1,665.2 | 1699.4 | 1493.1 |
| Southwestern | 810.3 | 798.0 | 790.3 | 806.7 | 772.4 | 778.4 | 797.0 | 697.8 |
| Eastern | 917.9 | 979.3 | 916.1 | 980.5 | 931.6 | 927.6 | 962.8 | 864.6 |
| Northern | 365.4 | 354.8 | 354.5 | 348.8 | 350.0 | 342.0 | 353.8 | 322.0 |
Unemployment Rate by Region (%)
| 2018q3 | 2019q3 | 2018q4 | 2019q4 | 2019q1 | 2020q1 | 2019q2 | 2020q2 | |
|---|---|---|---|---|---|---|---|---|
| Greater Toronto Area (GTA) | 6.6 | 6.2 | 5.5 | 5.0 | 6.4 | 6.2 | 5.9 | 13.6 |
| Central | 5.5 | 5.5 | 4.1 | 4.7 | 5.2 | 6.4 | 5.1 | 12.0 |
| Southwestern | 5.5 | 6.2 | 4.4 | 4.7 | 6.1 | 7.0 | 4.8 | 12.3 |
| Eastern | 5.1 | 5.0 | 4.6 | 4.2 | 5.2 | 5.5 | 5.2 | 9.9 |
| Northern | 5.5 | 5.7 | 5.5 | 5.2 | 6.1 | 6.3 | 6.8 | 10.2 |
Total Employment by CMA (000)
Greater Toronto Area
| 2018q3 | 2019q3 | 2018q4 | 2019q4 | 2019q1 | 2020q1 | 2019q2 | 2020q2 | |
|---|---|---|---|---|---|---|---|---|
| Toronto | 3,361.9 | 3,545.3 | 3,380.9 | 3,534.9 | 3,393.6 | 3,454.3 | 3,492.2 | 3,040.0 |
| Oshawa | 222.4 | 214.8 | 219.5 | 209.7 | 222.9 | 214.5 | 227.0 | 200.6 |
Central Ontario
| 2018q3 | 2019q3 | 2018q4 | 2019q4 | 2019q1 | 2020q1 | 2019q2 | 2020q2 | |
|---|---|---|---|---|---|---|---|---|
| Hamilton | 412.4 | 423.1 | 420.7 | 437.6 | 415.1 | 417.0 | 415.4 | 368.4 |
| Kitchener | 303.1 | 303.4 | 302.3 | 303.3 | 295.6 | 302.0 | 306.3 | 260.2 |
| St. Catharines-Niagara | 205.1 | 203.1 | 201.8 | 206.8 | 192.4 | 188.2 | 196.0 | 169.8 |
| Peterborough | 66.3 | 60.7 | 66.5 | 59.2 | 62.2 | 52.7 | 62.3 | 49.7 |
| Brantford | 68.9 | 80.7 | 71.8 | 77.8 | 75.5 | 71.6 | 80.9 | 69.0 |
| Guelph | 88.6 | 91.8 | 92.9 | 89.0 | 94.4 | 88.2 | 95.3 | 82.7 |
| Barrie | 120.9 | 119.2 | 119.1 | 125.0 | 114.9 | 124.8 | 117.9 | 116.2 |
Eastern Ontario
| 2018q3 | 2019q3 | 2018q4 | 2019q4 | 2019q1 | 2020q1 | 2019q2 | 2020q2 | |
|---|---|---|---|---|---|---|---|---|
| Ottawa (Ontario part) | 557.3 | 606.2 | 553.7 | 614.1 | 564.9 | 572.3 | 575.2 | 533.7 |
| Kingston | 87.9 | 87.5 | 85.1 | 85.3 | 86.1 | 84.0 | 91.2 | 78.0 |
Southwestern Ontario
| 2018q3 | 2019q3 | 2018q4 | 2019q4 | 2019q1 | 2020q1 | 2019q2 | 2020q2 | |
|---|---|---|---|---|---|---|---|---|
| London | 260.3 | 251.9 | 247.8 | 261.5 | 246.5 | 260.3 | 244.9 | 232.3 |
| Windsor | 163.7 | 168.6 | 169.1 | 167.2 | 171.5 | 158.5 | 174.4 | 137.6 |
Northern Ontario
| 2018q3 | 2019q3 | 2018q4 | 2019q4 | 2019q1 | 2020q1 | 2019q2 | 2020q2 | |
|---|---|---|---|---|---|---|---|---|
| Sudbury | 82.2 | 85.0 | 84.6 | 85.0 | 84.9 | 81.9 | 85.8 | 74.1 |
| Thunder Bay | 65.3 | 62.6 | 61.7 | 62.3 | 59.8 | 59.7 | 62.3 | 53.3 |
Overview of monthly* labour force characteristics
| Jun-19 | Jul-19 | Aug-19 | Sep-19 | Oct-19 | Nov-19 | Dec-19 | Jan-20 | Feb-20 | Mar-20 | Apr-20 | May-20 | Jun-20 | |
|---|---|---|---|---|---|---|---|---|---|---|---|---|---|
| Employment | 7433.2 | 7430.3 | 7485.4 | 7519.3 | 7507.4 | 7525.3 | 7542.4 | 7558.3 | 7555.1 | 7,152.3 | 6,463.1 | 6,398.6 | 6,776.5 |
| Unemployment rate | 5.5 | 5.7 | 5.6 | 5.3 | 5.3 | 5.5 | 5.3 | 5.2 | 5.5 | 7.6 | 11.3 | 13.6 | 12.2 |
| Participation rate | 64.9 | 64.9 | 65.2 | 65.1 | 65.0 | 65.2 | 65.1 | 65.1 | 65.1 | 63.0 | 59.2 | 60.1 | 62.7 |
*Seasonally adjusted
Note: All estimates in this appendix are based on Statistics Canada’s Labour Force Survey.
Footnotes
- footnote[1] Back to paragraph On June 12, 24 public health units in Ontario entered Stage 2 of the government's reopening framework. During this stage, more businesses and services were permitted to open, as well as community, recreational and outdoor spaces. However, tighter restrictions remained in place in another 7 health public health units until June 19, in Toronto and Peel regions until June 24 and in Leamington and Kingsville until July 7. For more information on the reopening stages, please see: https://news.ontario.ca/opo/en/2020/06/ontario-permits-more-businesses-and-services-to-reopen-in-the-coming-days.html and https://news.ontario.ca/opo/en/2020/06/more-people-can-get-back-to-work-as-additional-businesses-and-services-to-reopen-this-week.html and https://news.ontario.ca/opo/en/2020/06/ontario-moving-toronto-and-peel-region-into-stage-2.html.
- footnote[2] Back to paragraph In most provinces, COVID-19 restrictions were eased before the LFS reference week in May 2020, with the exception of Ontario, Nova Scotia and Alberta. On May 19, stage 1 of reopening began for all Ontario. By the LFS reference week in June, most provinces had further eased COVID-19 restrictions. Ontario took a regional approach to stages 2 and 3 of reopening starting June 12. The easing of some COVID-19 restrictions was delayed in some regions, including Toronto.
- footnote[3] Back to paragraph This economic region closely matches the GTA, the main exception being that it excludes the city of Burlington.
- footnote[4] Back to paragraph Real wages are based on nominal wages deflated by the Consumer Price Index (CPI) for all items. Self-employment is excluded.
- footnote[5] Back to paragraph Year-over-year comparison (between second quarters of 2019 and 2020) is in nominal dollars.
- footnote[6] Back to paragraph Between March and June, 2020. Employment figures are not adjusted for seasonality.
- footnote[7] Back to paragraph On April 25, 2020 the government provided frontline staff with a temporary pandemic payment, consisting of $4.00 per hour worked on top of existing hourly wages and a monthly lump sum payment of $250 per month for employees working over 100 hours per month. Total usual hours (main job) for certain occupations also increased, which potentially provided an overtime premium for those working above a certain number of hours per week.
- footnote[8] Back to paragraph Measured as an increase in the all-items Consumer Price Index for Ontario between April and June of 2019 and April and June of 2020.