July to September, 2019
Introduction
About the Ontario Employment Report
The Ontario Employment Report is released four times a year and provides an assessment of the current trends and developments in the Ontario labour market. The Ontario Employment Report is a companion report to the Ontario Economic Accounts, which provides an overall assessment of the current state of the Ontario economy. All estimates in this report are based on Statistics Canada’s Labour Force Survey.
Methodological note
In the current issue, year-over-year change represents change between the averages in the third quarter of 2018 and the third quarter of 2019. Note that the Ontario Economic Accounts report primarily shows changes between the previous and the current quarter.
This report uses seasonally adjusted data in charts displaying data with a monthly frequency in the Overview section.
Unadjusted data is used in charts and tables showing the changes for the current quarter compared with the same quarter for the previous year. Unadjusted data is also used to calculate annual averages, year-to-date averages and 2019 third quarter averages.
Overview
Ontario’s labour market overview
Employment:
+219,800 net new jobs year-over-year
+169,800 full-time jobs year-over-year
Unemployment rate:
5.8% in the third quarter of 2019
Year-over-year, Ontario’s employment grew by 3.0% (219,800), higher than the Canadian rate of 2.3%.
Ontario’s unemployment rate was 5.8% in the third quarter of 2019, the same as the Canadian rate.
Year-over-year overview
Ontario’s labour market, 2008-2019
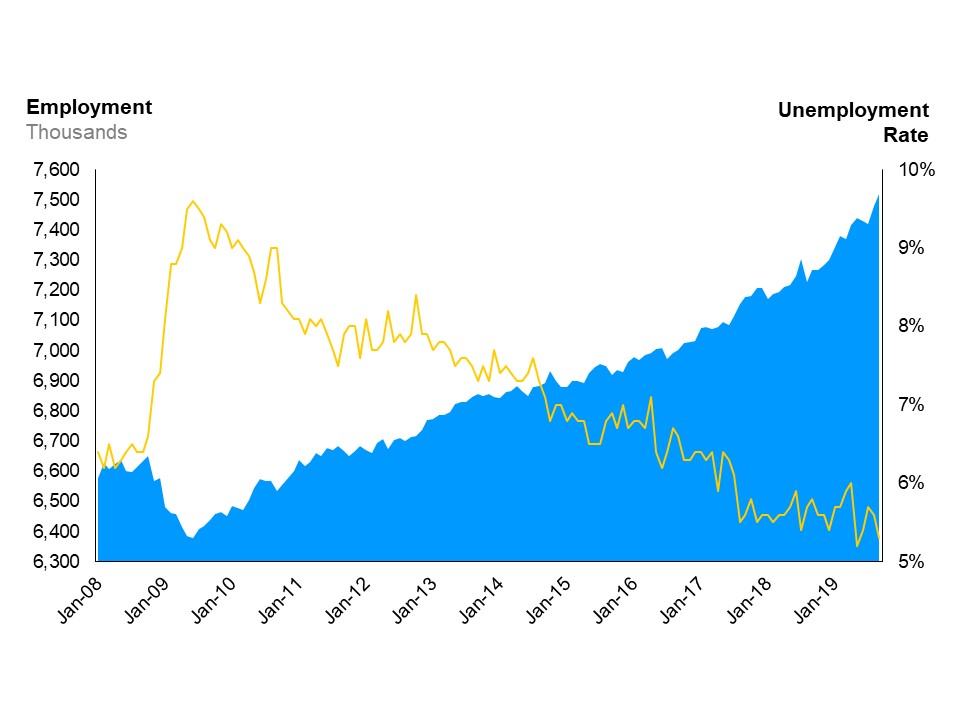
The combination line and area chart shows Ontario’s unemployment rate (line chart) and employment (area chart) from January 2008 to September 2019. Ontario’s unemployment rate has trended downwards since the recession, reaching 5.3% in September 2019. Employment in Ontario has risen steadily since the recession, reaching just over 7.5 million workers in September 2019, putting it well over the pre-recession level of roughly 6.6 million.
Between the third quarter of 2018 and 2019:
- employment growth was driven by increases in full-time employment (+2.8%) and part-time employment (+4.0%)
- gains were concentrated in private sector employment (+2.8%) and self-employment (+9.7%), while public sector employment slightly declined (-1.7%)
- there were significant employment gains in the services-producing sector (+3.4%), as well as solid employment gains in the goods-producing sector (+1.4%)
- three of the five Ontario regions posted employment gains with Eastern Ontario experiencing the fastest employment growth (+6.7%)
- older workers experienced above-average employment growth (+5.4%)
- the average hourly wage increased by 4.4%, to $28.45
Type of Work quarterly details
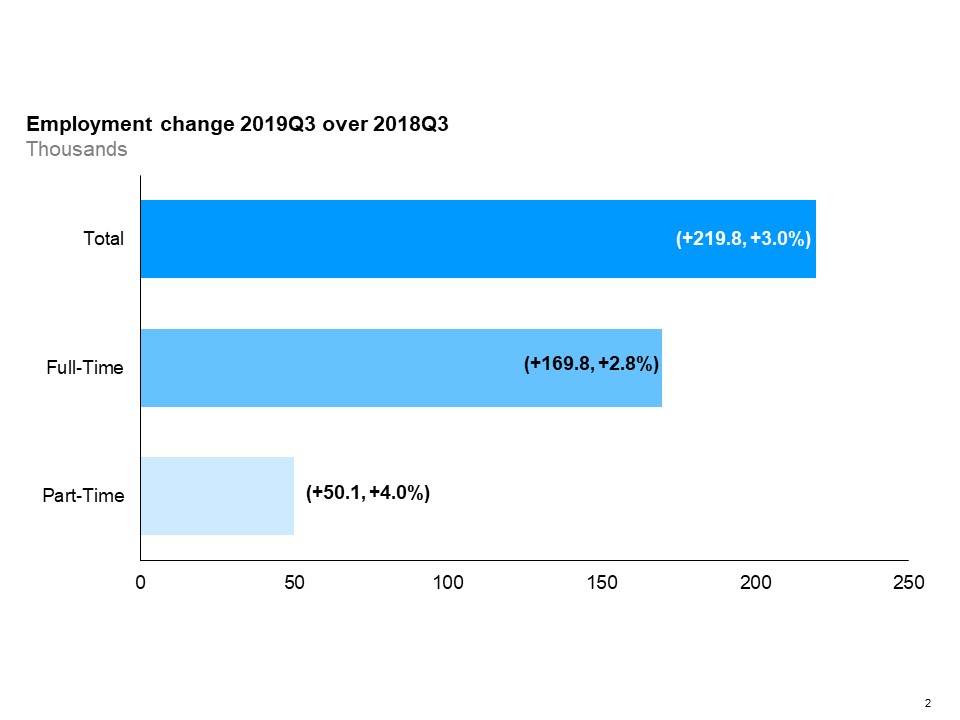
The horizontal bar chart shows a year-over-year (between the third quarters of 2018 and 2019) change in Ontario’s employment by full-time and part-time status. Total employment increased by 3.0%, driven by gains in both full-time employment (+2.8%) and part-time employment (+4.0%).
Year-over-year, full-time employment increased by 2.8% and part-time employment increased by 4.0% in the third quarter.
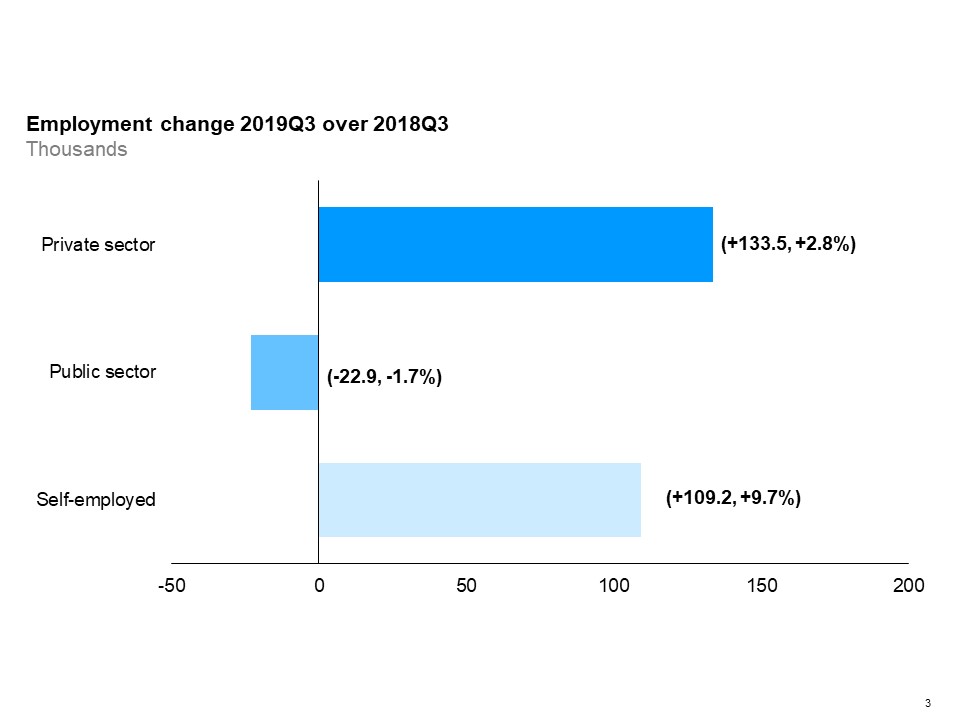
The horizontal bar chart shows a year-over-year (between the third quarters of 2018 and 2019) change in Ontario’s employment for the private sector, public sector and self-employment. Employment increased in both the private sector and self-employment, while decreased in the public sector. Private sector employment increased by 2.8%, while self-employment grew by 9.7% and public sector employment decreased by 1.7%.
Year-over-year, both the private sector and self-employment saw growth, while employment in the public sector decreased. The strongest growth was in self-employment (+9.7%).
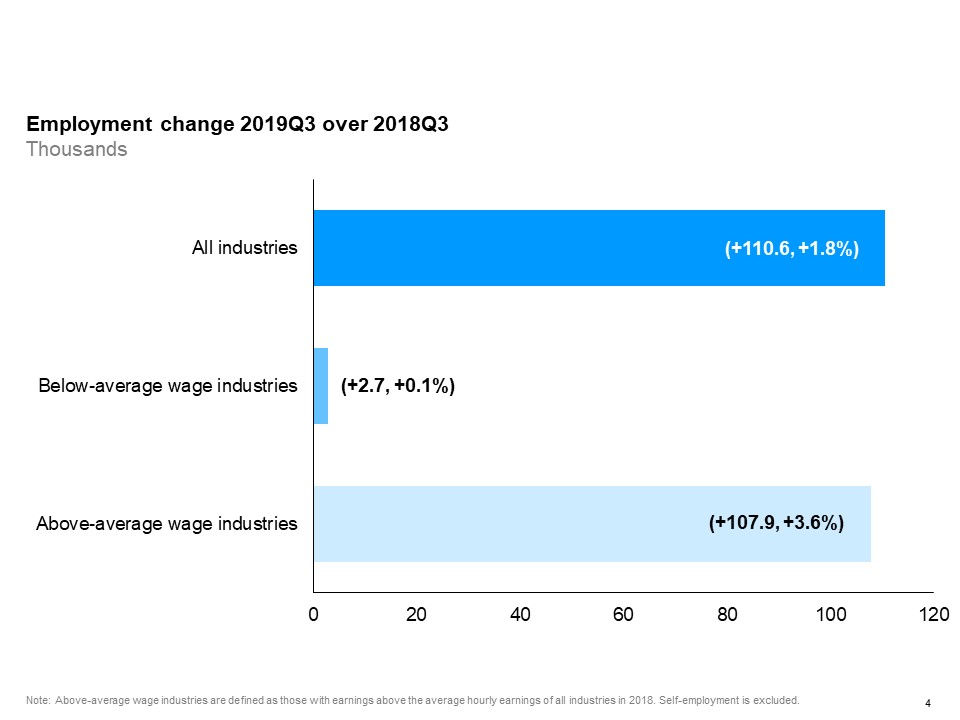
The horizontal bar chart shows a year-over-year (between the third quarters of 2018 and 2019) change in Ontario’s employment for above- and below-average wage industries, compared to the paid employment in all industries. Employment in above-average wage industries (+3.6%) increased more than employment in below-average wage industries (+0.1%). Paid employment in all industries (excluding self-employment) rose by 1.8%. Above-average wage industries are defined as those with wage rates above the average hourly wages of all industries in 2018.
Year-over-year, paid employment increased in above-average wage industries by 3.6%, while employment in below-average wage industries increased by 0.1%.
Sector and occupation quarterly details
Employment change by industry, goods-producing industries
Year-over-year, there were significant employment gains in the services-producing sector (+3.4%), as well as minor employment gains in the goods-producing sector (+1.4%).
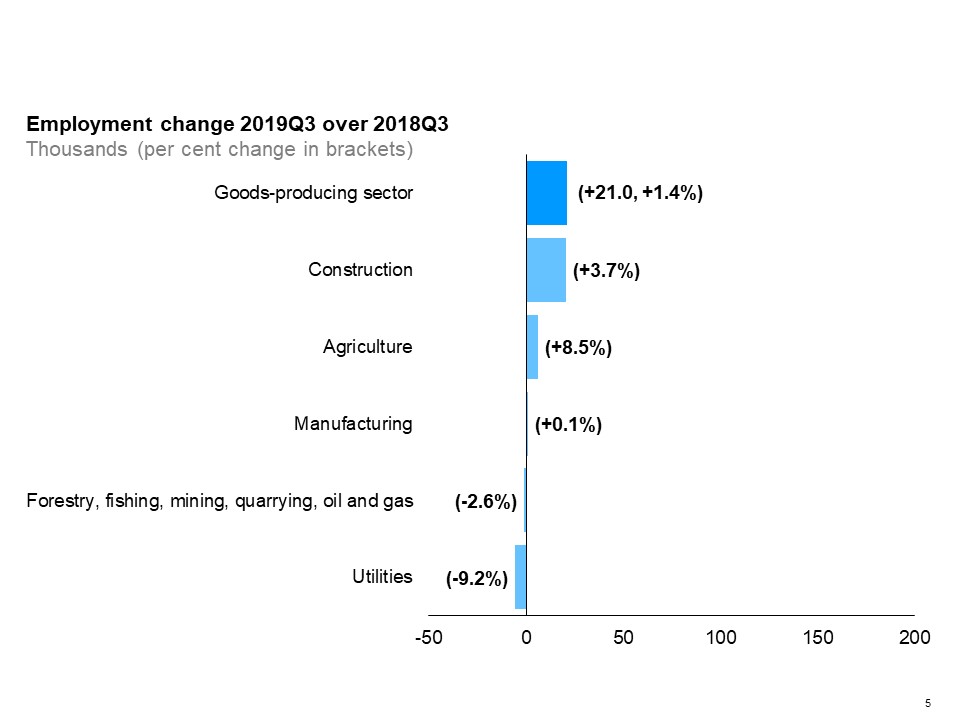
The horizontal bar chart shows a year-over-year (between the third quarters of 2018 and 2019) change in Ontario’s employment by industry for goods-producing industries. Construction experienced the largest employment growth (+3.7%), followed by agriculture (+8.5) and manufacturing (+0.1%). Utilities had the largest employment decline (-9.2%), followed by forestry, fishing, mining, quarrying, oil and gas (-2.6%). The overall employment in goods-producing industries increased by 1.4%.
Among goods-producing industries, the employment increase was driven mostly by construction (+3.7%). Agriculture experienced the largest growth rate among goods-producing industries (+8.5%), while employment in utilities and in forestry, fishing, mining, quarrying, oil and gas declined.
Employment change by industry, services-producing industries
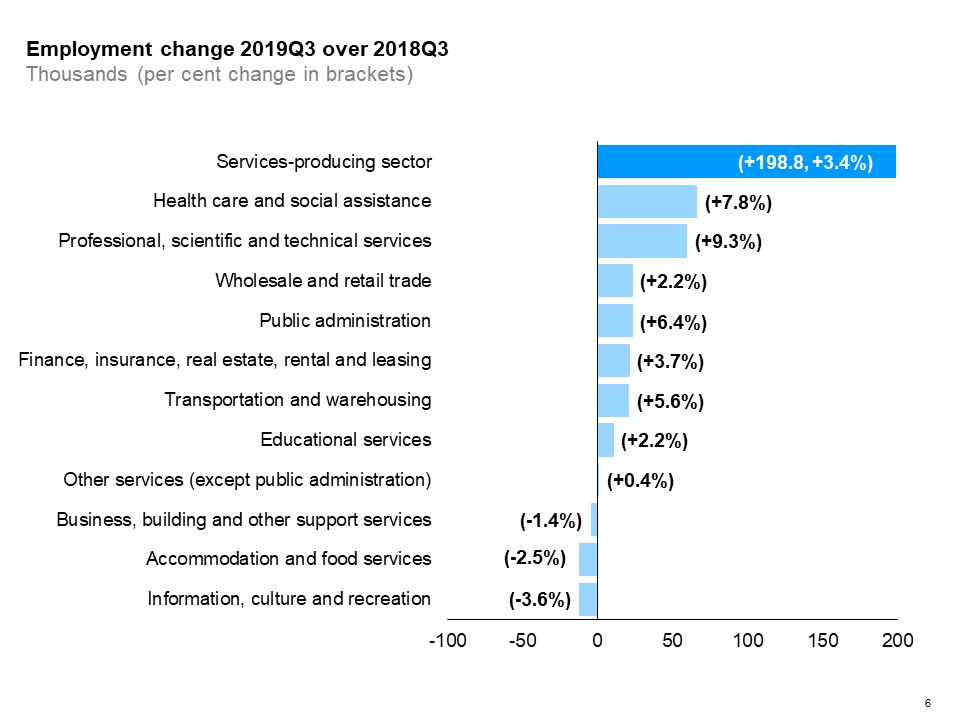
The horizontal bar chart shows a year-over-year (between the third quarters of 2018 and 2019) change in Ontario’s employment by industry for services-producing industries. Eight services-producing industries had an increase in employment. Health care and social assistance experienced the biggest employment gain (+7.8%), followed by professional, scientific and technical services (+9.3%), wholesale and retail trade (+2.2%) and public administration (+6.4%). Three industries experienced employment declines. The biggest employment decline occurred in information, culture and recreation (-3.6%), followed by accommodation and food services (-2.5%). The overall employment in services-producing industries increased by 3.4%.
Among services-producing industries, health care and social assistance gained the most jobs, while professional, scientific and technical services experienced the highest rate of employment growth (+9.3%). Information, culture and recreation had the largest decline in employment (-3.6%).
Employment change by occupational group
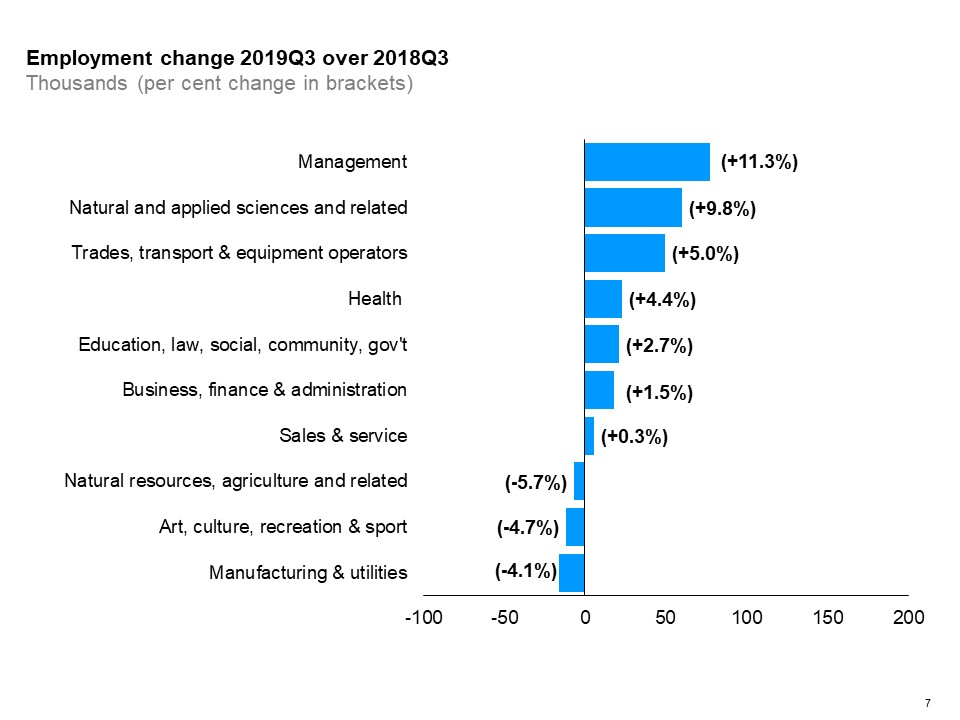
The horizontal bar chart shows a year-over-year (between the third quarters of 2018 and 2019) change in Ontario’s employment by broad occupational group. Seven occupational groups experienced employment gains. Management occupations had the biggest employment gain (+11.3%), followed by natural and applied sciences and related (+9.8%), and occupations in trades, transport and equipment operators (+5.0%). Employment in three occupational categories decreased. Manufacturing and utilities occupations experienced the biggest decline (-4.1%), followed by arts, culture, recreation and sport (-4.7%).
Among broad occupational groups, management occupations saw the largest increase in employment, while employment in manufacturing and utilities occupations declined the most.
Geographic region
Ontario regions
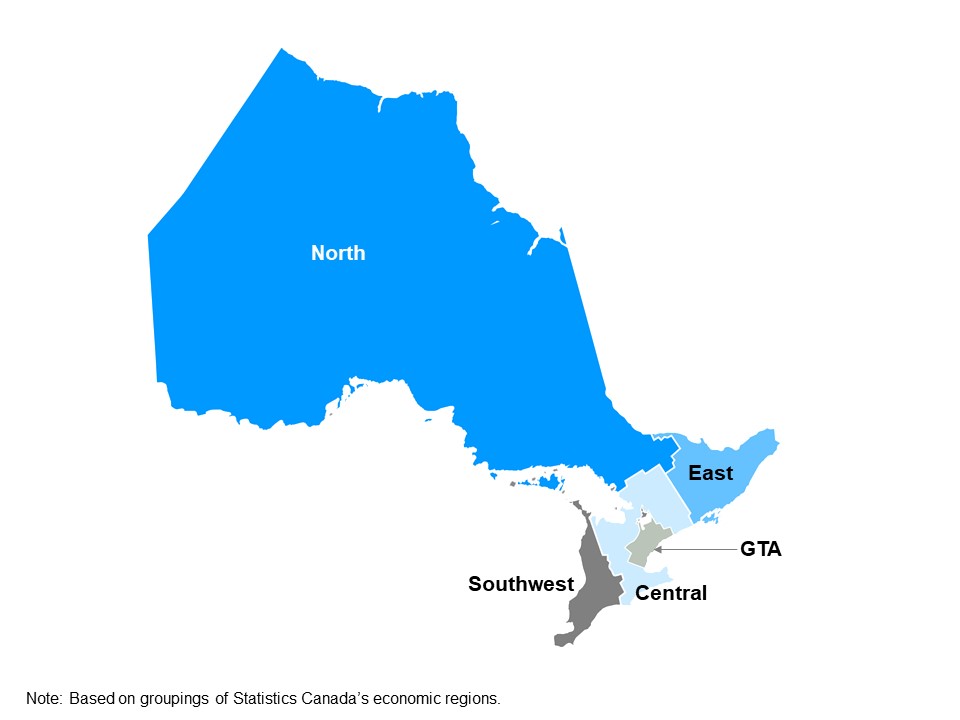
The map shows Ontario’s five regions: Northern Ontario, Eastern Ontario, Southwestern Ontario, Central Ontario and the Greater Toronto Area. This map is based on groupings of Statistics Canada’s economic regions.
Employment change by Ontario region
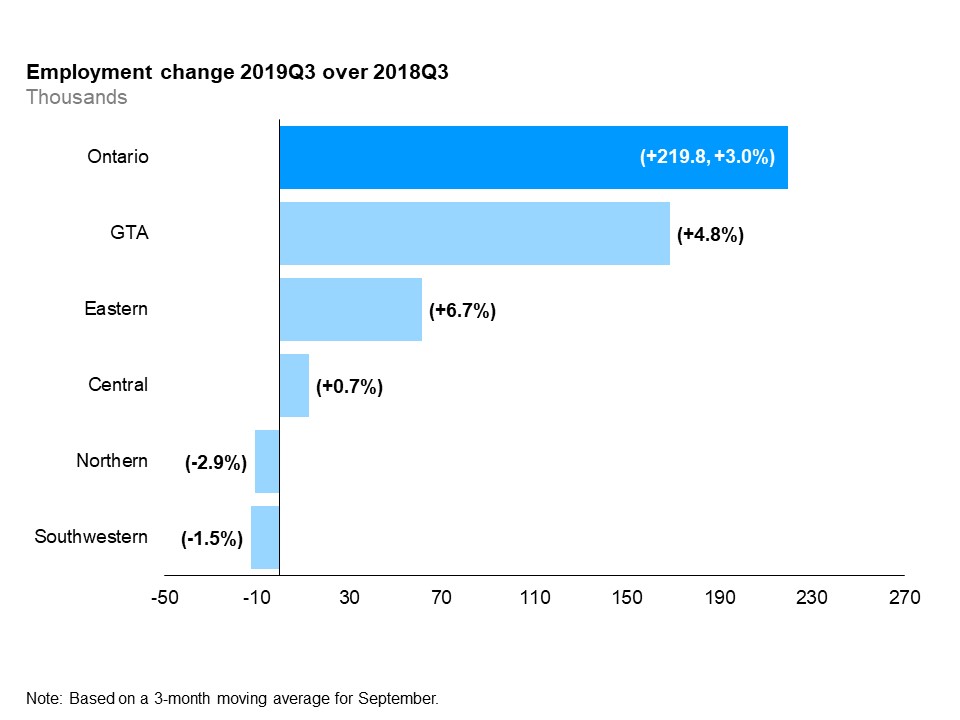
The horizontal bar chart shows a year-over-year (between the third quarters of 2018 and 2019) change in employment in the five Ontario regions: Northern Ontario, Eastern Ontario, Southwestern Ontario, Central Ontario and the Greater Toronto Area (GTA). Employment increased in three of the five regions. The rate of employment growth was highest in Eastern Ontario (+6.7%), followed by the GTA (+4.8%) and Central Ontario (+0.7%). Employment declined in Southwestern Ontario (-1.5%) and Northern Ontario (-2.9%). The overall employment increased by 3.0% (+219,800).
Year-over-year, employment increased in three of the five Ontario regions. The rate of employment growth was highest in Eastern Ontario (+6.7%), followed by the Greater Toronto Area (GTA)
Unemployment rates by Ontario region
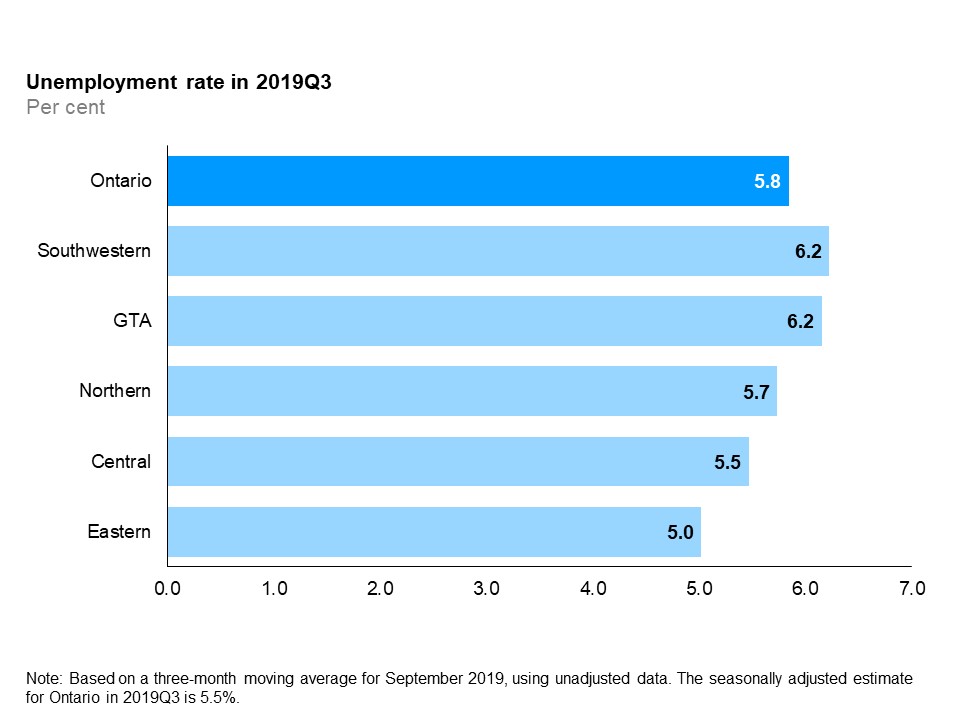
The horizontal bar chart shows unemployment rates by Ontario region in the third quarter of 2019. Both Southwestern Ontario and the Greater Toronto Area the had the highest unemployment rate at 6.2%, followed by Northern Ontario (5.7%), Central Ontario (5.5%) and Eastern Ontario (5.0%). The overall unemployment rate for Ontario was 5.8%.
In the third quarter of 2019, both Southwestern Ontario and the GTA had the highest unemployment rate (6.2%), while Eastern Ontario had the lowest unemployment rate (5.0%).
Participation rates by Ontario region
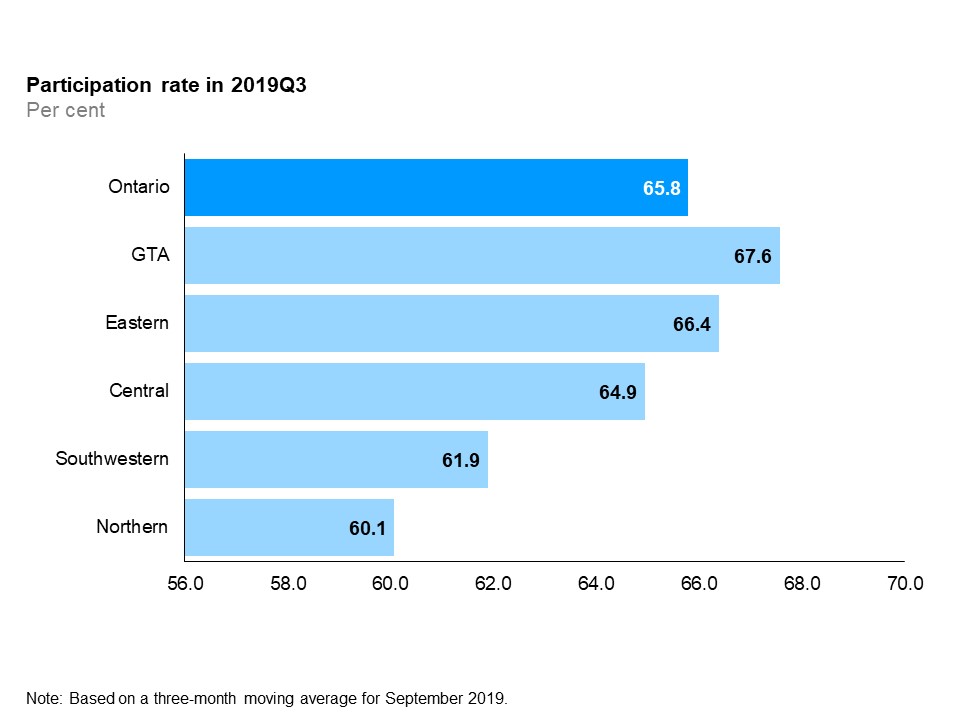
The horizontal bar chart shows participation rates by Ontario region in the third quarter of 2019. The Greater Toronto Area had the highest participation rate at 67.6%, followed by Eastern Ontario (66.4%), Central Ontario (64.9%), Southwestern Ontario (61.9%) and Northern Ontario (60.1%). The overall participation rate for Ontario was 65.8%.
Quarterly labour force participation rates varied considerably among the economic regions. In the third quarter, participation rates ranged from 60.1% in Northern Ontario to 67.6% in the GTA.
Age and gender quarterly details
Employment change by age group and gender
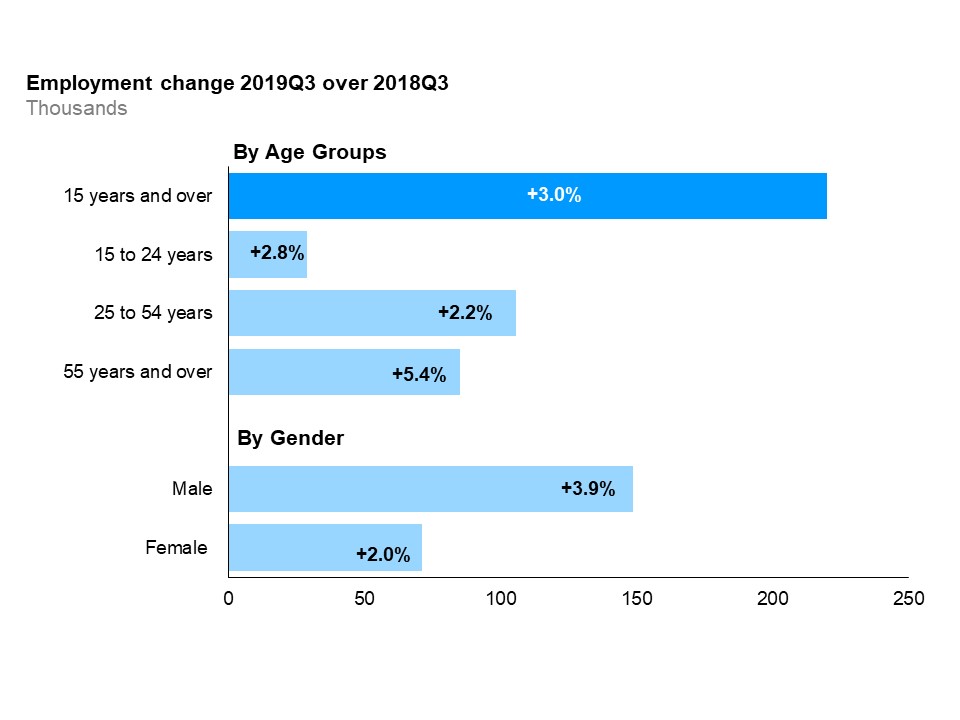
The horizontal bar chart shows a year-over-year (between the third quarters of 2018 and 2019) change in Ontario’s employment for the three major age groups, as well as by gender, compared to the overall population. Ontarians aged 25 to 54 years gained the most jobs (+2.2%), followed by Ontarians aged 55 years and over (+5.4%). Employment for Ontarians aged 15 to 24 years increased the least (+2.8%). Total employment (for population aged 15 and over) increased by 3.0%. Males (+3.9%) gained more jobs than females (+2.0%).
Compared to the same quarter last year, core-aged workers (25 to 54 years) gained the most jobs, followed by older workers (55 years and over) and youth (15 to 24 years). Older workers experienced above-average employment growth (+5.4%).
Unemployment rates by age group and gender
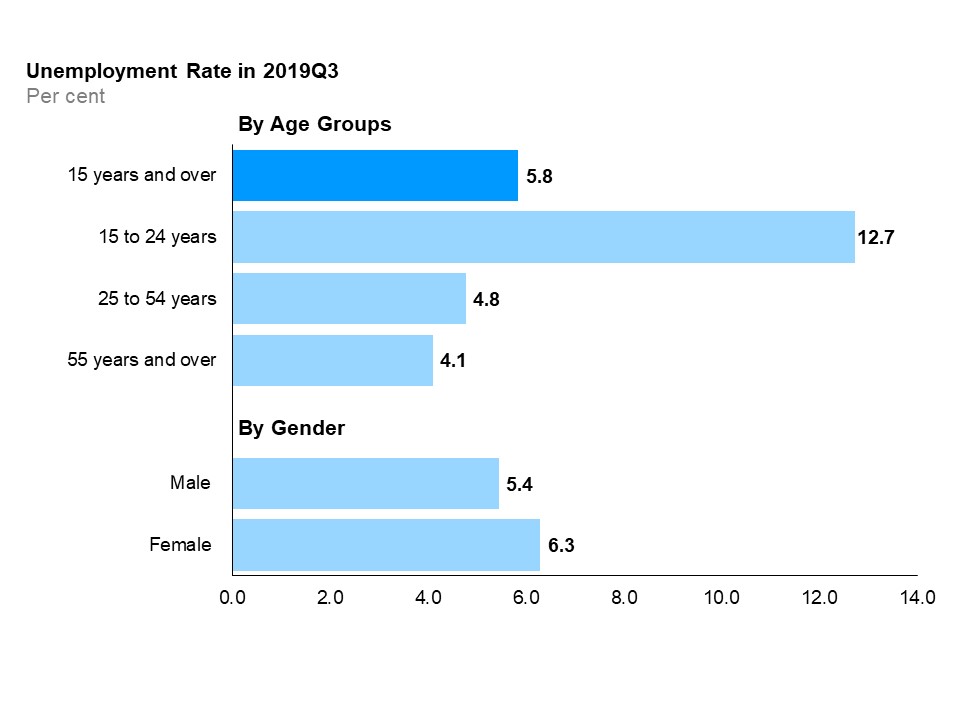
The horizontal bar chart shows unemployment rates for the three major age groups, as well as by gender, compared to the overall rate, in the third quarter of 2019. Youth (15 to 24 years) had the highest unemployment rate at 12.7%, followed by the core-aged population (25 to 54 years) at 4.8% and older Ontarians (55 years and over) at 4.1%. The overall unemployment rate in the third quarter of 2019 was 5.8%. The female unemployment rate (6.3%) was higher than the male unemployment rate (5.4%).
Compared to a year ago, the unemployment rate decreased by 0.3 percentage points for females and stayed the same for males. In the third quarter, the unemployment rate of youth was 12.7%, the highest among the three age groups. Compared to a year ago, the unemployment rate decreased for core-aged workers, increased for youth and remained the same for older workers.
Participation rates by age group and gender
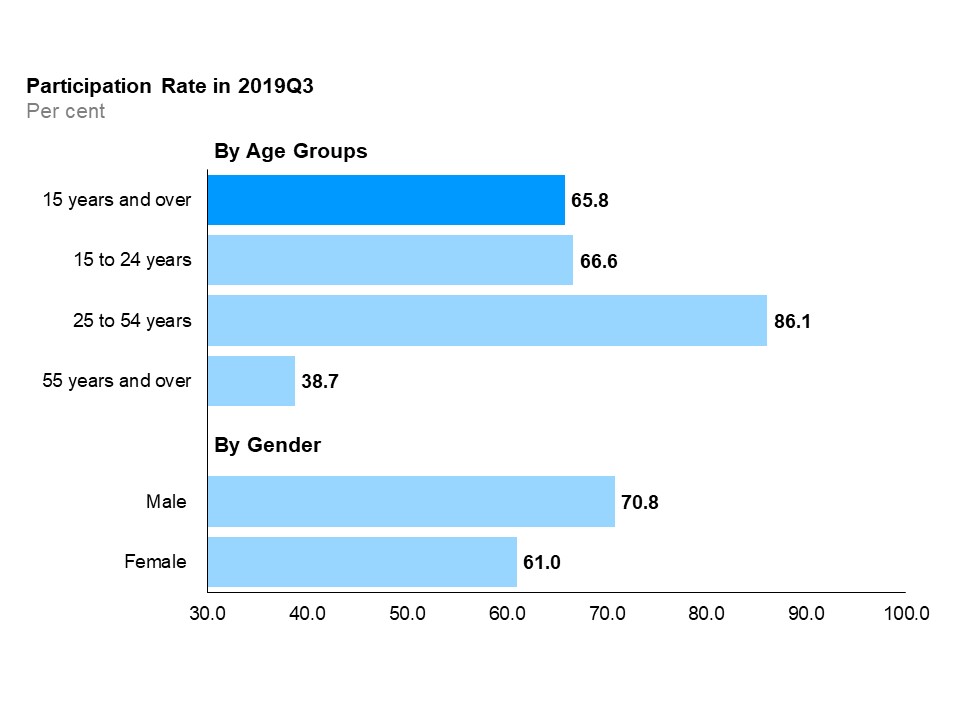
The horizontal bar chart shows labour force participation rates for the three major age groups, as well as by gender, compared to the overall rate, in the third quarter of 2019. The core-aged population (25 to 54 years old) had the highest labour force participation rate at 86.1%, followed by youth (15 to 24 years old) at 66.6%, and older Ontarians (55 years and over) at 38.7%. The overall participation rate was 65.8%. The male participation rate (70.8%) was higher than the female participation rate (61.0%).
In the third quarter, core-aged workers had the highest participation rate at 86.1%, followed by youth at 66.6% and older workers at 38.7%. Compared to a year ago, the participation rate increased for all age groups. The participation rates for males increased compared to a year ago (+1.2 percentage point) and slightly decreased for females (-0.1 percentage points).
Education level and immigrant status quarterly details
Employment rates by education level and immigrant status (core-aged population)
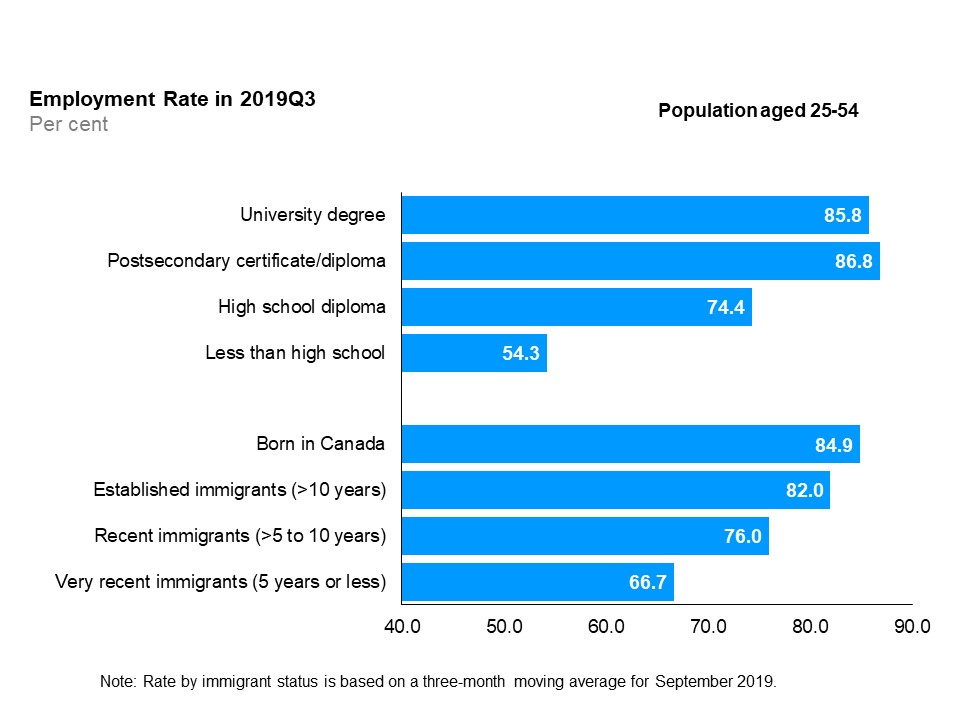
The horizontal bar chart shows employment rates by education level and immigrant status for the core-aged population (25 to 54 years old), in the third quarter of 2019. By education level, those with a postsecondary certificate/diploma had the highest employment rate (86.8%), followed by those with a university degree (85.8%), those with a high school diploma (74.4%), and those with less than high school education (54.3%). By immigrant status, those born in Canada had the highest employment rate (84.9%), followed by established immigrants with more than 10 years since landing (82.0%), recent immigrants with more than 5 to 10 years since landing (76.0%), and very recent immigrants with 5 years or less since landing (66.7%).
In the third quarter of 2019, those without a high school diploma continued to hold the lowest employment rate (54.3%), while postsecondary certificate and diploma degree holders recorded the highest employment rate (86.8%), followed by university degree holders (85.8%). Education level refers to the highest level of schooling completed.
Those born in Canada recorded the highest employment rate (84.9%), while very recent immigrants continued to have the lowest employment rate (66.7%) among groups by immigrant status.
Unemployment rates by education level and immigrant status (core-aged population)
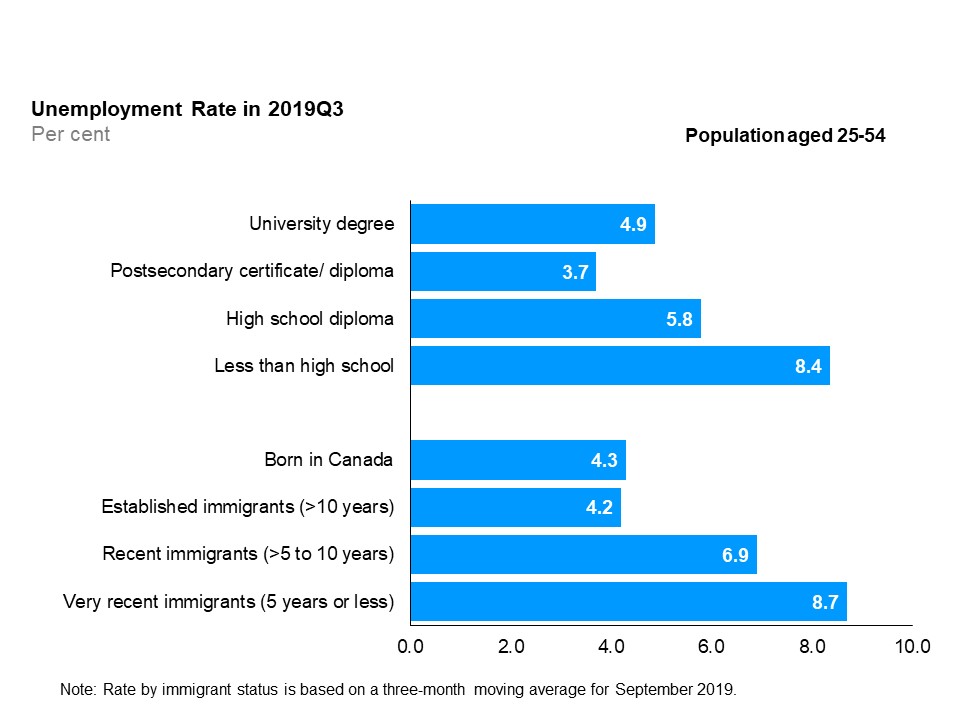
The horizontal bar chart shows unemployment rates by education level and immigrant status for the core-aged population (25 to 54 years old), in the third quarter of 2019. By education level, those with less than high school education had the highest unemployment rate (8.4%), followed by high school graduates (5.8%), those with a university degree (4.9%), and postsecondary certificate or diploma (3.7%). By immigrant status, very recent immigrants with 5 years or less since landing had the highest unemployment rate (8.7%), followed by recent immigrants with more than 5 to 10 years since landing (6.9%), those born in Canada (4.3%) and established immigrants with more than 10 years since landing (4.2%).
In the third quarter of 2019, postsecondary certificate and diploma holders recorded the lowest unemployment rate (3.7%) among all education levels. Those without a high school diploma had the highest unemployment rate (8.4%). The unemployment rate of those with a university degree and those with a post-secondary certificate or diploma decreased, year-over-year, while the unemployment rates for those without high school diploma increased. High school diploma holders’ unemployment rate remained relatively unchanged.
Year-over-year, the unemployment rates decreased for all groups by immigrant status, except for recent immigrants.
Participation rates by education level and immigrant status (core-aged population)
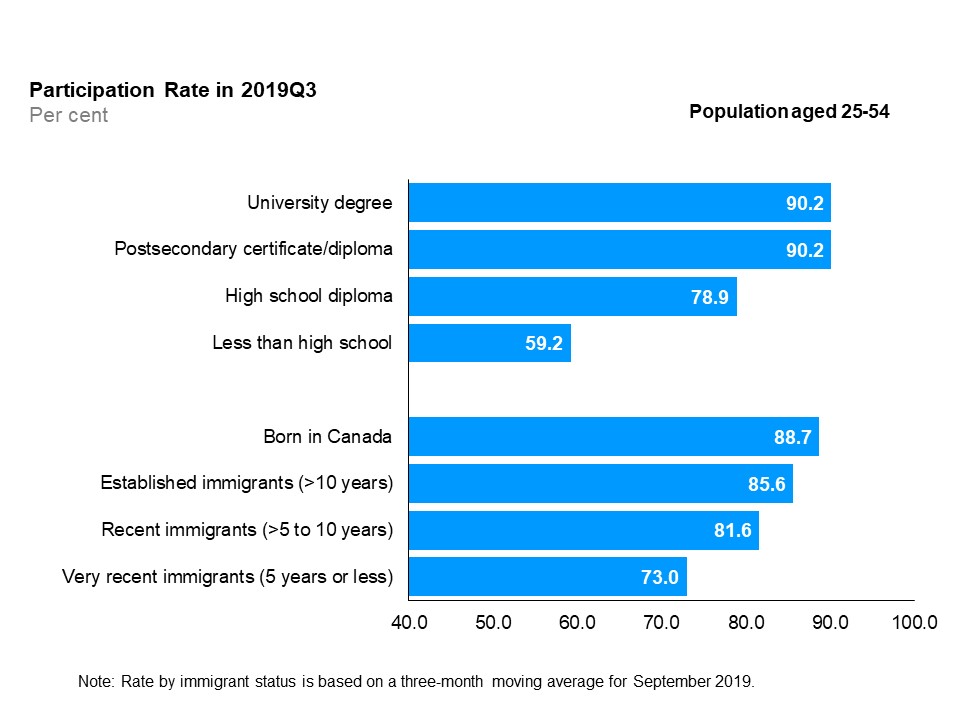
The horizontal bar chart shows labour force participation rates by education level and immigrant status for the core-aged population (25 to 54 years old), in the third quarter of 2019. By education level, both university degree holders and postsecondary certificate or diploma holders had the highest participation rate (90.2%), followed by high school graduates (78.9%), and those with less than high school education (59.2%). By immigrant status, those born in Canada had the highest participation rate (88.7%), followed by established immigrants with more than 10 years since landing (85.6%), recent immigrants with more than 5 to 10 years since landing (81.6%) and very recent immigrants with 5 years or less since landing (73.0%).
In the third quarter of 2019, university degree holders and those with a postsecondary certificate or diploma continued to record the highest participation rates (90.2%), while those without a high school diploma had the lowest participation rate (59.2%). Year-over-year, participation rates for university degree holders and those with a postsecondary certificate or diploma slightly improved, but slightly decreased for those with and without a high school diploma.
In the third quarter of 2019, recent immigrants and very recent immigrants continued to have the lowest participation rates compared to established immigrants and those born in Canada. Year-over-year, participation rate for those born in Canada increased (+1.4 percentage points) and decreased for other immigrant groups.
Wages quarterly details
Average hourly wages total, full-time and part-time employees
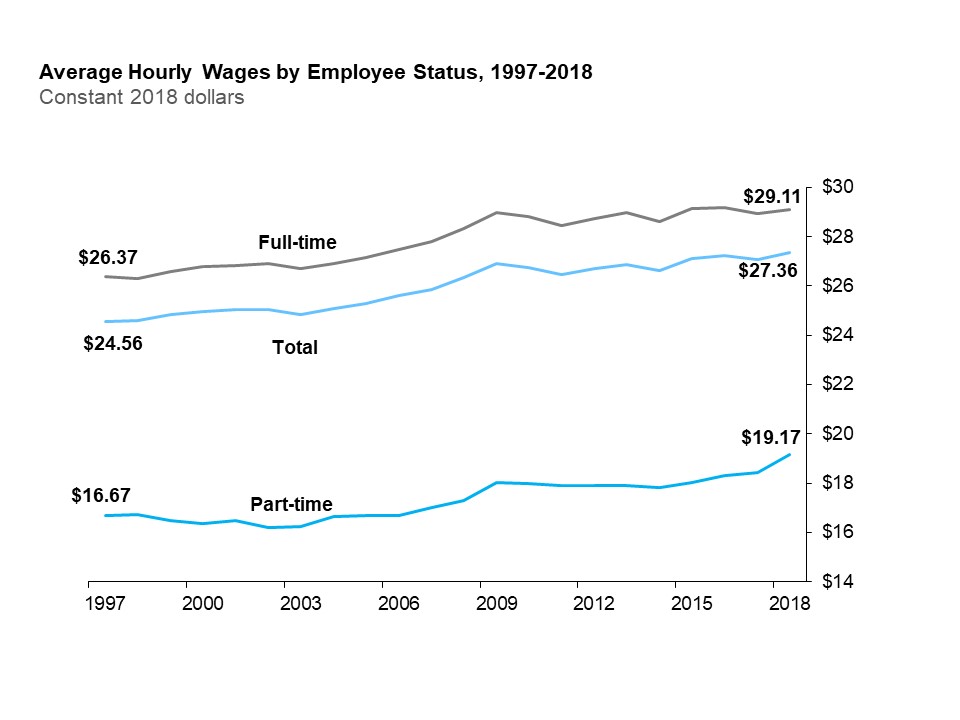
The line chart shows average hourly wages for all employees, full-time and part-time employees expressed in real 2018 dollars from 1997 to 2018. Real average hourly wages of all employees increased from $24.56 in 1997 to $27.36 in 2018; those of full-time employees increased from $26.37 in 1997 to $29.11 in 2018 and those of part-time employees increased from $16.67 in 1997 to $19.17 in 2018.
Over the last two decades, the average hourly wage increased in real terms
Hourly wage growth by type of work
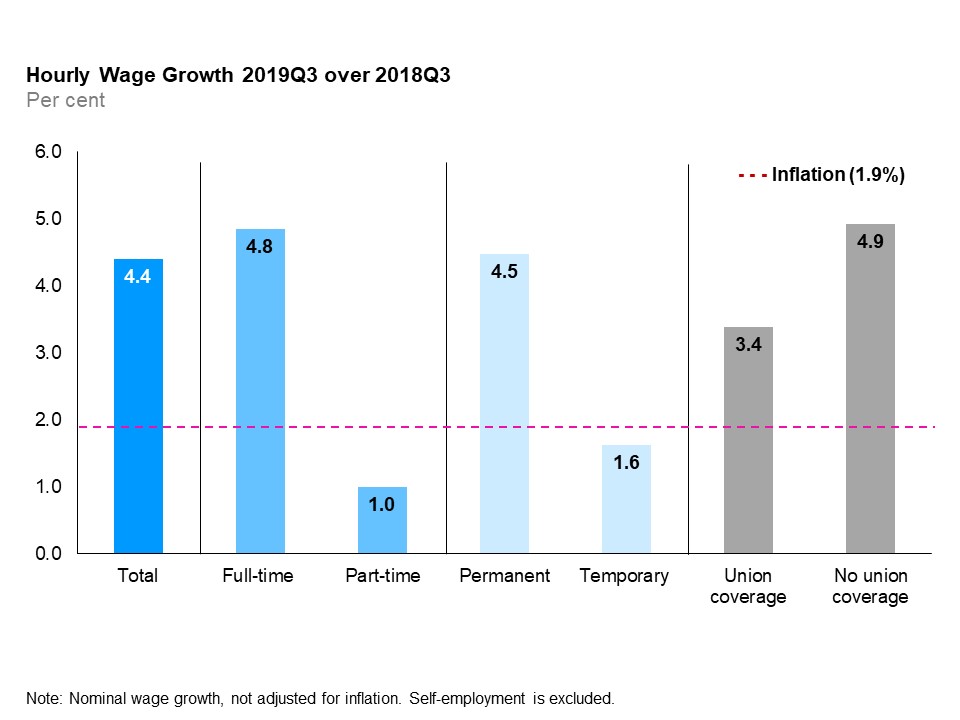
The vertical bar chart shows a year-over-year (between the third quarters of 2018 and 2019) nominal per cent change in Ontario’s hourly wages by type of work. The average hourly wage increased by 4.4%. Hourly wages increased for both full-time (+4.8%) and part-time employees (+1.0%); permanent (+4.5%) and temporary employees (+1.6%) and employees with union coverage (+3.4%) and those without union coverage (+4.9%). Inflation during the same period was 1.9%.
In the third quarter of 2019, the average hourly wage of Ontario employees was $28.45, an increase of 4.4% from the third quarter of 2018.
Average hourly wage rate and wage growth by occupational group
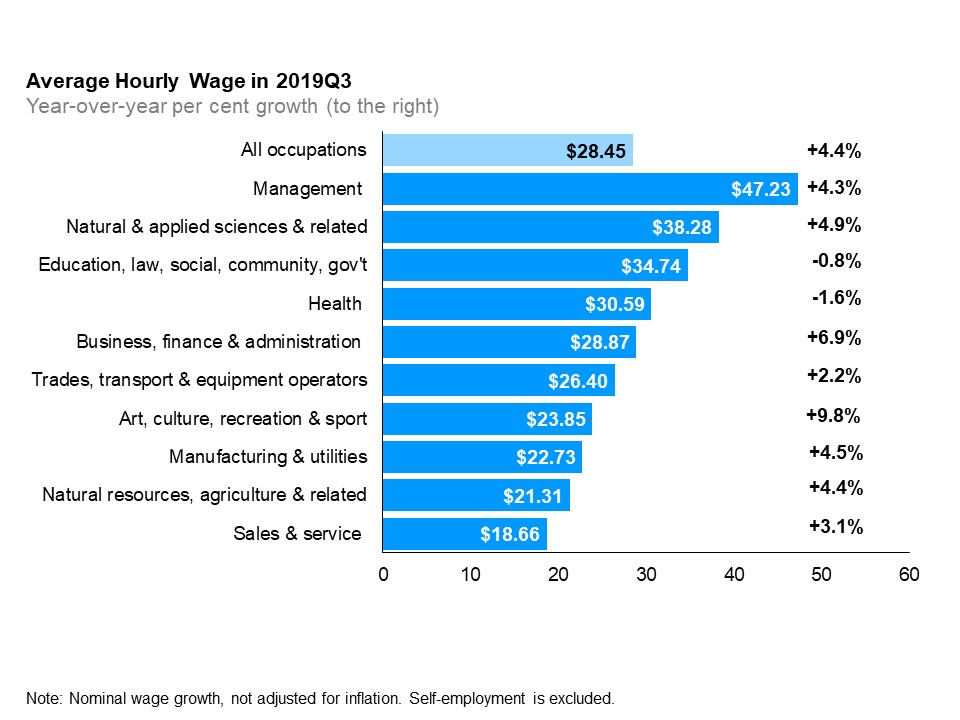
The horizontal bar chart shows a year-over-year (between the third quarters of 2018 and 2019) change in Ontario’s average hourly wage rate and growth by occupational group. In the third quarter of 2019, the average hourly wage rate for Ontario was $28.45 (+4.4%). The highest average hourly wage rate was for management occupations at $47.23 (+4.3%); followed by natural and applied sciences and related occupations at $38.28 (+4.9%); and occupations in education, law and social, community and government services at $34.74 (-0.8%). The lowest average hourly wage rate was for sales and service occupations at $18.66 (+3.1%). The only occupational groups that experienced a decline in average hourly wages were occupations in health and occupations in education, law and social, community and government services.
The three broad occupational groups that experienced the highest wage growth were: art, culture, recreation and sport (+9.8%), business, finance and administration (+6.9%), and natural and applied sciences and related (+4.9%). Two broad occupational groups experienced a decline in wages: health (-1.6%) and education, law, social, community and government (-0.8%).
Appendix
Overview of annual employment ten-year review
| 2009 | 2010 | 2011 | 2012 | 2013 | 2014 | 2015 | 2016 | 2017 | 2018 | |
|---|---|---|---|---|---|---|---|---|---|---|
| Total Labour Force (000) | 7,080.2 | 7,160.9 | 7,227.4 | 7,276.4 | 7,383.8 | 7,418.6 | 7,426.1 | 7,489.5 | 7,579.8 | 7,673.0 |
| Participation Rate (%) | 67.0 | 66.8 | 66.6 | 66.2 | 66.3 | 65.8 | 65.2 | 65.0 | 64.9 | 64.5 |
| Male Participation Rate (%) | 71.5 | 71.1 | 71.1 | 70.7 | 70.5 | 70.3 | 70 | 69.5 | 69.2 | 68.7 |
| Female Participation Rate (%) | 62.6 | 62.8 | 62.3 | 61.9 | 62.2 | 61.6 | 60.7 | 60.7 | 60.7 | 60.5 |
| Total Employment (000) | 6,432.7 | 6,537.8 | 6,658.4 | 6,702.6 | 6,823.4 | 6,877.9 | 6,923.2 | 6,999.6 | 7,128.0 | 7,242.4 |
| - Full-time (000) | 5,174.0 | 5,256.1 | 5,373.5 | 5,412.0 | 5,489.5 | 5,540.0 | 5,618.2 | 5,672.6 | 5,778.7 | 5,909.0 |
| - Part-time (000) | 1,258.7 | 1,281.8 | 1,284.8 | 1,290.6 | 1,334.0 | 1,337.9 | 1,305.0 | 1,327.0 | 1,349.3 | 1,333.4 |
| Employment-Population Ratio (%) | 60.9 | 61.0 | 61.4 | 60.9 | 61.2 | 61.0 | 60.8 | 60.7 | 61.0 | 60.9 |
| Male Employment (000) | 3,300.8 | 3,363.6 | 3,450.4 | 3,471.5 | 3,522.8 | 3,567.1 | 3,607.1 | 3,635.9 | 3,700.9 | 3,763.9 |
| Female Employment (000) | 3,131.9 | 3,174.2 | 3,207.9 | 3,231.1 | 3,300.6 | 3,310.8 | 3,316.1 | 3,363.7 | 3,427.1 | 3,478.5 |
| Part-Time (% of total) | 19.6 | 19.6 | 19.3 | 19.3 | 19.6 | 19.5 | 18.8 | 19.0 | 18.9 | 18.4 |
| Goods-Producing Sector Employment (000) | 1,365.0 | 1,380.6 | 1,408.7 | 1,415.3 | 1,397.5 | 1,382.0 | 1,401.4 | 1,418.1 | 1,432.6 | 1,453.1 |
| Services-Producing Sector Employment (000) | 5,067.7 | 5,157.3 | 5,249.7 | 5,287.3 | 5,425.9 | 5,495.9 | 5,521.7 | 5,581.4 | 5,695.4 | 5,789.2 |
| Private Sector Employment (000) | 4,194.7 | 4,268.2 | 4,339.7 | 4,373.0 | 4,447.0 | 4,517.0 | 4,540.7 | 4,597.3 | 4,690.6 | 4,740.6 |
| Public Sector Employment (000) | 1,232.8 | 1,254.7 | 1,294.3 | 1,286.0 | 1,314.0 | 1,305.4 | 1,294.1 | 1,306.4 | 1,329.1 | 1,376.7 |
| Self-Employment (% of total) | 15.6 | 15.5 | 15.4 | 15.6 | 15.6 | 15.3 | 15.7 | 15.7 | 15.5 | 15.5 |
| Total Unemployment (000) | 647.5 | 623.1 | 569.1 | 573.8 | 560.3 | 540.7 | 502.9 | 489.9 | 451.8 | 430.7 |
| Unemployment Rate (%) | 9.1 | 8.7 | 7.9 | 7.9 | 7.6 | 7.3 | 6.8 | 6.5 | 6.0 | 5.6 |
| Male Unemployment Rate (%) | 10.5 | 9.4 | 8.2 | 8.3 | 8.0 | 7.5 | 7 | 6.8 | 6.2 | 5.6 |
| Female Unemployment Rate (%) | 7.7 | 8.0 | 7.6 | 7.5 | 7.2 | 7.1 | 6.5 | 6.3 | 5.7 | 5.6 |
| Long-Term (27 wks+) (% of total) | 18.8 | 24.9 | 24.1 | 22.7 | 22.9 | 22.8 | 20.0 | 19.9 | 19.5 | 16.9 |
| Average Unemployment in Weeks | 18.4 | 22.0 | 22.4 | 22.2 | 21.8 | 22.4 | 20.0 | 19.9 | 19.3 | 17.2 |
| Youth Unemployment Rate (%) | 17.6 | 17.4 | 15.9 | 17.0 | 16.2 | 15.7 | 14.7 | 14.0 | 12.3 | 11.9 |
| 25-54 y.o. Unemployment rate (%) | 7.8 | 7.3 | 6.5 | 6.4 | 6.2 | 5.9 | 5.6 | 5.4 | 5.0 | 4.7 |
| 55+ y.o. Unemployment rate (%) | 6.6 | 6.4 | 6.0 | 5.8 | 5.5 | 5.3 | 4.9 | 4.9 | 4.5 | 4.2 |
| Average Weekly Wage Rate ($) | 828.35 | 842.35 | 862.45 | 883.12 | 895.56 | 907.17 | 938.09 | 958.5 | 967.44 | 1001.74 |
| Average Hourly Wage Rate ($) | 22.66 | 23.09 | 23.55 | 24.09 | 24.48 | 24.82 | 25.59 | 26.15 | 26.43 | 27.36 |
Employment by region (000)
| 2009 | 2010 | 2011 | 2012 | 2013 | 2014 | 2015 | 2016 | 2017 | 2018 | |
|---|---|---|---|---|---|---|---|---|---|---|
| Greater Toronto Area | 2,963.0 | 3,034.6 | 3,077.8 | 3,112.3 | 3,240.2 | 3,241.1 | 3,320.4 | 3,373.2 | 3,442.9 | 3,521.6 |
| Central | 1,487.7 | 1,508.1 | 1,552.0 | 1,551.4 | 1,559.5 | 1,597.2 | 1,597.5 | 1,598.0 | 1,655.2 | 1,656.9 |
| Southwestern | 752.0 | 761.7 | 771.1 | 772.9 | 769.4 | 775.0 | 770.5 | 775.8 | 778.4 | 794.3 |
| Eastern | 879.2 | 879.6 | 897.0 | 908.7 | 898.4 | 907.9 | 889.2 | 904.9 | 903.4 | 916.0 |
| Northern | 350.8 | 354.0 | 360.4 | 357.3 | 355.9 | 356.6 | 345.5 | 347.7 | 348.2 | 353.6 |
Unemployment rate by region (%)
| 2009 | 2010 | 2011 | 2012 | 2013 | 2014 | 2015 | 2016 | 2017 | 2018 | |
|---|---|---|---|---|---|---|---|---|---|---|
| Greater Toronto Area | 9.6 | 9.2 | 8.4 | 8.8 | 8.2 | 8.0 | 7.1 | 6.9 | 6.4 | 6.1 |
| Central | 9.1 | 8.4 | 7.4 | 7.0 | 6.9 | 6.2 | 5.9 | 5.9 | 5.3 | 5.2 |
| Southwestern | 10.3 | 9.1 | 8.1 | 7.8 | 7.7 | 7.0 | 6.9 | 6.1 | 5.6 | 5.2 |
| Eastern | 6.8 | 7.2 | 6.7 | 6.6 | 6.6 | 7.0 | 6.7 | 6.4 | 5.7 | 4.9 |
| Northern | 9.0 | 8.3 | 7.8 | 7.2 | 7.4 | 6.6 | 7.2 | 7.1 | 6.4 | 5.8 |
Total employment by CMA (000)
Greater Toronto Area
| 2009 | 2010 | 2011 | 2012 | 2013 | 2014 | 2015 | 2016 | 2017 | 2018 | |
|---|---|---|---|---|---|---|---|---|---|---|
| Toronto | 2,817.0 | 2,880.3 | 2,923.4 | 2,960.6 | 3,092.1 | 3,087.4 | 3,176.7 | 3,215.0 | 3,289.6 | 3,353.0 |
| Oshawa | 175.1 | 184.3 | 189.0 | 190.0 | 194.5 | 201.4 | 196.4 | 214.0 | 210.4 | 220.6 |
Central Ontario
| 2009 | 2010 | 2011 | 2012 | 2013 | 2014 | 2015 | 2016 | 2017 | 2018 | |
|---|---|---|---|---|---|---|---|---|---|---|
| Hamilton | 369.8 | 369.1 | 375.1 | 376.6 | 374.8 | 383.7 | 385.4 | 385.8 | 417.9 | 413.8 |
| Kitchener | 250.7 | 258.1 | 270.5 | 271.6 | 278.9 | 283.1 | 279.8 | 281.6 | 287.8 | 292.2 |
| St. Catharines-Niagara | 186.3 | 190.4 | 196.1 | 201.8 | 193.5 | 195.4 | 204.1 | 203.1 | 197.6 | 201.7 |
| Peterborough | 58.5 | 56.6 | 57.6 | 58.5 | 54.9 | 60.5 | 61.2 | 59.5 | 61.2 | 63.6 |
| Brantford | 68.6 | 67.4 | 68.5 | 67.5 | 68.9 | 68.6 | 69.3 | 70.2 | 72.3 | 70.0 |
| Guelph | 79.1 | 79.2 | 82.0 | 83.9 | 79.8 | 81.8 | 90.5 | 90.6 | 90.8 | 88.8 |
| Barrie | 90.3 | 99.1 | 101.5 | 102.3 | 109.4 | 111.6 | 108.4 | 104.2 | 115.6 | 114.6 |
Eastern Ontario
| 2009 | 2010 | 2011 | 2012 | 2013 | 2014 | 2015 | 2016 | 2017 | 2018 | |
|---|---|---|---|---|---|---|---|---|---|---|
| Ottawa | 500.4 | 515.3 | 517.4 | 535.4 | 523.5 | 533.8 | 531.1 | 543.4 | 546.7 | 557.6 |
| Kingston | 79.2 | 76.7 | 79.3 | 80.6 | 82.6 | 81.4 | 82.9 | 83.6 | 87.3 | 86.4 |
Southwestern Ontario
| 2009 | 2010 | 2011 | 2012 | 2013 | 2014 | 2015 | 2016 | 2017 | 2018 | |
|---|---|---|---|---|---|---|---|---|---|---|
| London | 238.8 | 239.6 | 237.7 | 242.3 | 240.4 | 243.0 | 252.0 | 245.9 | 245.8 | 252.9 |
| Windsor | 146.4 | 147.5 | 147.9 | 153.3 | 154.8 | 155.2 | 158.0 | 164.1 | 162.8 | 164.5 |
Northern Ontario
| 2009 | 2010 | 2011 | 2012 | 2013 | 2014 | 2015 | 2016 | 2017 | 2018 | |
|---|---|---|---|---|---|---|---|---|---|---|
| Sudbury | 79.8 | 80.7 | 82.1 | 80.8 | 83.3 | 83.1 | 82.3 | 81.7 | 81.1 | 81.4 |
| Thunder Bay | 60.0 | 60.2 | 60.3 | 61.8 | 62.8 | 61.5 | 59.7 | 60.1 | 61.5 | 63.7 |
Overview of quarterly employment year-over-year
| 2017q4 | 2018q4 | 2018q1 | 2019q1 | 2018q2 | 2019q2 | 2018q3 | 2019q3 | |
|---|---|---|---|---|---|---|---|---|
| Total Labour Force (000) | 7,598.9 | 7,682.1 | 7,510.5 | 7,728.0 | 7,717.1 | 7913.8 | 7,782.4 | 8,002.8 |
| Participation Rate (%) | 64.6 | 64.1 | 63.6 | 64.2 | 65.0 | 65.4 | 65.2 | 65.8 |
| Male Participation Rate (%) | 68.8 | 68.4 | 67.5 | 68.6 | 69.1 | 70.0 | 69.6 | 70.8 |
| Female Participation Rate (%) | 60.7 | 60.0 | 59.8 | 60.0 | 61.1 | 61.0 | 61.1 | 61.0 |
| Total Employment (000) | 7,213.4 | 7,302.7 | 7,082.3 | 7,268.2 | 7269.2 | 7472.1 | 7,315.2 | 7,535.0 |
| - Full-time (000) | 5,818.4 | 5,909.0 | 5,707.7 | 5,858.2 | 5970.2 | 6096.2 | 6,049.1 | 6,218.9 |
| - Part-time (000) | 1,394.9 | 1,393.7 | 1,374.7 | 1,409.9 | 1299.0 | 1375.9 | 1,266.0 | 1,316.1 |
| Employment-Population Ratio (%) | 61.4 | 60.9 | 60.0 | 60.4 | 61.2 | 61.8 | 61.3 | 61.9 |
| Male Employment (000) | 3,730.9 | 3,794.3 | 3,653.6 | 3,771.2 | 3773.8 | 3906.0 | 3,833.8 | 3,982.6 |
| Female Employment (000) | 3,482.5 | 3,508.4 | 3,428.7 | 3,497.0 | 3495.4 | 3566.1 | 3,481.3 | 3,552.4 |
| Part-Time (% of total) | 19.3 | 19.1 | 19.4 | 19.4 | 17.9 | 18.4 | 17.3 | 17.5 |
| Goods-Producing Sector Employment (000) | 1,465.2 | 1,463.0 | 1,406.8 | 1,411.0 | 1451.7 | 1474.0 | 1,491.0 | 1,512.0 |
| Services-Producing Sector Employment (000) | 5,748.2 | 5,839.7 | 5,675.6 | 5,857.2 | 5817.5 | 5998.1 | 5,824.2 | 6,023.0 |
| Private Sector Employment (000) | 4,744.9 | 4,774.8 | 4,620.0 | 4,751.6 | 4756.9 | 4872.6 | 4,810.7 | 4,944.3 |
| Public Sector Employment (000) | 1,347.1 | 1,385.1 | 1,352.3 | 1,368.5 | 1396.0 | 1389.3 | 1,373.5 | 1,350.5 |
| Self-Employment (% of total) | 15.5 | 15.6 | 15.7 | 15.8 | 15.4 | 16.2 | 15.5 | 16.5 |
| Total Unemployment (000) | 385.5 | 379.4 | 428.2 | 459.8 | 447.9 | 441.7 | 467.2 | 467.8 |
| Unemployment Rate (%) | 5.1 | 4.9 | 5.7 | 5.9 | 5.8 | 5.6 | 6.0 | 5.8 |
| Male Unemployment Rate (%) | 5.4 | 5.2 | 6.1 | 6.6 | 5.8 | 5.7 | 5.5 | 5.4 |
| Female Unemployment Rate (%) | 4.7 | 4.6 | 5.2 | 5.3 | 5.8 | 5.5 | 6.6 | 6.3 |
| Long-Term (27 wks+) (% of total) | 20.4 | 17.2 | 16.5 | 16.0 | 17.0 | 14.4 | 16.9 | 13.7 |
| Average Unemployment in Weeks | 20.2 | 17.5 | 17.3 | 16.6 | 17.4 | 15.5 | 16.7 | 14.1 |
| Youth Unemployment Rate (%) | 10.1 | 10.8 | 11.8 | 12.4 | 13.0 | 12.5 | 12.1 | 12.7 |
| 25-54 y.o. Unemployment rate (%) | 4.4 | 4.2 | 4.7 | 5.0 | 4.7 | 4.5 | 5.2 | 4.8 |
| 55+ y.o. Unemployment rate (%) | 3.9 | 3.5 | 5.0 | 4.9 | 4.3 | 4.2 | 4.1 | 4.1 |
| Average Weekly Wage Rate ($) | 979.94 | 1000.71 | 994.55 | 1014.32 | 1007.27 | 1035.15 | 1,004.19 | 1,048.3 |
| Average Hourly Wage Rate ($) | 26.80 | 27.48 | 27.28 | 27.90 | 27.43 | 28.25 | 27.25 | 28.45 |
Employment by Region (000)
| 2017q4 | 2018q4 | 2018q1 | 2019q1 | 2018q2 | 2019q2 | 2018q3 | 2019q3 | |
|---|---|---|---|---|---|---|---|---|
| Greater Toronto Area (GTA) | 3509.9 | 3545.4 | 3,466.6 | 3,563.5 | 3538.8 | 3659.1 | 3535.7 | 3,704.3 |
| Central | 1656.4 | 1696.3 | 1,598.5 | 1,650.7 | 1646.6 | 1699.4 | 1686.1 | 1,698.7 |
| Southwestern | 789.5 | 790.3 | 775.2 | 772.4 | 801.3 | 797.0 | 810.3 | 798.0 |
| Eastern | 908.2 | 916.1 | 905.4 | 931.6 | 924.4 | 962.8 | 917.9 | 979.3 |
| Northern | 349.3 | 354.5 | 336.6 | 350.0 | 358.0 | 353.8 | 365.4 | 354.8 |
Unemployment Rate by Region (%)
| 2017q4 | 2018q4 | 2018q1 | 2019q1 | 2018q2 | 2019q2 | 2018q3 | 2019q3 | |
|---|---|---|---|---|---|---|---|---|
| Greater Toronto Area (GTA) | 5.4 | 5.5 | 5.7 | 6.4 | 6.4 | 5.9 | 6.6 | 6.2 |
| Central | 4.5 | 4.1 | 5.8 | 5.2 | 5.5 | 5.1 | 5.5 | 5.5 |
| Southwestern | 5.1 | 4.4 | 5.9 | 6.1 | 5.0 | 4.8 | 5.5 | 6.2 |
| Eastern | 4.8 | 4.6 | 5.0 | 5.2 | 4.8 | 5.2 | 5.1 | 5.0 |
| Northern | 5.3 | 5.5 | 6.6 | 6.1 | 5.9 | 6.8 | 5.5 | 5.7 |
Total Employment by CMA (000)
Greater Toronto Area
| 2017q4 | 2018q4 | 2018q1 | 2019q1 | 2018q2 | 2019q2 | 2018q3 | 2019q3 | |
|---|---|---|---|---|---|---|---|---|
| Toronto | 3351.0 | 3380.9 | 3,305.7 | 3,393.6 | 3363.4 | 3492.2 | 3361.9 | 3,545.3 |
| Oshawa | 211.0 | 219.5 | 211.9 | 222.9 | 228.6 | 227.0 | 222.4 | 214.8 |
Central Ontario
| 2017q4 | 2018q4 | 2018q1 | 2019q1 | 2018q2 | 2019q2 | 2018q3 | 2019q3 | |
|---|---|---|---|---|---|---|---|---|
| Hamilton | 423.3 | 420.7 | 407.7 | 415.1 | 414.3 | 415.4 | 412.4 | 423.1 |
| Kitchener | 287.4 | 302.3 | 276.6 | 295.6 | 286.5 | 306.3 | 303.1 | 303.4 |
| St. Catharines-Niagara | 198.5 | 201.8 | 195.4 | 192.4 | 204.4 | 196.0 | 205.1 | 203.1 |
| Peterborough | 61.0 | 66.5 | 59.5 | 62.2 | 62.0 | 62.3 | 66.3 | 60.7 |
| Brantford | 74.9 | 71.8 | 70.8 | 75.5 | 68.5 | 80.9 | 68.9 | 80.7 |
| Guelph | 91.0 | 92.9 | 87.0 | 94.4 | 86.8 | 95.3 | 88.6 | 91.8 |
| Barrie | 117.9 | 119.1 | 106.3 | 114.9 | 112.3 | 117.9 | 120.9 | 119.2 |
Eastern Ontario
| 2017q4 | 2018q4 | 2018q1 | 2019q1 | 2018q2 | 2019q2 | 2018q3 | 2019q3 | |
|---|---|---|---|---|---|---|---|---|
| Ottawa (Ontario part) | 550 | 553.7 | 552.3 | 564.9 | 567.2 | 575.2 | 557.3 | 606.2 |
| Kingston | 88 | 85.1 | 85.5 | 86.1 | 87.3 | 91.2 | 87.9 | 87.5 |
Southwestern Ontario
| 2017q4 | 2018q4 | 2018q1 | 2019q1 | 2018q2 | 2019q2 | 2018q3 | 2019q3 | |
|---|---|---|---|---|---|---|---|---|
| London | 242.5 | 247.8 | 245.8 | 246.5 | 257.9 | 244.9 | 260.3 | 251.9 |
| Windsor | 164.3 | 169.1 | 160.9 | 171.5 | 164.2 | 174.4 | 163.7 | 168.6 |
Northern Ontario
| 2017q4 | 2018q4 | 2018q1 | 2019q1 | 2018q2 | 2019q2 | 2018q3 | 2019q3 | |
|---|---|---|---|---|---|---|---|---|
| Sudbury | 82.1 | 84.6 | 78.0 | 84.9 | 80.8 | 85.8 | 82.2 | 85.0 |
| Thunder Bay | 61.2 | 61.7 | 62.2 | 59.8 | 65.7 | 62.3 | 65.3 | 62.6 |
Note: All estimates in this appendix are based on Statistics Canada’s Labour Force Survey.
Footnotes
- footnote[1] Back to paragraph This economic region closely matches the GTA, the main exception being that it excludes the city of Burlington.
- footnote[2] Back to paragraph Real wages are based on nominal wages deflated by the Consumer Price Index (CPI) for all items. Self-employment is excluded.
- footnote[3] Back to paragraph Year-over-year comparison (between third quarters of 2018 and 2019) is in nominal dollars.
- footnote[4] Back to paragraph Measured as an increase in the all-items Consumer Price Index for Ontario between July and September of 2018 and July and September of 2019.