January to December, 2020
Introduction
About the Ontario Employment Report – January to December, 2020
The Ontario Employment Report is released four times a year and provides an assessment of the current trends and developments in the Ontario labour market. The Ontario Employment Report is a companion report to the Ontario Economic Accounts, which provides an overall assessment of the current state of the Ontario economy.
The report for the fourth quarter of 2020 provides an assessment of Ontario’s labour market for the entire year, comparing annual averages, while the approach used in earlier quarterly reports was to measure year-over-year changes in quarterly data.
Methodological note
In the current issue, year-over-year change represents change between 2019 and 2020. Longer-term trends are included for select labour market characteristics and provide historical context.
All estimates in the report are based on Statistics Canada’s Labour Force Survey (LFS), which measures the current state of the national, provincial and territorial labour market. The LFS is based on a household survey carried out monthly by Statistics Canada in reference weeks of the month. All estimates in this report include the population aged 15 years and over, unless otherwise indicated.
Impact of COVID‑19 on the labour market
Ontario's labour market has experienced unprecedented changes in 2020 as a result of the COVID‑19 pandemic. Beginning in mid-March, a number of travel restrictions, business closures and physical distancing measures were put in place by various levels of government to help contain the spread of COVID‑19 and protect the health of Ontarians. As a result of the pandemic, there was a sharp decline in employment between February to May, which was more severe compared to previous recessions.
In June, employment started to rebound reflecting the early stages of reopening the provincial economy. Employment growth slowed from September to December as Ontario introduced additional targeted public health measures to help stop the spread of COVID‑19 and save lives.
The report compares estimates of annual averages in the previous two years since there was a lot of volatility in the monthly employment data in 2020. While employment declined by 4.8% in 2020 compared to 2019, it decreased by 15.1% from February through May and then increased by 11.8% from May through December relative to February levels.
Overview
Key labour market indicators, 2020
Employment:
- -355,300 net jobs in 2020, year-over-year
- -202,900 net full-time jobs in 2020, year-over-year
Unemployment rate:
- 9.6% in 2020
Participation rate:
- 63.6% in 2020
Employment change by province, 2020
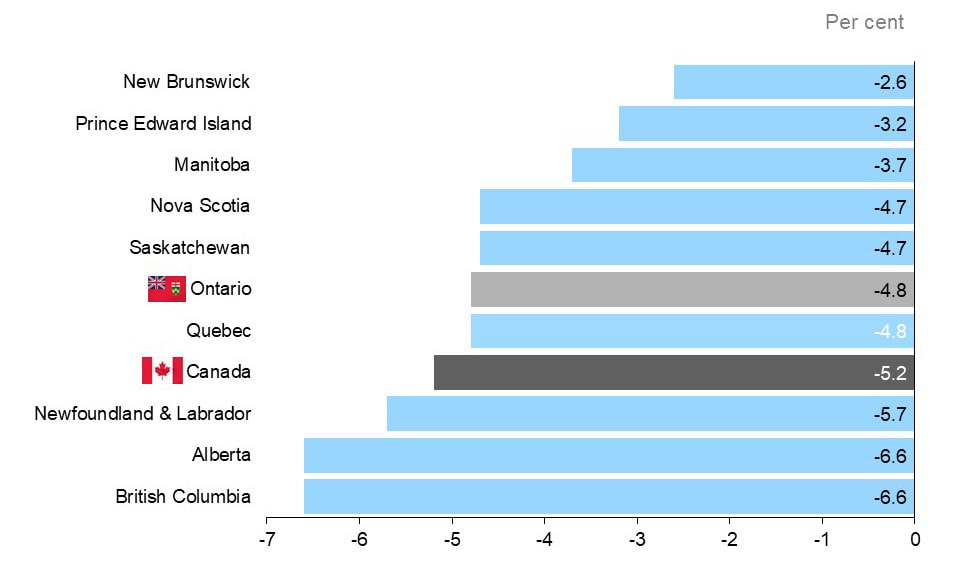
The horizontal bar chart shows the per cent annual employment change for the ten Canadian provinces and Canada. Employment decreased the most in British Columbia (-6.6%) and Alberta (-6.6%) and the least in New Brunswick (-2.6%). Ontario’s employment decreased by 4.8%, slightly less than the decrease in Canada employment (-5.2%).
In 2020, Ontario’s employment decreased by 4.8% (-355,300), less than the Canadian average (-5.2%) and the largest annual decline on record.
Ontario’s labour market, 1976-2020
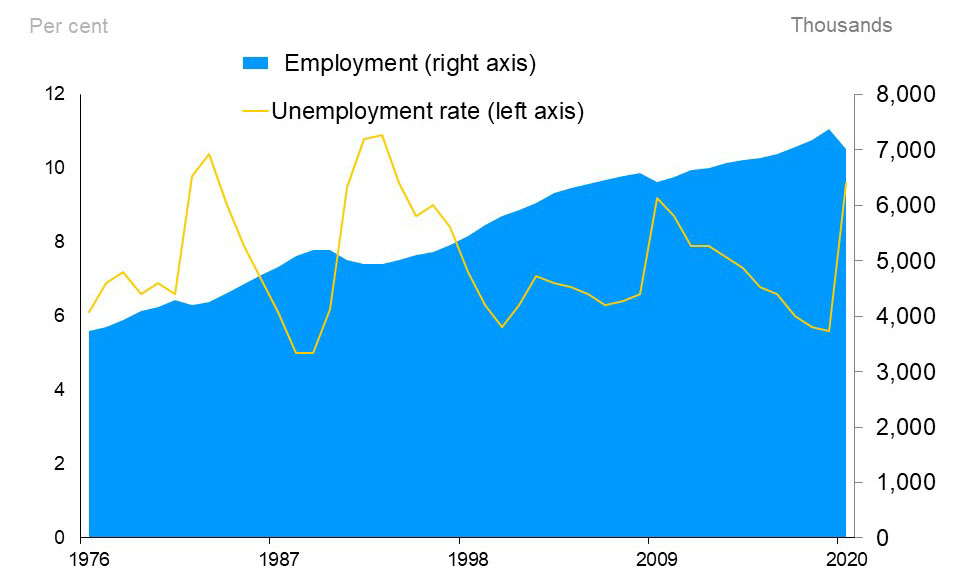
The combination line and area chart show Ontario’s unemployment rate (line chart) and employment (area chart) from 1976 to 2020. Ontario’s unemployment rate has fluctuated reaching highs of 10.4% in 1983, 10.9% in 1993 and 9.2% in 2009 and lows of 5.0% in 1988 and 1989, 5.7% in 2000 and 5.6% in 2019. Employment in Ontario has risen steadily since 1976 with a few exceptions when employment contracted during recessions. The decrease in employment from 2019 to 2020 was sharper compared to previous recessions.
In 2020, the unemployment rate in Ontario increased to 9.6%, slightly above the Canadian rate (9.5%) and the highest rate since 1995. The annual increase in the unemployment rate (+4.0 percentage points) was the highest on record.
The participation rate declined by 1.3 percentage points to 63.6%, below the Canadian rate (64.1%).
Highlights in 2020
- Employment decreased among both part-time and full-time workers.
- The private sector and the self-employed experienced the largest decline in employment.
- Employment declined in both the services-producing and goods-producing industries with the largest losses in accommodation and food services, along with wholesale and retail trade.
- Employment declined in all the five regions, with the Greater Toronto Area recording the largest employment decreases and highest unemployment rate.
- Part-time and low-wage workers, recent immigrants, those without a high school diploma, youth, and women experienced relatively larger employment declines.
- Weekly hours worked decreased for both full- and part-time workers and there were substantially more workers working reduced hours.
- The average hourly wage of employees was $30.24, an increase of 6.3% after accounting for inflation.
Type of work
Employment change by full-time, part-time status, 2020
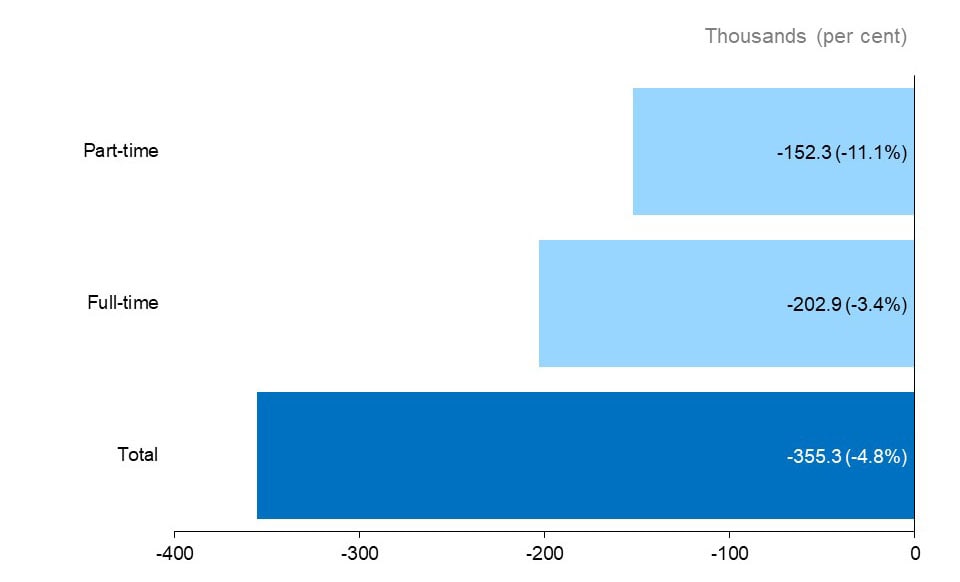
The horizontal bar chart shows Ontario’s annual employment change by full-time and part-time status, measured in thousands of jobs with percentage changes in brackets. Total employment decreased by 355,300 (-4.8%), with full-time employment decreasing by 202,900 (-3.4%), and part-time employment decreasing by 152,300 (-11.1%).
In 2020, employment in Ontario decreased by 4.8%, which reflects declines in both full-time (-202,900, -3.4%) and part-time positions (-152,300, -11.1%).
Employment change by employment sector, 2020
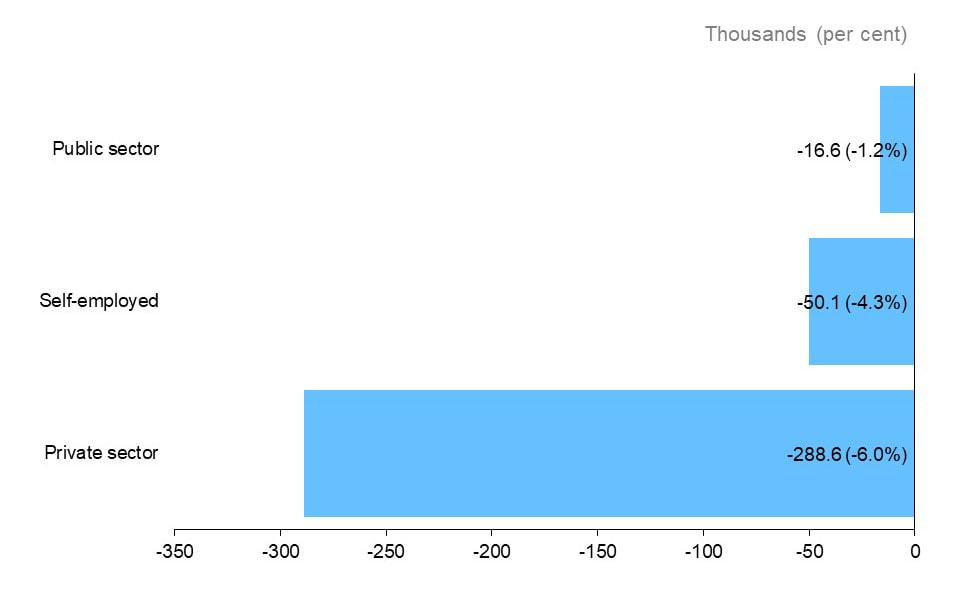
The horizontal bar chart shows Ontario’s annual employment change for the private sector, public sector and self-employment, measured in thousands of jobs with percentage changes in brackets. Employment decreased in the private sector (-288,600, -6.0%), public sector (-16,600, -1.2%), and for the self-employed (-50,100, -4.3%).
The private sector had the largest decline in employment (-288,600, -6.0%), followed by self-employment (-50,100, -4.3%) and the public sector
Industry and occupation
In 2020, employment declined in both goods-producing (-56,600, -3.9%) and services-producing (-298,800, -5.1%) industries.
Employment change by industry, goods-producing industries, 2020
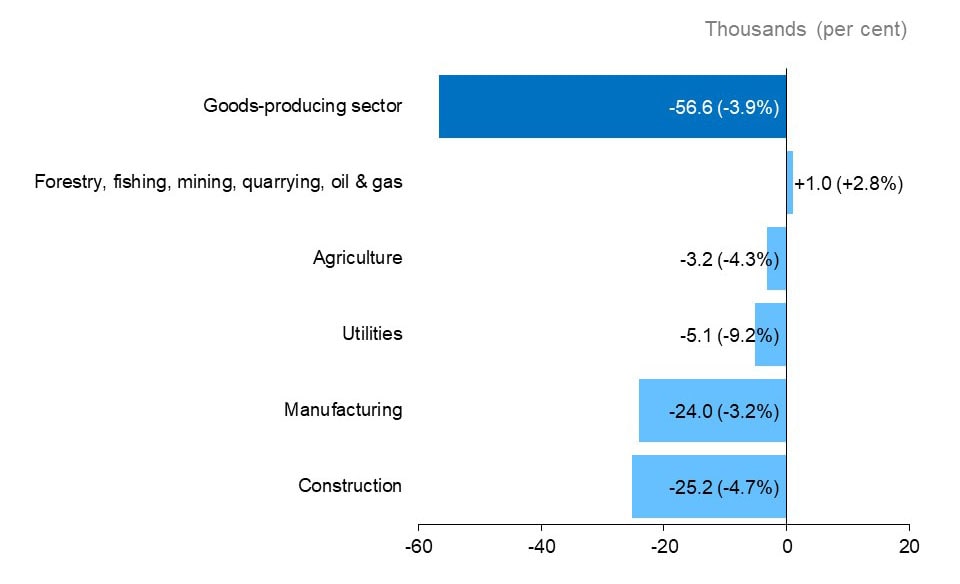
The horizontal bar chart shows Ontario’s annual employment change by industry for goods-producing industries, measured in thousands of jobs with percentage changes in brackets. Employment in all goods-producing industries declined except for forestry, fishing, mining, quarrying, oil and gas which increased by 1,000 (+2.8%). Construction had the largest decline in employment (-25,200, -4.7%), followed by manufacturing (-24,000, -3.2%), utilities (-5,100, -9.2%) and agriculture (-3,200, -4.3%). The overall employment in goods-producing industries decreased by 56,600 (-3.9%).
Among goods-producing industries, forestry, fishing, mining, quarrying, oil and gas was the only industry to add jobs (+2.8%). Construction (-4.7%) saw the largest decrease in employment, followed by manufacturing (-3.2%).
Employment change by industry, services-producing industries, 2020
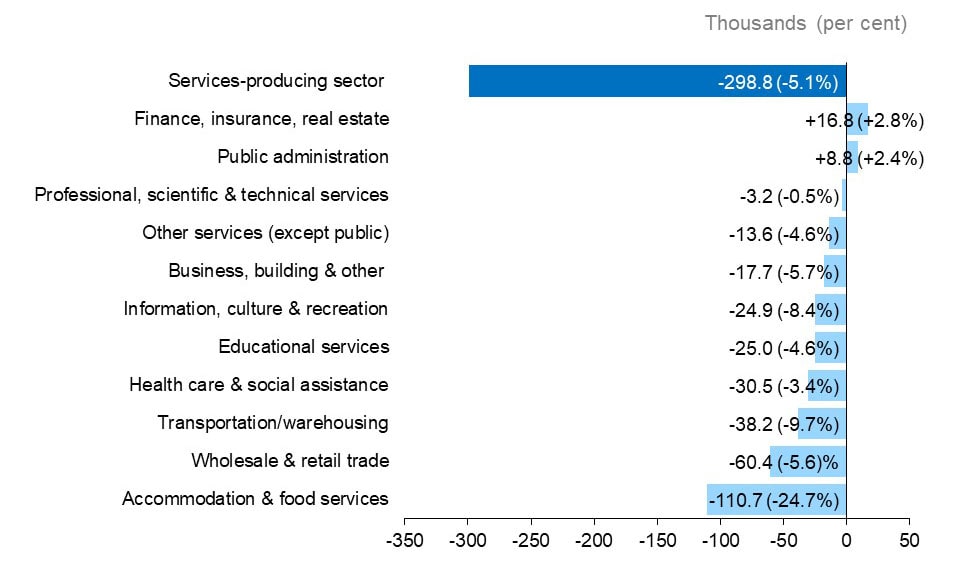
The horizontal bar chart shows Ontario’s annual employment change by industry for services-producing industries, measured in thousands of jobs with percentage changes in brackets. Most of the services-producing industries experienced decline in employment. Finance, insurance, real estate, rental and leasing (+16,800, +2.8%) and public administration (+8,800, +2.4%) were the only industries that gained jobs over this period. The largest employment decline occurred in accommodation and food services (-110,700, -24.7%), followed by wholesale and retail trade (-60,400, -5.6%) and transportation and warehousing (-38,200, -9.7%). The overall employment in services-producing industries decreased by 298,800 (-5.1%).
Among services-producing industries, finance, insurance, real estate, rental and leasing (+2.8%) and public administration (+2.4%) gained jobs, while the other major industries registered employment declines. Accommodation and food services had the largest decline in employment (-24.7%), followed by wholesale and retail trade (-5.6%).
Employment change by occupational group, 2020
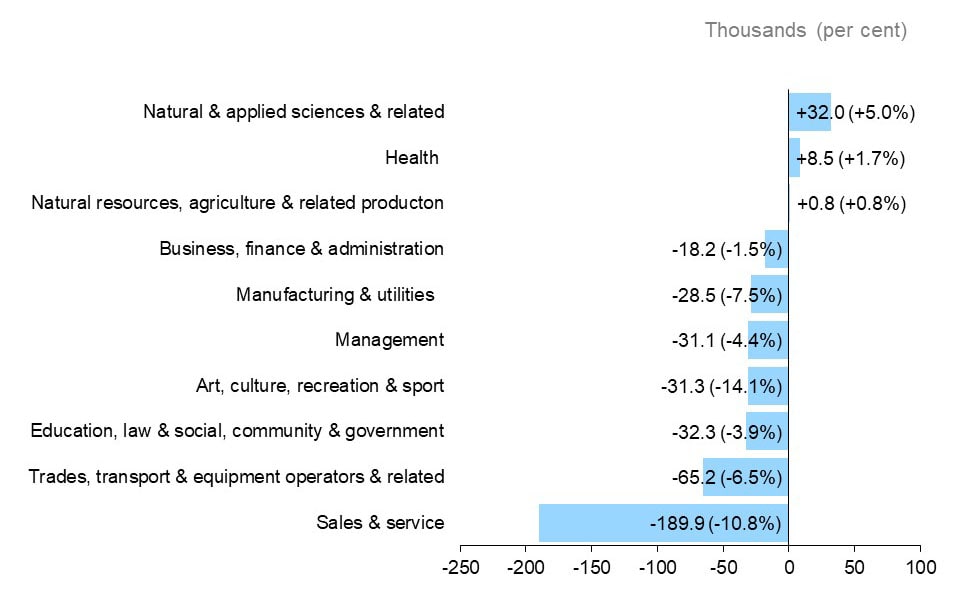
The horizontal bar chart shows Ontario’s annual employment change by broad occupational group, measured in thousands of jobs with percentage changes in brackets. Employment in natural and applied sciences and related occupations (+32,000, +5.0%), health occupations (+8,500, +1.7%) and natural resources, agriculture and related occupations (+800, +0.8%) increased. Employment in the remaining seven occupational groups declined, with sales and service occupations (-189,900, -10.8%), trade, transport and equipment operators and related occupations (-65,200, -6.5%) and occupations in education, law and social, community and government services (-32,300, -3.9%) experiencing the largest declines.
Among broad occupational groups, natural and applied sciences (+5.0%) saw the largest increase in employment followed by health (+1.7%) and natural resources and agriculture (+0.8%). All other occupational groups experienced a decline in employment, with job losses concentrated in sales and service (-10.8%) and trades, transport and equipment operators and related occupations (-6.5%).
Regions
Ontario regions
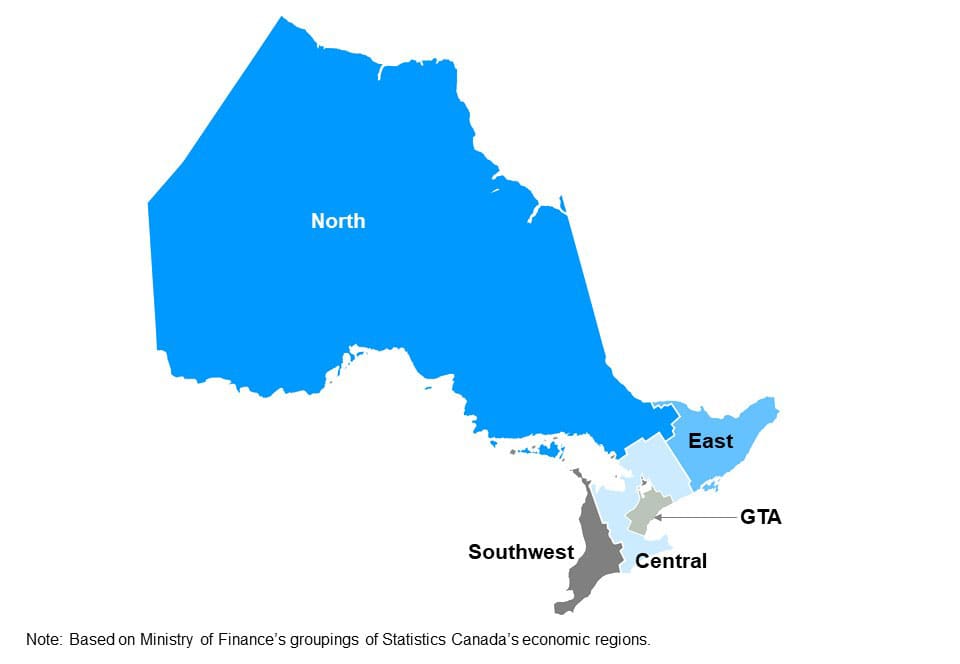
The map shows Ontario’s five regions: Northern Ontario, Eastern Ontario, Southwestern Ontario, Central Ontario and the Greater Toronto Area. This map is based on Ministry of Finance’s groupings of Statistics Canada’s economic regions.
Employment change by region, 2020
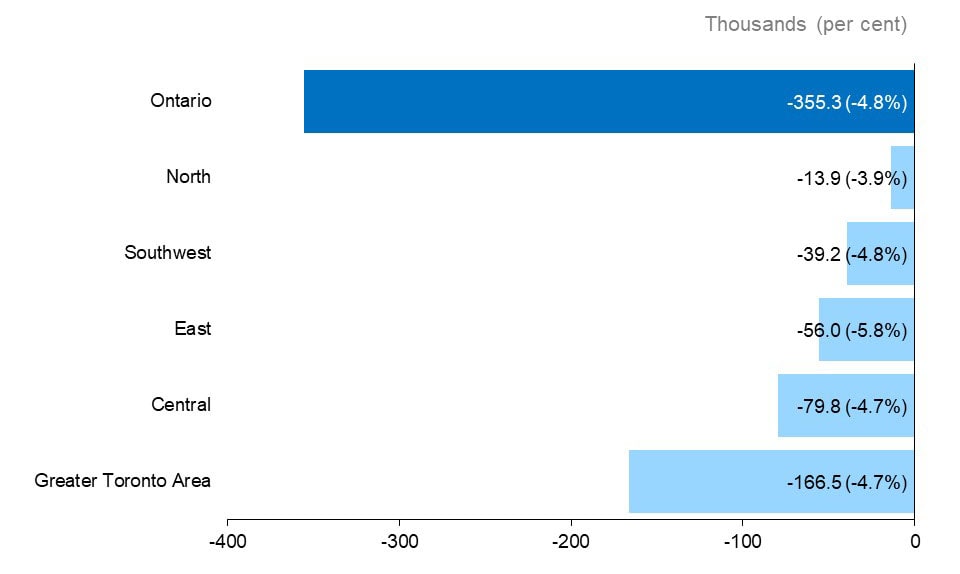
The horizontal bar chart shows Ontario’s annual employment change in the five Ontario regions (Northern Ontario, Eastern Ontario, Southwestern Ontario, Central Ontario and the Greater Toronto Area (GTA)), measured in thousands of jobs with percentage changes in brackets. Employment declined in all Ontario regions in 2020. Employment declined the most in the GTA (-166,500, -4.7%), followed by Central Ontario (-79,800, -4.7%), Eastern Ontario (-56,000, -5.8%), Southwestern Ontario (-39,200, -4.8%), and Northern Ontario (-13,900, -3.9%). The overall employment in Ontario declined by 355,300 (-4.8%).
In 2020, employment declined across all Ontario regions. The Greater Toronto Area (GTA) experienced the largest employment decrease (-166,500); however, Eastern Ontario experienced the greatest percentage decline in employment (-5.8%), followed by Southwestern Ontario (-4.8%).
Unemployment rate by region, 2020
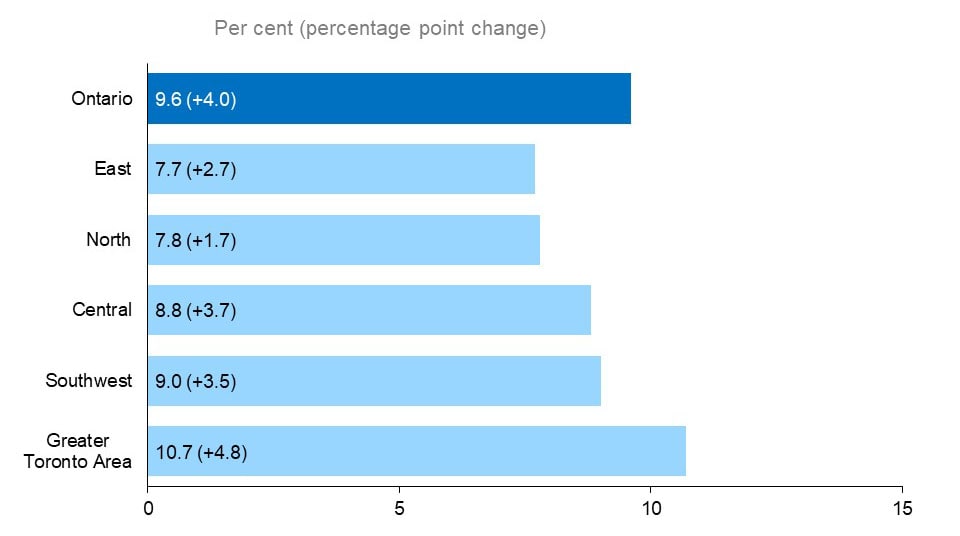
The horizontal bar chart shows unemployment rates by Ontario region in 2020, measured in per cent with annual percentage point changes in brackets. The Greater Toronto Area had the highest unemployment rate at 10.7% (+4.8 p.p.), followed by Southwestern Ontario (9.0%, +3.5 p.p.), Central Ontario (8.8%, +3.7 p.p.), Northern Ontario (7.8%, +1.7 p.p.) and Eastern Ontario (7.7%, +2.7 p.p.). Ontario’s unemployment rate in 2020 was 9.6% (+4.0 p.p.).
In 2020, the unemployment rate increased in every region. The GTA had the highest unemployment rate (10.7%), while Eastern Ontario had the lowest unemployment rate (7.7%).
Participation rate by region, 2020
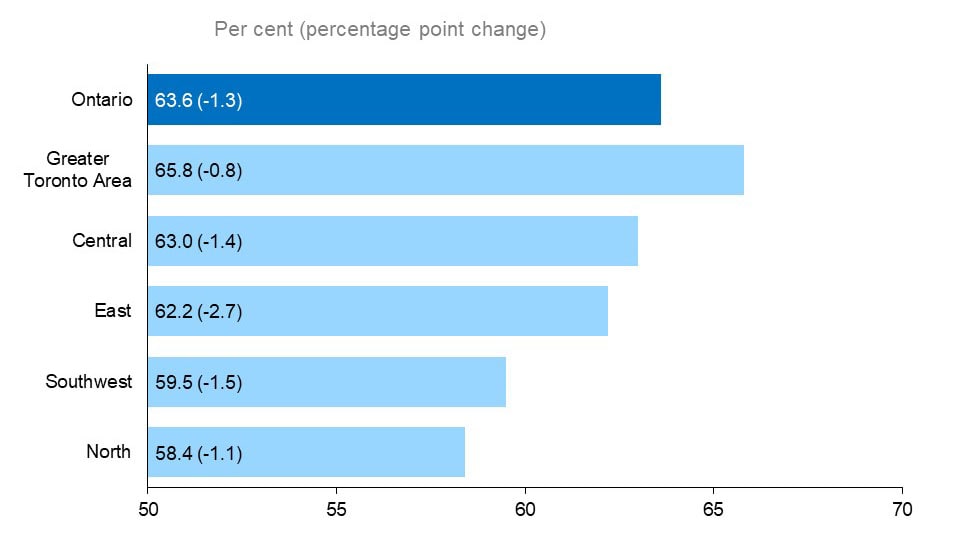
The horizontal bar chart shows participation rates by Ontario region in 2020, measured in per cent with annual percentage point changes in brackets. The Greater Toronto Area had the highest participation rate at 65.8% (-0.8 p.p.), followed by Central Ontario (63.0%, -1.4 p.p.), Eastern Ontario (62.2%, -2.7 p.p.), Southwestern Ontario (59.5%, -1.5 p.p.) and Northern Ontario (58.4%, -1.1 p.p.). The overall participation rate for Ontario was 63.6% (-1.3 p.p.).
In 2020, the participation rate decreased in every region. The GTA had the highest participation rate (65.8%), while Northern Ontario had the lowest participation rate (58.4%).
Demographic groups
Employment change by age group and gender, 2020
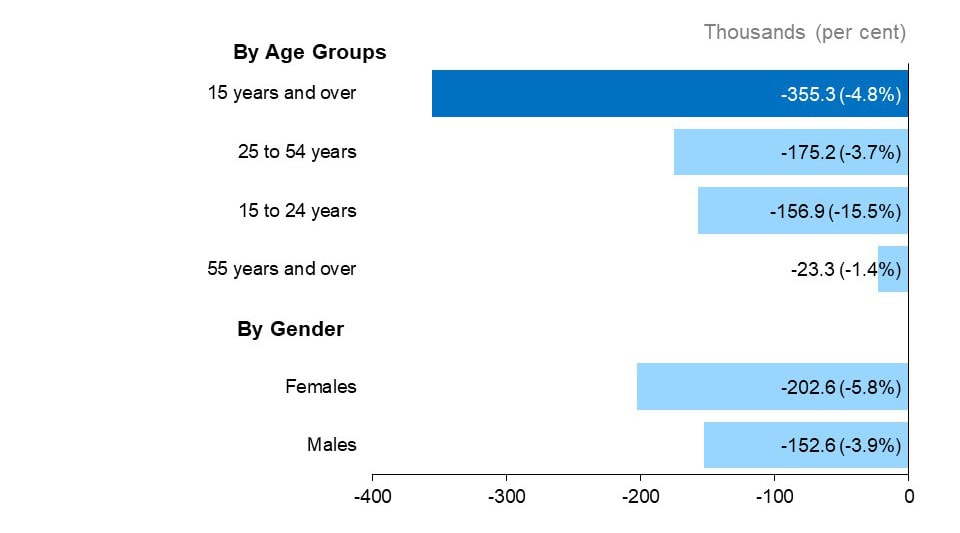
The horizontal bar chart shows Ontario’s annual employment change for three age groups, as well as by gender, compared to the overall population, measured in thousands of jobs with percentage changes in brackets. Employment declined among workers in all age groups. Ontarians aged 25 to 54 years had the greatest number of job losses (-175,200, -3.7%). Employment for Ontarians aged 15 to 24 years declined by 156,900 (-15.5%) and for Ontarians aged 55 years and over declined by 23,300 (-1.4%). Total employment (for population aged 15 and over) declined by 355,300 (-4.8%). Male employment decreased by 152,600 (-3.9%) and female employment declined by 202,600 (-5.8%).
In 2020, employment declines occurred in all age groups and for both females and males. Females (-5.8%) experienced a greater decline in employment compared to males (-3.9%). Employment levels decreased the most for core-aged workers, aged 25 to 54 years, (-175,200, -3.7%), but youth registered the greatest percentage decline in employment (-15.5%).
Employment change by education level, 25 to 54 years, 2020
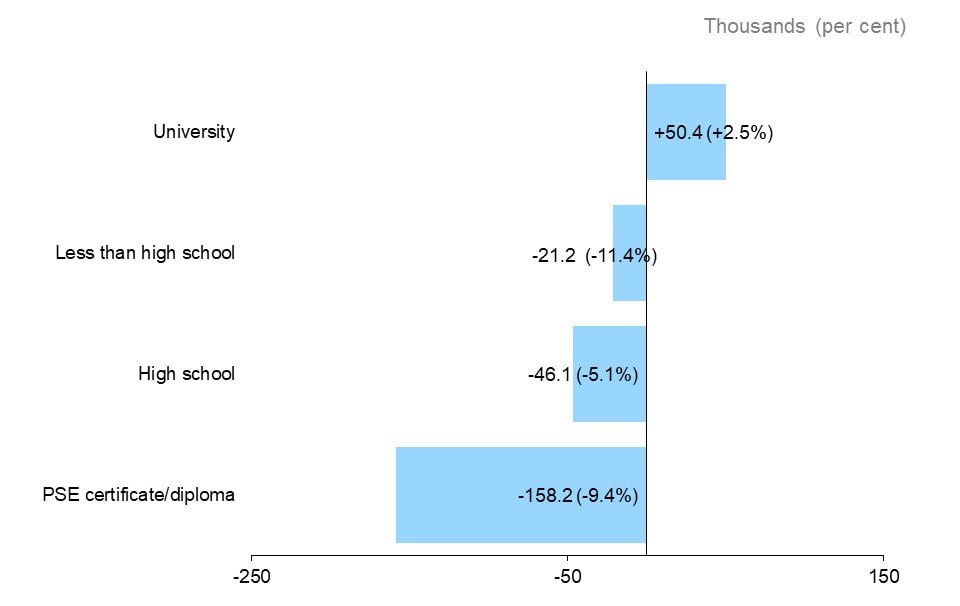
The horizontal bar chart shows Ontario’s annual employment change by education level for the core-aged population (25 to 54 years old) in 2020, measured in thousands of jobs with percentage changes in brackets. Those with a university degree were the only educational group to experience an increase in employment (+50,400, +2.5%). Those with a postsecondary certificate or diploma registered the greatest employment decline (-158,200, -9.4%), followed by high school graduates (-46,100, -5.1%), and those without a high school diploma (-21,200, -11.4%).
Among the core-aged population, employment declined for all levels of education, except for university graduates (+2.5%). Those with less than a high school credential experienced the greatest percentage decline in employment (-11.4%).
Employment change by immigrant status, 25 to 54 years, 2020
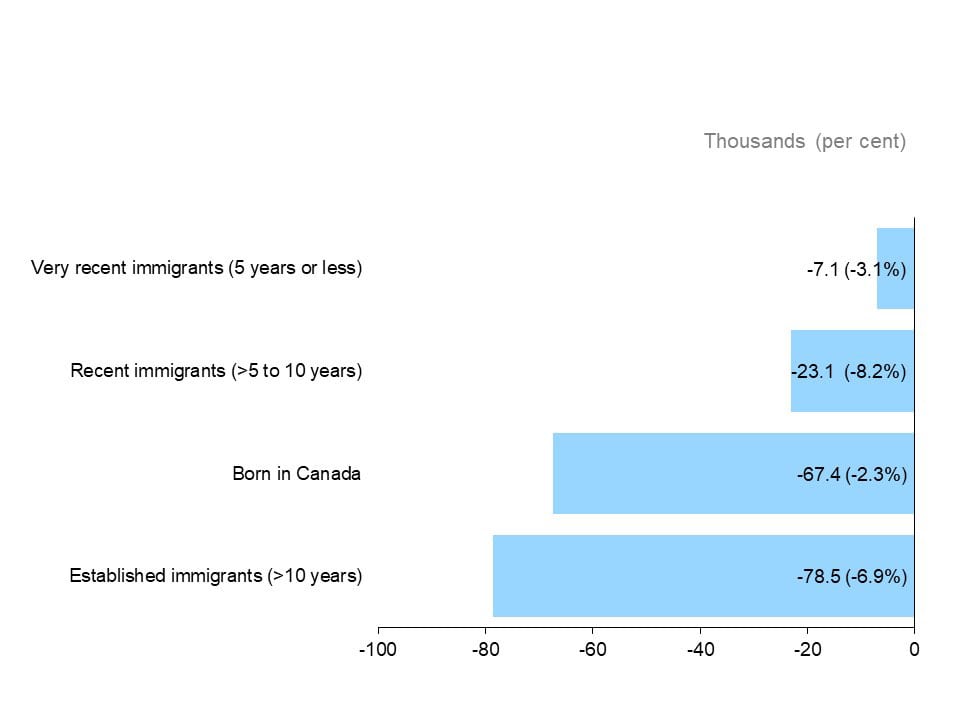
The horizontal bar chart shows Ontario’s annual employment change by immigrant status for the core-aged population (25 to 54 years old) in 2020, measured in thousands of jobs with percentage changes in brackets. All groups by immigrant status experienced employment declines, with the largest decrease for established immigrants who landed more than 10 years earlier (-78,500, -6.9%), followed by those born in Canada (-67,400, -2.3%), recent immigrants who landed more than 5 to 10 years earlier (-23,100, -8.2%) and very recent immigrants who landed 5 years or less earlier (-7,100, -3.1%).
In 2020, both landed immigrants and those born in Canada experienced a decline in employment, with core-aged recent immigrants recording the greatest percentage decline in employment (-8.2%), followed by established immigrants (-6.9%), very recent immigrants (-3.1%), and those born in Canada (-2.3%).
Wages
Real hourly wage growth by type of work, 2020
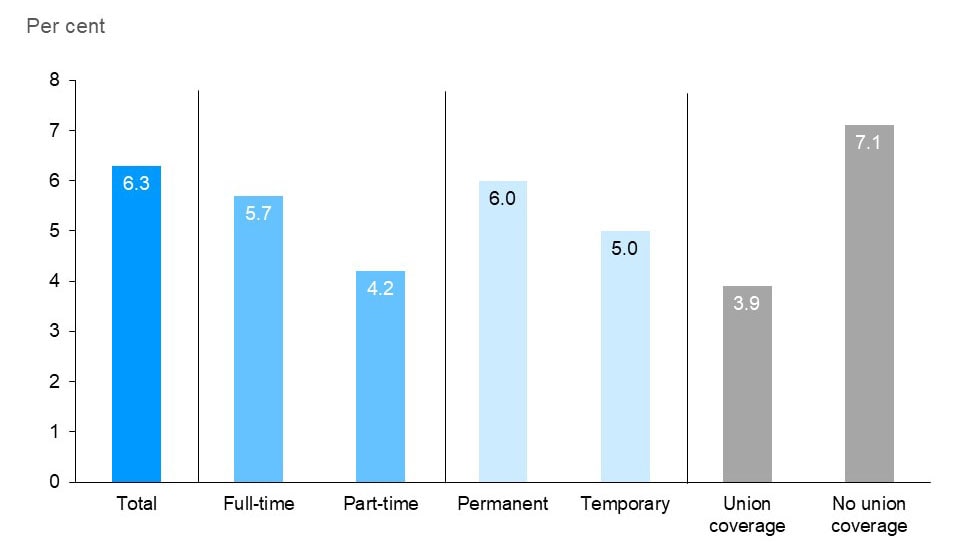
The vertical bar chart shows the annual change in Ontario’s real hourly wages by type of work in 2020, measured in per cent. The average hourly wage increased by 6.3%. Hourly wages increased for both full-time (+5.7%) and part-time employees (+4.2%); permanent (+6.0%) and temporary employees (+5.0%) and employees with union coverage (+3.9%) and those without union coverage (+7.1%).
In 2020, the average hourly wage of Ontario employees was $30.24 per hour, an increase of 7.0% or 6.3% in real terms
While the average wage increases in 2020 were in part due to some workers getting higher pay, they were also a result of the change in the composition of employment. Employment decreases in 2020 were concentrated in relatively lower-paying industries, such as accommodation and food services and wholesale and retail trade.
Average hourly wage by occupational group, 2020
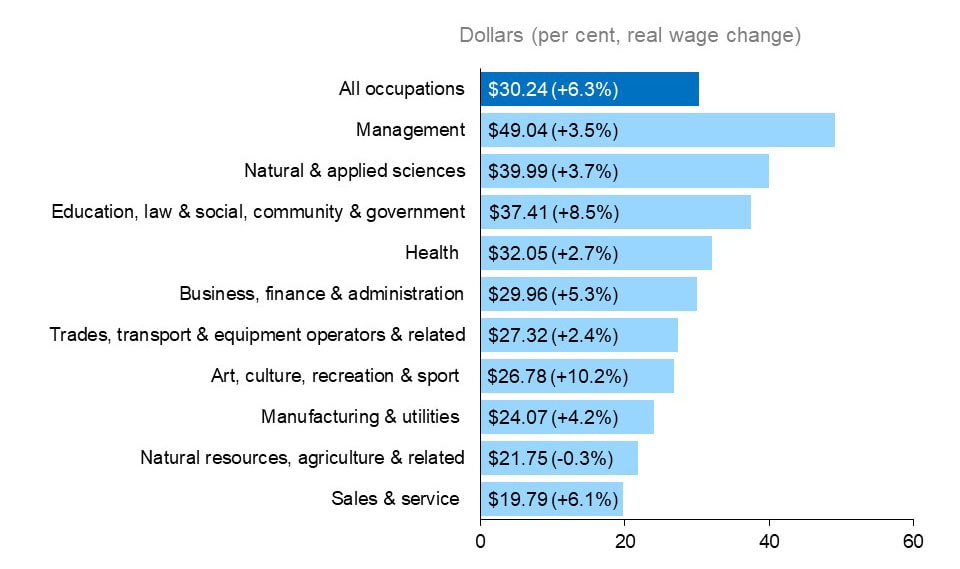
The horizontal bar chart shows average hourly wage rates in 2020, measured in dollars with per cent growth in real wages in brackets, by occupational group. In 2020, the average hourly wage rate for Ontario was $30.24 (+6.3%). The highest average hourly wage rate was for management occupations at $49.04 (+3.5%); followed by natural and applied sciences and related occupations at $39.99 (+3.7%); and occupations in education, law and social, community and government services at $37.41 (+8.5%). The lowest average hourly wage rate was for sales and service occupations at $19.79 (+6.1%).
In 2020, employees in management occupations had the highest average hourly wage ($49.04), followed by natural and applied sciences and related occupations ($39.99) and occupations in education, law and social, community and government services ($37.41). Employees in sales and service occupations had the lowest average hourly wage ($19.79).
Employment change by hourly wage, 2020
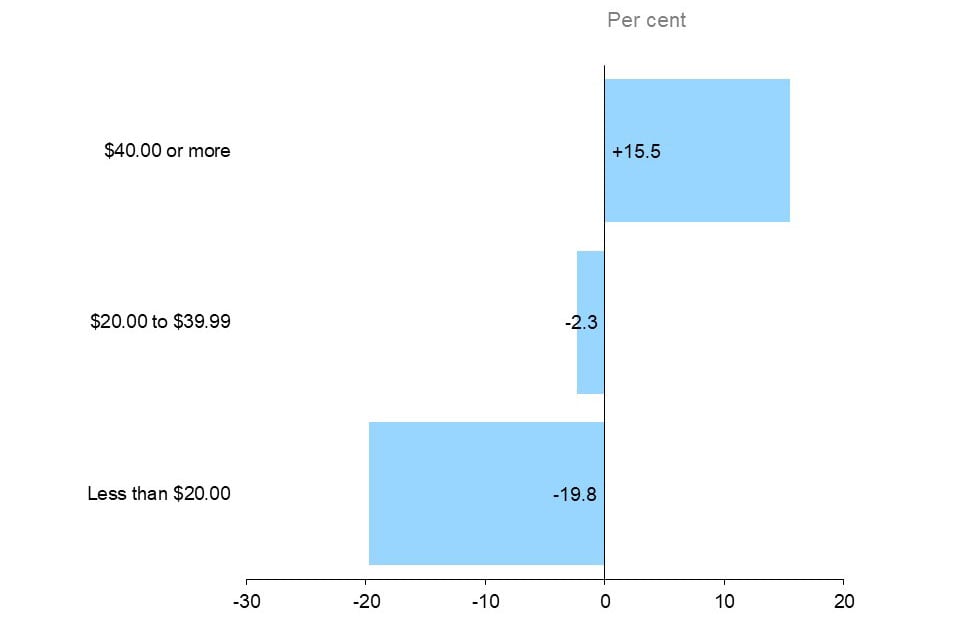
The horizontal bar chart shows Ontario’s annual employment change by hourly wage in 2020, measured in per cent. Employment of those earning at least $40 per hour increased by 15.5%, while employment of those earning less than $20 per hour (-19.8%) and those earning hourly wages of $20.00 to $39.99 (-2.3%) decreased.
Employment of workers earning less than $40 per hour was lower and there were more workers earning $40 or more per hour (+15.5%). Employment of those earning less than $20 per hour decreased the most (-19.8%), followed by those earning $20.00 to $39.99 per hour (-2.3%).
Hours Worked
Total weekly hours worked, 1997-2020
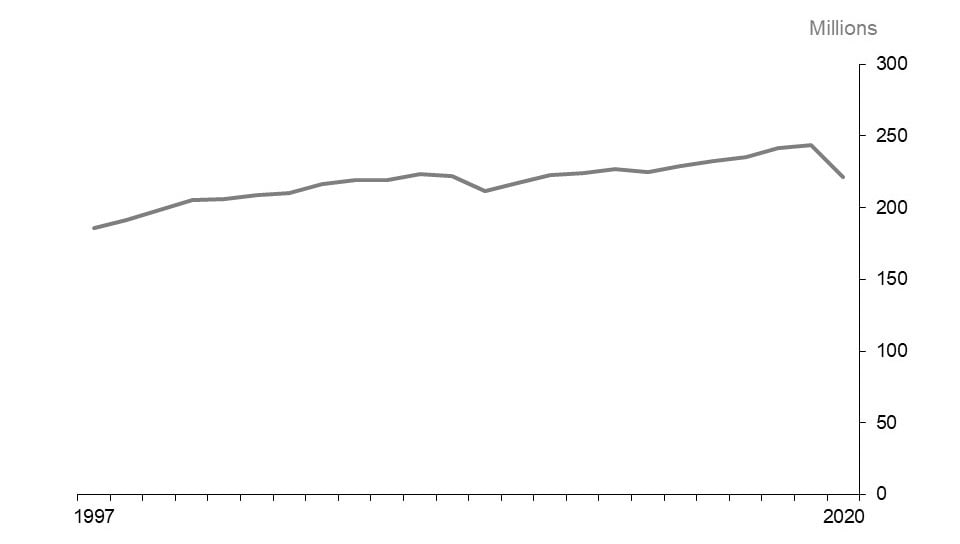
The line chart shows Ontario’s total weekly hours worked from 1997 through 2020, measured in millions of hours. Ontario’s total weekly hours have risen steadily since 1997 with a few exceptions when hours worked declined in 2009, 2014 and 2020. The decrease in total weekly hours worked from 2019 to 2020 was sharper compared to previous declines.
In 2020, total weekly hours worked
Employment by reduced hours, 1997-2020
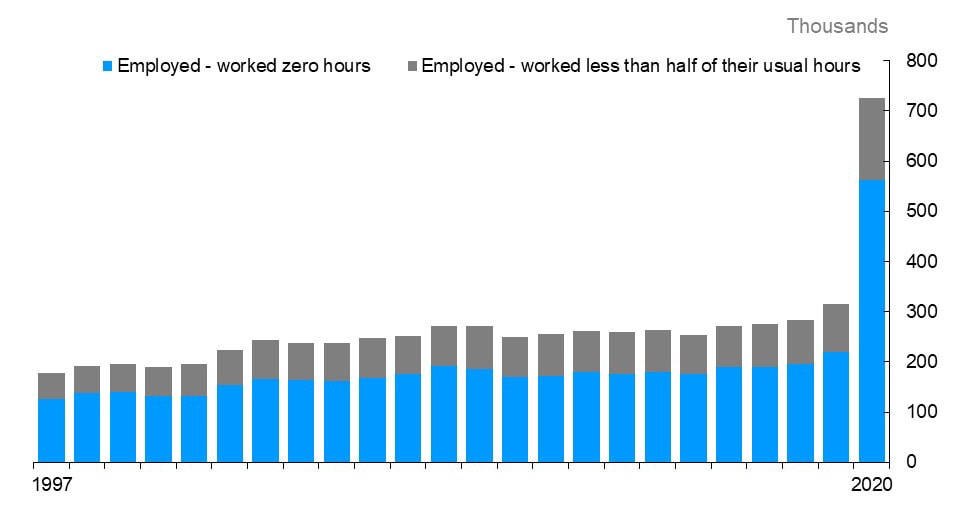
The line chart shows Ontario’s employment by reduced hours of work from 1997 through 2020, measured in thousands. Employment of those who worked zero hours in the reference week more than doubled in 2020 and employment of those who worked less than half of their usual hours in the reference week increased by over 70%.
In 2020, there were over 562,600 employees who worked zero hours,
Average actual hours worked by worker status, worked in reference week, all jobs, 2019 and 2020
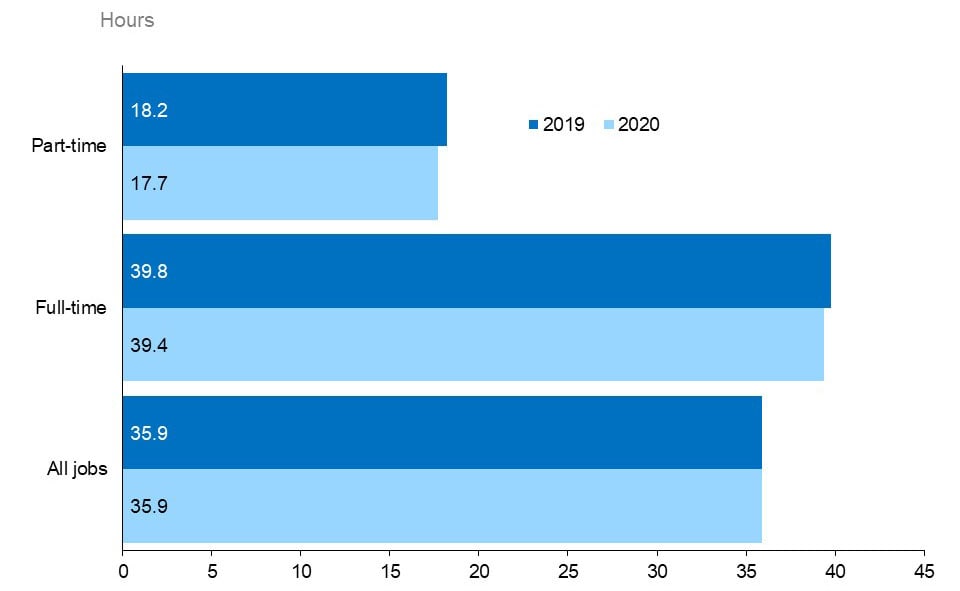
The horizontal bar chart shows the average actual hours worked in all jobs by worker status for those who worked in the reference week in 2019 and 2020. The average actual hours worked by part-time workers in all jobs were 18.2 hours in 2019 and 17.7 hours in 2020. The average actual hours worked by full-time workers in all jobs were 39.8 hours in 2019 and 39.4 hours in 2020. The average actual hours worked by all workers who worked in the reference week were 35.9 hours in both years.
Those who worked part-time worked 17.7 hours per week, a decline of 0.5 hours compared to 2019. Those who worked full-time worked 39.4 hours per week, a decline of 0.4 hours compared to 2019. However, the average total hours worked remained unchanged, in part due to the greater declines in part-time employment.
Unemployment
Unemployment rate by province, 2020
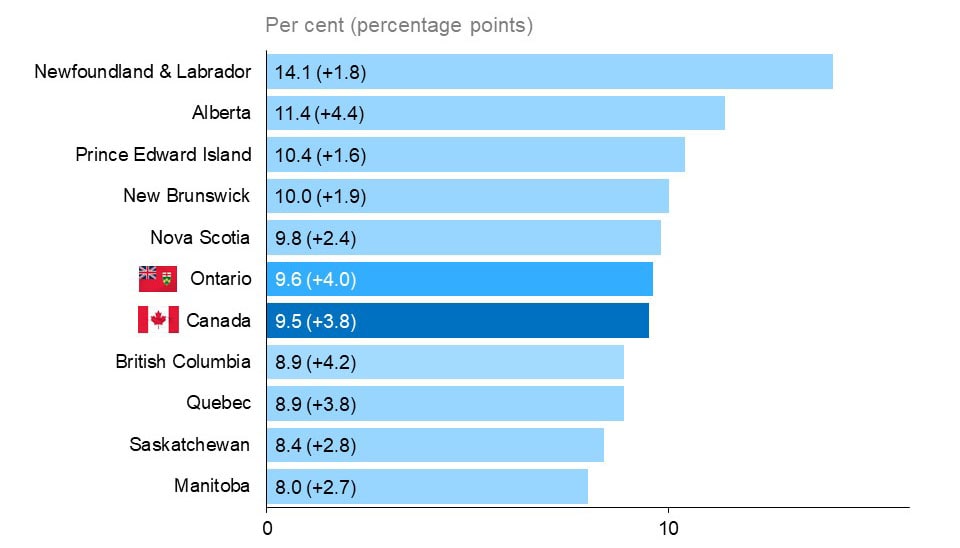
The horizontal bar chart shows the unemployment rate by province in 2020, measured in per cent with percentage point change from the previous year in brackets. Newfoundland and Labrador had the highest unemployment rate at 14.1% (+1.8 p.p.), followed by Alberta at 11.4% (+4.4 p.p.), and Prince Edward Island at 10.4% (+1.6 p.p.). Manitoba had the lowest unemployment rate at 8.0% (+2.7 p.p.), and Ontario had the fifth lowest unemployment rate at 9.6% (+4.0 p.p.), slightly above the national rate of 9.5% (+3.8 p.p.).
In 2020, all provinces experienced a substantially higher unemployment rate compared to 2019. Ontario’s unemployment rate rose to 9.6% in 2020, a 4.0 percentage points increase compared to 2019. Ontario had the fifth lowest unemployment rate among the ten provinces and was slightly above the Canadian rate of 9.5%. Manitoba had the lowest unemployment rate (8.0%) and Newfoundland and Labrador the highest (14.1%).
Unemployment rate by age group, 1997-2020
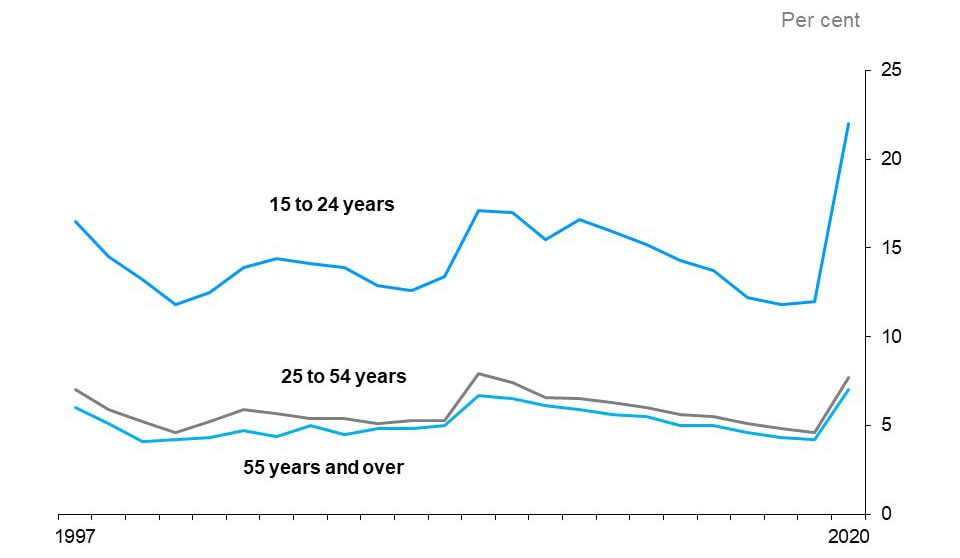
The line chart shows unemployment rates for three age groups: youth (15 to 24 years), core age (25 to 54 years) and older population (55 years and older) from 1997 to 2020. The unemployment rates of all the three age groups have increased significantly from 2019 to 2020 after gradually declining since 2009. The unemployment rates of youth have historically been higher than those of the core-aged and older population.
In 2020, the unemployment rate increased for all age groups. Youth aged 15 to 24 years had the highest unemployment rate (22.0%, +10.0 percentage points) followed by the core-aged population aged 25 to 54 years (7.7%, +3.1 percentage points) and the older population aged 55 years and over (7.0%, +2.8 percentage points).
Share of long-term unemployment, 1997-2020
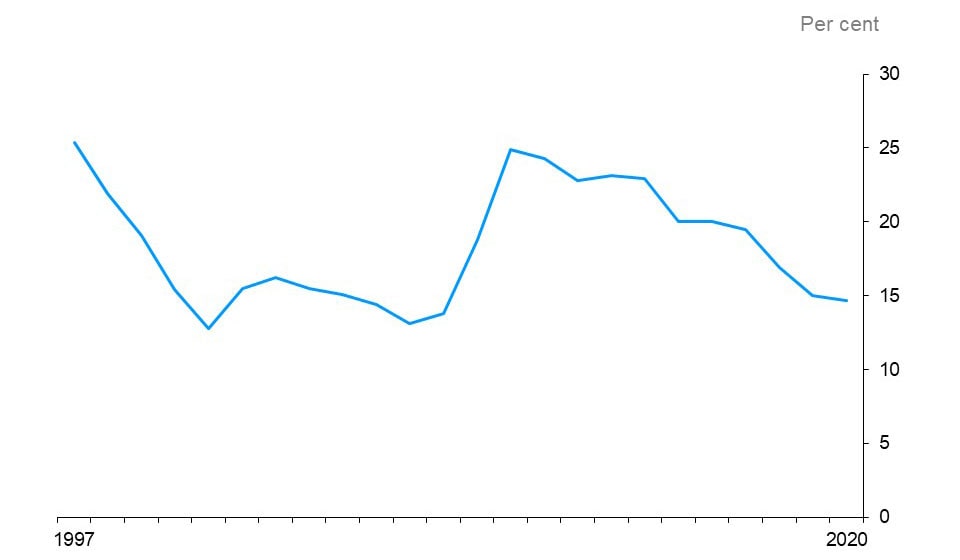
The line chart shows the share of those unemployed for long term as a share of total unemployment from 1997 to 2020, measured in per cent. The share has fluctuated in the past reaching a low of 12.9% in 2001 and a high of 24.9% in 2010. The share has been gradually declining since 2010 and has reached 14.7% in 2020.
Long-term unemployment (unemployed for 27 weeks or more) as a share of total unemployment decreased from 15.0% in 2019 to 14.7% in 2020, as most newly unemployed people were unemployed for a relatively short time. The incidence of long-term unemployment has been on a declining trend after reaching 24.9% in 2010.
The average duration of unemployment in 2020 was 15.3 weeks, 0.5 weeks lower than in 2019.
Participation rates
Participation rate by province, 2020
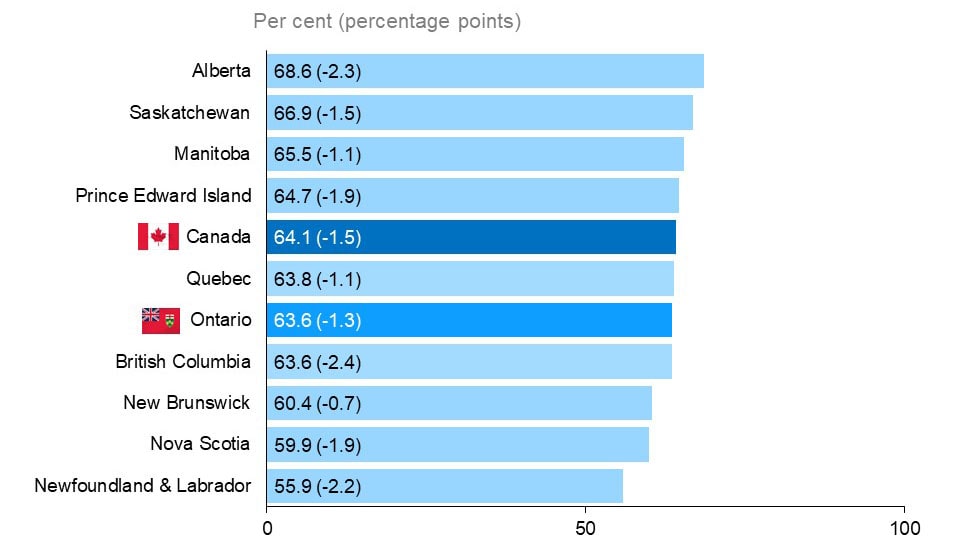
The horizontal bar chart shows the participation rate by province in 2020, measured in per cent with percentage point change from the previous year in brackets. Alberta had the highest participation rate at 68.6% (-2.3 p.p.), followed by Saskatchewan at 66.9% (-1.5 p.p.), and Manitoba at 65.5% (-1.1 p.p.). Newfoundland and Labrador had the lowest participation rate at 55.9% (-2.2 p.p.). Ontario (along with British Columbia) had the sixth highest participation rate at 63.6% (-1.3 p.p.), slightly below the national rate of 64.1% (-1.5 p.p.).
In 2020, Ontario’s participation rate for people aged 15 years and over was 63.6%, a decrease of 1.3 percentage points, compared to 2019. The participation rate in Ontario was lower than the Canadian rate by 0.5 percentage point and ranked sixth (along with British Columbia) out of the ten provinces. Participation rates in all other provinces also declined in 2020.
While Ontario’s participation rate has been on the decline since at least the early 2000s in part due to an aging population, the decrease in the participation rate in 2020 (-1.3 percentage point) was sharper compared to previous years. In 2020, the number of people who wanted work but were not part of the labour force more than doubled (+177,200, +128.4%).
Participation rate by gender, 2020
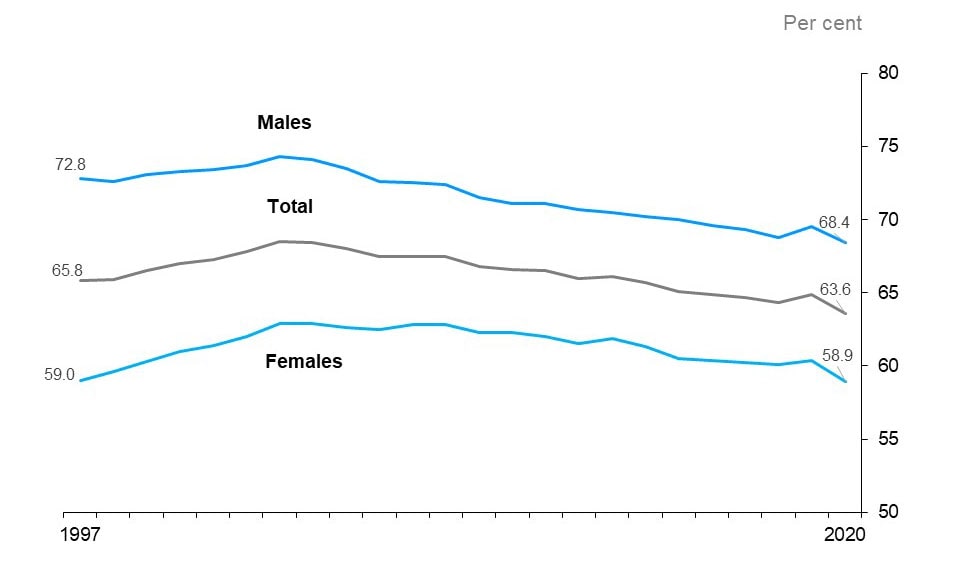
The line chart shows participation rates for the total population, males and females from 1997 to 2020, measured in per cent. The participation rates of males have historically been higher than those of females. The participation rates of males have declined from 72.8% in 1997 to 68.4% in 2020, with some fluctuations in between, and those of the total population have declined from 65.8% to 63.6%. The participation rates of females have been increasing since 1997 (59.0%) and then decreasing since the early 2000s reaching 58.9% in 2020. For both genders, the decline in rates from 2019 to 2020 was sharper compared to declines in previous years.
In 2020, the participation rate of males decreased by 1.1 percentage points to 68.4%, continuing a long-term decline and reaching the lowest level on record. The participation rate of females declined by 1.5 percentage points in 2020, to 58.9%, the lowest level since 1997.
Participation rate by age group, 1997-2020
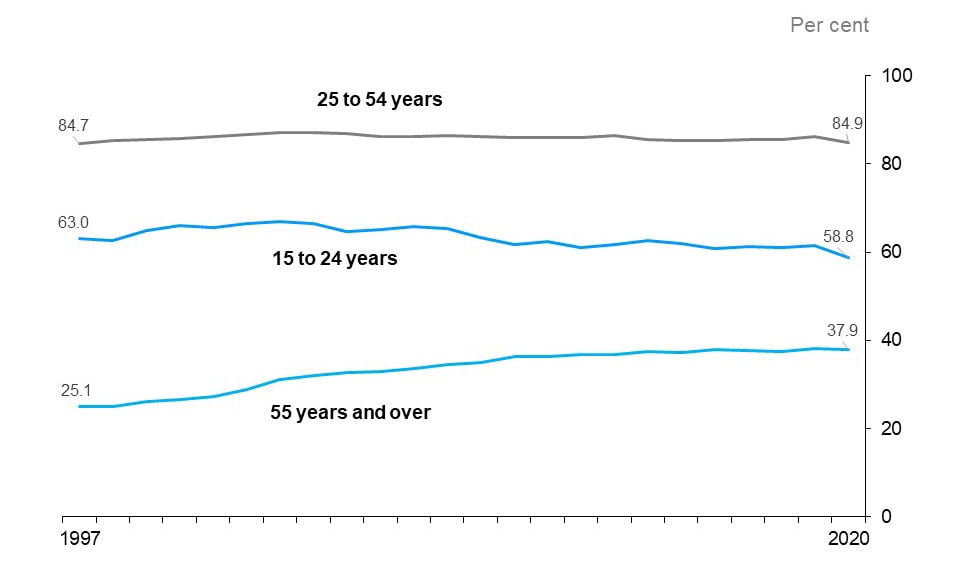
The line chart shows participation rates for three age groups: youth (15 to 24 years), core age (25 to 54 years) and older population (55 years and older) from 1997 to 2020, measured in per cent. The participation rates of all the three age groups declined in 2020. The participation rate of the core-aged population (84.9% in 2020) was similar to that experienced in 1997 (84.7%). The participation rate of youth declined from 63.0% in 1997 to 58.8% in 2020. The participation rate of older population has gradually increased from 25.1% in 1997 to 37.9% in 2020.
In 2020, the participation rate of the core-aged population decreased by 1.2 percentage points to 84.9%. The participation rate of youth decreased by 2.7 percentage points to 58.8%, the lowest rate on record. While the participation rate of the older population aged 55 years and over has been steadily increasing over the past 15 years, it decreased by 0.3 percentage points to 37.9% in 2020.
Appendix
10-year overview of annual employment
| Item | 2011 | 2012 | 2013 | 2014 | 2015 | 2016 | 2017 | 2018 | 2019 | 2020 |
|---|---|---|---|---|---|---|---|---|---|---|
| Total Labour Force (000) | 7,207.3 | 7,238.7 | 7,325.1 | 7,345.3 | 7,343.0 | 7,408.9 | 7,506.5 | 7,608.9 | 7,816.3 | 7,766.0 |
| Participation Rate (%) | 66.5 | 66.0 | 66.1 | 65.7 | 65.1 | 64.9 | 64.7 | 64.3 | 64.9 | 63.6 |
| Male Participation Rate (%) | 71.1 | 70.7 | 70.5 | 70.2 | 70.0 | 69.6 | 69.3 | 68.8 | 69.5 | 68.4 |
| Female Participation Rate (%) | 62.0 | 61.5 | 61.9 | 61.3 | 60.5 | 60.4 | 60.2 | 60.1 | 60.4 | 58.9 |
| Total Employment (000) | 6,638.2 | 6,666.7 | 6,768.1 | 6,809.1 | 6,845.4 | 6,921.4 | 7,052.5 | 7,173.3 | 7,376.9 | 7,021.6 |
| Full-time (000) | 5,360.4 | 5,389.0 | 5,449.1 | 5,486.6 | 5,557.4 | 5,610.5 | 5,713.2 | 5,845.7 | 6,000.3 | 5,797.4 |
| Part-time (000) | 1,277.8 | 1,277.7 | 1,318.9 | 1,322.5 | 1,288.0 | 1,310.9 | 1,339.3 | 1,327.6 | 1,376.6 | 1,224.3 |
| Employment-Population Ratio (%) | 61.2 | 60.8 | 61.1 | 60.9 | 60.7 | 60.6 | 60.8 | 60.6 | 61.2 | 57.5 |
| Male Employment (000) | 3,449.1 | 3,470.1 | 3,508.9 | 3,549.1 | 3,583.9 | 3,622.6 | 3,692.1 | 3,760.6 | 3,874.7 | 3,722.1 |
| Female Employment (000) | 3,189.1 | 3,196.6 | 3,259.1 | 3,260.1 | 3,261.4 | 3,298.8 | 3,360.4 | 3,412.7 | 3,502.2 | 3,299.6 |
| Part-Time (% of total) | 19.2 | 19.2 | 19.5 | 19.4 | 18.8 | 18.9 | 19.0 | 18.5 | 18.7 | 17.4 |
| Goods-Producing Sector Employment (000) | 1,397.4 | 1,406.8 | 1,381.0 | 1,366.4 | 1,393.8 | 1,425.1 | 1,439.4 | 1,463.9 | 1,467.3 | 1,410.7 |
| Services-Producing Sector Employment (000) | 5,240.8 | 5,259.9 | 5,387.1 | 5,442.7 | 5,451.6 | 5,496.3 | 5,613.1 | 5,709.5 | 5,909.7 | 5,610.9 |
| Private Sector Employment (000) | 4,331.1 | 4,347.1 | 4,405.3 | 4,473.5 | 4,505.5 | 4,544.1 | 4,640.1 | 4,716.7 | 4,830.6 | 4,542.0 |
| Public Sector Employment (000) | 1,303.1 | 1,289.5 | 1,310.0 | 1,298.1 | 1,281.2 | 1,293.7 | 1,318.8 | 1,359.7 | 1,375.4 | 1,358.8 |
| Self-Employment (% of total) | 15.1 | 15.4 | 15.6 | 15.2 | 15.5 | 15.7 | 15.5 | 15.3 | 15.9 | 16.0 |
| Total Unemployment (000) | 569.1 | 572.0 | 557.1 | 536.1 | 497.6 | 487.5 | 454.0 | 435.5 | 439.4 | 744.4 |
| Unemployment Rate (%) | 7.9 | 7.9 | 7.6 | 7.3 | 6.8 | 6.6 | 6.0 | 5.7 | 5.6 | 9.6 |
| Male Unemployment Rate (%) | 8.2 | 8.2 | 8.0 | 7.5 | 7.0 | 6.8 | 6.3 | 5.7 | 5.8 | 9.2 |
| Female Unemployment Rate (%) | 7.6 | 7.5 | 7.2 | 7.1 | 6.5 | 6.3 | 5.8 | 5.7 | 5.5 | 10.0 |
| Long-Term (27 wks+) (% of total) | 24.3 | 22.8 | 23.1 | 22.9 | 20.0 | 20.0 | 19.5 | 16.9 | 15.0 | 14.7 |
| Average Unemployment in Weeks | 22.5 | 22.3 | 21.9 | 22.5 | 20.0 | 20.0 | 19.3 | 17.2 | 15.8 | 15.3 |
| Youth Unemployment Rate (%) | 15.5 | 16.6 | 15.9 | 15.2 | 14.3 | 13.7 | 12.2 | 11.8 | 12.0 | 22.0 |
| 25-54 y.o. Unemployment rate (%) | 6.6 | 6.5 | 6.3 | 6.0 | 5.6 | 5.5 | 5.1 | 4.8 | 4.6 | 7.7 |
| 55+ y.o. Unemployment rate (%) | 6.1 | 5.9 | 5.6 | 5.5 | 5.0 | 5.0 | 4.6 | 4.3 | 4.2 | 7.0 |
| Average Weekly Wage Rate ($) | 862.69 | 883.62 | 896.44 | 907.05 | 938.01 | 958.16 | 965.71 | 998.41 | 1,033.38 | 1,113.99 |
| Average Hourly Wage Rate ($) | 23.56 | 24.10 | 24.50 | 24.81 | 25.58 | 26.13 | 26.38 | 27.28 | 28.26 | 30.24 |
Employment by region (000)
| Region | 2011 | 2012 | 2013 | 2014 | 2015 | 2016 | 2017 | 2018 | 2019 | 2020 |
|---|---|---|---|---|---|---|---|---|---|---|
| Greater Toronto Area | 3,074.9 | 3,099.6 | 3,214.9 | 3,202.7 | 3,264.8 | 3,303.9 | 3,363.5 | 3,432.8 | 3,548.3 | 3,381.8 |
| Central | 1,542.0 | 1,537.2 | 1,542.4 | 1,577.6 | 1,582.3 | 1,589.7 | 1,653.6 | 1,659.8 | 1,696.3 | 1,616.5 |
| Southwest | 767.7 | 768.0 | 764.0 | 771.5 | 769.7 | 779.9 | 785.8 | 808.4 | 810.6 | 771.4 |
| East | 893.9 | 904.1 | 890.7 | 899.4 | 881.5 | 898.2 | 898.5 | 915.1 | 964.5 | 908.5 |
| North | 359.7 | 357.8 | 356.1 | 358.0 | 347.1 | 349.7 | 351.0 | 357.3 | 357.2 | 343.3 |
Unemployment rate by region (%)
| Region | 2011 | 2012 | 2013 | 2014 | 2015 | 2016 | 2017 | 2018 | 2019 | 2020 |
|---|---|---|---|---|---|---|---|---|---|---|
| Greater Toronto Area | 8.4 | 8.8 | 8.2 | 8.0 | 7.1 | 7.0 | 6.5 | 6.2 | 6.0 | 10.7 |
| Central | 7.5 | 7.1 | 6.9 | 6.2 | 5.9 | 5.9 | 5.4 | 5.3 | 5.2 | 8.8 |
| Southwest | 8.1 | 7.9 | 7.7 | 7.0 | 6.9 | 6.1 | 5.6 | 5.3 | 5.5 | 9.0 |
| East | 6.7 | 6.6 | 6.6 | 7.0 | 6.6 | 6.4 | 5.9 | 5.0 | 4.9 | 7.7 |
| North | 7.8 | 7.2 | 7.5 | 6.6 | 7.2 | 7.2 | 6.5 | 6.0 | 6.1 | 7.8 |
Total employment by CMA (000)
Greater Toronto Area
| CMA | 2011 | 2012 | 2013 | 2014 | 2015 | 2016 | 2017 | 2018 | 2019 | 2020 |
|---|---|---|---|---|---|---|---|---|---|---|
| Toronto | 2,916.7 | 2,942.9 | 3,061.1 | 3,043.4 | 3,114.1 | 3,140.1 | 3,206.7 | 3,262.4 | 3,385.7 | 3,221.8 |
| Oshawa | 188.1 | 188.3 | 191.5 | 197.3 | 191.4 | 208.3 | 204.6 | 214.6 | 213.0 | 205.5 |
Central Ontario
| CMA | 2011 | 2012 | 2013 | 2014 | 2015 | 2016 | 2017 | 2018 | 2019 | 2020 |
|---|---|---|---|---|---|---|---|---|---|---|
| Hamilton | 373.2 | 373.7 | 369.9 | 376.9 | 377.4 | 377.3 | 408.3 | 403.0 | 411.2 | 384.9 |
| Kitchener | 280.2 | 279.0 | 284.4 | 288.9 | 288.1 | 291.7 | 301.6 | 309.4 | 322.7 | 306.2 |
| St. Catharines-Niagara | 195.0 | 200.0 | 192.2 | 194.3 | 204.4 | 204.9 | 200.8 | 205.7 | 204.3 | 190.6 |
| Peterborough | 57.3 | 58.1 | 54.2 | 59.1 | 59.8 | 58.6 | 61.3 | 64.6 | 62.0 | 53.6 |
| Brantford | 68.3 | 67.1 | 68.3 | 68.1 | 69.0 | 70.0 | 71.9 | 69.6 | 78.1 | 71.9 |
| Guelph | 81.9 | 83.6 | 78.7 | 80.5 | 89.3 | 90.1 | 90.5 | 88.2 | 91.1 | 85.1 |
| Barrie | 101.0 | 101.3 | 107.8 | 109.3 | 105.7 | 101.8 | 113.0 | 112.2 | 116.9 | 117.6 |
Eastern Ontario
| CMA | 2011 | 2012 | 2013 | 2014 | 2015 | 2016 | 2017 | 2018 | 2019 | 2020 |
|---|---|---|---|---|---|---|---|---|---|---|
| Ottawa | 525.0 | 540.4 | 524.7 | 532.4 | 528.6 | 542.5 | 547.9 | 558.4 | 588.0 | 557.1 |
| Kingston | 78.7 | 79.2 | 80.2 | 78.5 | 79.5 | 80.3 | 84.0 | 82.9 | 83.7 | 80.0 |
| Belleville | 59.7 | 52.9 | 39.5 | 34.4 | 31.9 | 33.7 | 40.0 | 41.3 | 51.7 | 49.3 |
Southwestern Ontario
| CMA | 2011 | 2012 | 2013 | 2014 | 2015 | 2016 | 2017 | 2018 | 2019 | 2020 |
|---|---|---|---|---|---|---|---|---|---|---|
| London | 236.3 | 240.0 | 236.2 | 238.0 | 247.5 | 242.8 | 244.3 | 254.0 | 253.8 | 257.2 |
| Windsor | 147.2 | 152.1 | 154.4 | 154.8 | 156.5 | 162.5 | 161.2 | 164.1 | 170.9 | 152.2 |
Northern Ontario
| CMA | 2011 | 2012 | 2013 | 2014 | 2015 | 2016 | 2017 | 2018 | 2019 | 2020 |
|---|---|---|---|---|---|---|---|---|---|---|
| Sudbury | 82.7 | 81.7 | 84.0 | 83.4 | 82.1 | 82.8 | 81.7 | 83.0 | 86.9 | 81.1 |
| Thunder Bay | 60.1 | 61.5 | 62.5 | 61.3 | 59.3 | 60.0 | 61.5 | 64.3 | 62.7 | 59.0 |
Note: All estimates in this appendix are based on Statistics Canada’s Labour Force Survey.
Footnotes
- footnote[1] Back to paragraph Since 1976, as this is the earliest year of the Labour Force Survey data available on statcan.gc.ca.
- footnote[2] Back to paragraph Public sector includes the federal, provincial, territorial and local general governments, health and social service institutions, universities, colleges, vocational and trade institutions, school boards, and government business enterprises.
- footnote[3] Back to paragraph Real wages are based on nominal wages deflated by the Ontario Consumer Price Index (CPI) for all items. Self-employment is excluded.
- footnote[4] Back to paragraph Employment by hourly wage data are obtained from the Labour Force Survey Public Use Microdata Files. Comparisons are based on nominal wages.
- footnote[5] Back to paragraph This is a 12-month average of the total number of hours actually worked by all employed persons in the Labour Force Survey reference weeks.
- footnote[6] Back to paragraph Employed, worked zero hours includes employees and self-employed who were absent from work all week, but excludes people who have been away for reasons such as 'vacation,' 'maternity,' 'seasonal business 'and labour dispute.'
- footnote[7] Back to paragraph Employed, worked less than half of their usual hours includes both employees and self-employed, where only employees were asked to provide a reason for the absence. This excludes reasons for absence such as 'vacation,' 'labour dispute,' 'maternity,' 'holiday,' and 'weather.' Also excludes those who were away all week.
- footnote[8] Back to paragraph This analysis includes only those workers that were at work during the Labour Force Survey reference week. When all employed persons are included, the average actual hours across all jobs were 31.6, the lowest average on record.