January to March, 2024
Introduction
About the Ontario Employment Report
The Ontario Employment Report is released four times a year and provides an assessment of the current trends and developments in the Ontario labour market. The Ontario Employment Report is a companion report to the Ontario Economic Accounts, which provides an overall assessment of the current state of the Ontario economy.
Methodological note
In the current issue, year-over-year change represents change between the averages in the first quarter of 2023 and the first quarter of 2024. Note that the Ontario Economic Accounts report primarily shows changes between two consecutive quarters.
This report uses seasonally adjusted data in charts displaying data with a monthly frequency in the Overview section.
Unadjusted data are used in charts and tables showing the changes for the current quarter compared with the same quarter for the previous year. Unadjusted data are also used to calculate annual averages, year-to-date averages and 2024 first quarter averages.
All estimates in this report are based on Statistics Canada’s Labour Force Survey (LFS), which measures the current state of the national, provincial, and territorial labour market. The LFS is based on a household survey carried out monthly by Statistics Canada in reference weeks of each month. The reference periods for the three months of the first quarter of 2024 are January 14 to 20, February 11 to 17, and March 10 to 16.
Overview
Ontario’s labour market overview
Employment:
- +89,600 net jobs in Q1 2024, year-over-year
- +31,200 net full-time jobs in Q1 2024, year-over-year
- +26,100 net jobs in March 2024
- -1,400 net full-time jobs in March 2024
Unemployment rate:
- 6.6% in Q1 2024
- 6.7% in March 2024
Year-over-year, Ontario’s employment increased by 1.2% (+89,600) in the first quarter of 2024, while Canada’s employment grew by 1.8% (+355,600).
Ontario’s unemployment rate was 6.6% in the first quarter of 2024, higher than the Canadian rate of 6.2%.
In March 2024, Ontario’s employment increased (+26,100, +0.3%), driven by gains in part-time employment (+27,500, +2.0%). Canada’s employment was little changed in March 2024 (-2,200, -0.0%).
In March 2024, the unemployment rate in Ontario increased for the second consecutive month to 6.7%, compared to 6.5% in February 2024 and 6.2% in January 2024. The unemployment rate in Canada also increased to 6.1% in March 2024 from 5.8% in the previous month and 5.7% in January 2024.
Year-over-year overview
Ontario’s labour market, January 2014 – March 2024 (seasonally adjusted)
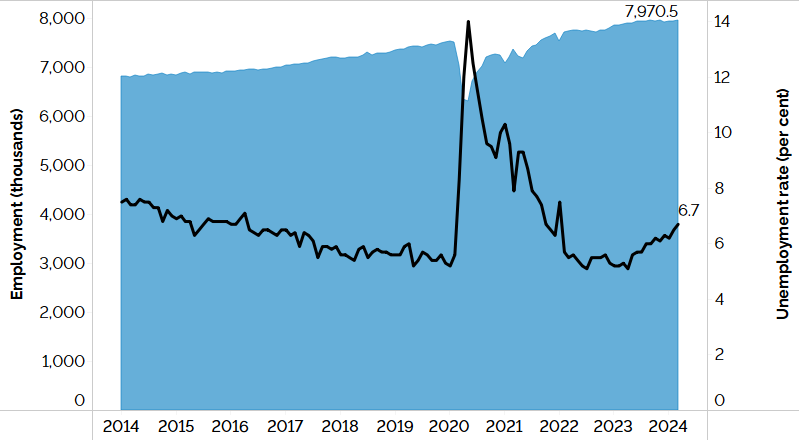
The combination line and area chart shows Ontario’s unemployment rate (line chart) and employment (area chart) from January 2014 to March 2024. Ontario’s unemployment rate has trended downwards since January 2014, reaching 5.2% in January 2020, before rising to 14.0% in May 2020, and reaching 6.7% in March 2024 after lows of 5.1% in July 2022 and April 2023. Employment in Ontario has risen steadily since January 2014, reaching just over 7.5 million workers in January 2020, before dropping to just above 6.3 million workers in May 2020, then gradually rising to 7,970,500 workers in March 2024.
Between the first quarters of 2023 and 2024:
- employment gains were driven by growth in part-time employment (+4.2%), while full-time employment also increased (+0.5%);
- employment increased in all the sectors with the largest growth in the public sector (+4.4%), followed by the private sector (+0.3%), and self-employment (+0.5%);
- employment increased in services-producing industries (+1.4%) and slightly declined in goods-producing industries (-0.1%);
- employment increased in most regions, with Southwestern Ontario (+2.0%) experiencing the highest rate of employment growth; and
- employment increased for core-aged workers (+2.5%) and older workers (+1.1%), while youth employment declined (-5.4%).
Type of Work
Employment change by work status, Ontario, Q1 2024 over Q1 2023
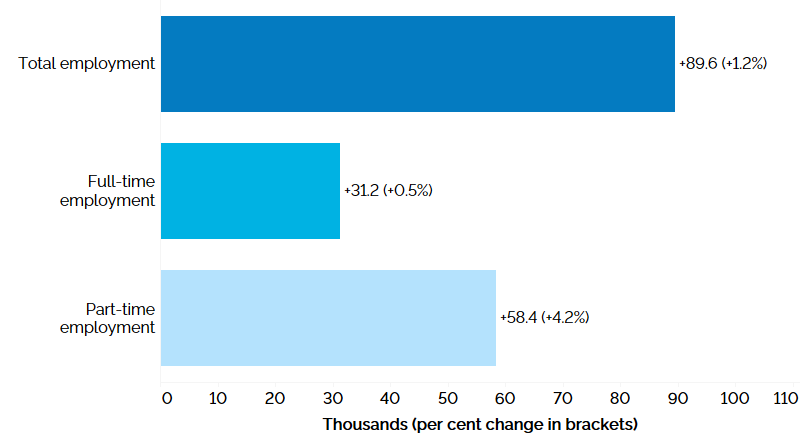
The horizontal bar chart shows a year-over-year (between the first quarters of 2023 and 2024) change in Ontario’s employment by full-time and part-time status. Total employment increased by 89,600 (+1.2%), with full-time employment increasing by 31,200 (+0.5%), and part-time employment increasing by 58,400 (+4.2%).
Year-over-year, full-time employment increased by 0.5% and part-time employment increased by 4.2% in the first quarter of 2024.
Employment change by employment sector, Ontario, Q1 2024 over Q1 2023
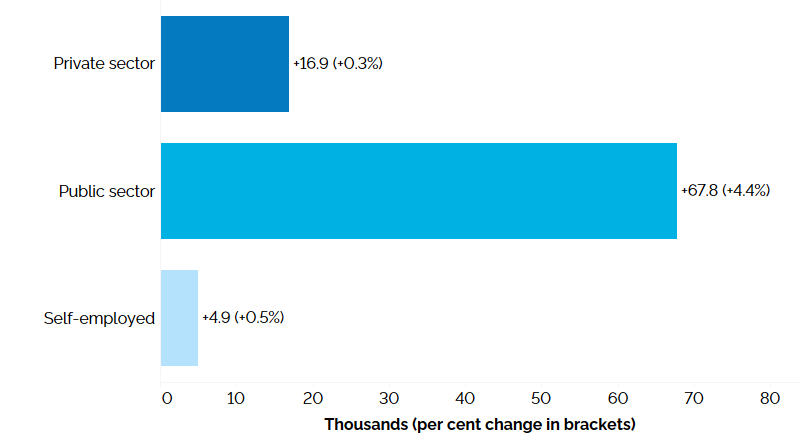
The horizontal bar chart shows a year-over-year (between the first quarters of 2023 and 2024) change in Ontario’s employment in the private sector, public sector and among the self-employed. Employment increased by 16,900 (+0.3%) in the private sector, by 67,800 (+4.4%) in the public sector and by 4,900 (+0.5%) among the self-employed.
Year-over-year, employment increased by 4.4% in the public sector,
Employment change by above-average wage and below-average wage industries, Ontario, Q1 2024 over Q1 2023footnote 3
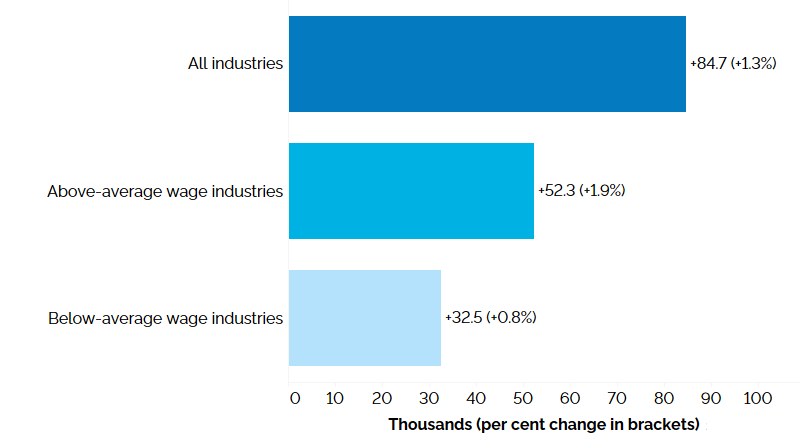
The horizontal bar chart shows a year-over-year (between the first quarters of 2023 and 2024) change in Ontario’s employment for above- and below-average wage industries, compared to the paid employment in all industries. Employment increased in both above-average wage (+52,300, +1.9%) and below-average wage (+32,500, +0.8%) industries. Paid employment in all industries (excluding self-employment) increased by 84,700 (+1.3%).
Year-over-year, paid employment increased by 1.9% in above-average wage industries and by 0.8% in below-average wage industries.
Sector and occupation
Employment change by industry, goods-producing industries, Ontario, Q1 2024 over Q1 2023
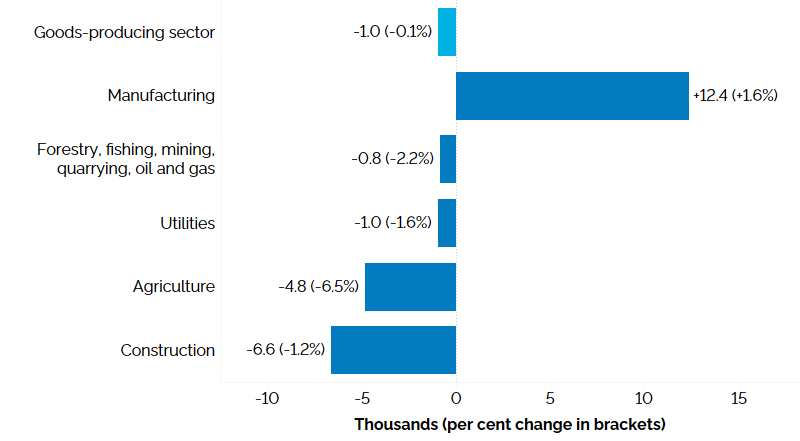
The horizontal bar chart shows a year-over-year (between the first quarters of 2023 and 2024) change in Ontario’s employment by industry for goods-producing industries, measured in thousands with percentage changes in brackets. Employment increased in manufacturing (+1.6%), and declined in construction (-1.2%); agriculture (-6.5%); utilities (-1.6%); and forestry, fishing, mining, quarrying, oil and gas (-2.2%). The overall employment in goods-producing industries declined by 1,000 (-0.1%).
Employment in goods-producing industries was little changed (-0.1%) in the first quarter of 2024, compared to the same period in 2023. Employment gains in manufacturing (+12,400, +1.6%) were offset by employment declines in the remaining goods-producing industries, with the largest declines in construction (-6,600, -1.2%) and agriculture (-4,800, -6.5%).
Employment change by industry, services-producing industries, Ontario, Q1 2024 over Q1 2023
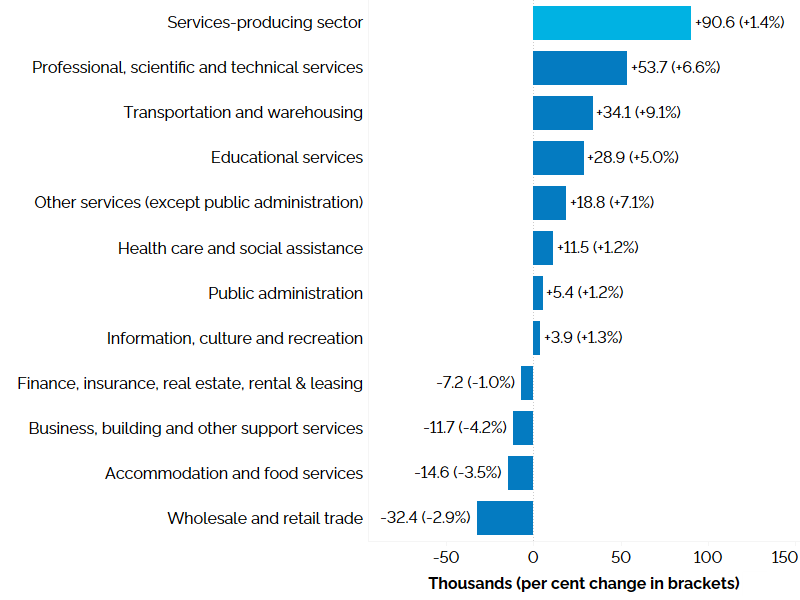
The horizontal bar chart shows a year-over-year (between the first quarters of 2023 and 2024) change in Ontario’s employment by industry for services-producing industries, measured in thousands with percentage changes in brackets. Employment increased in seven of the eleven services-producing industries. Professional, scientific and technical services (+6.6%) experienced the largest increase in employment, followed by transportation and warehousing (+9.1%); educational services (+5.0%); other services (except public administration) (+7.1%); health care and social assistance (+1.2%); public administration (+1.2%) and information, culture and recreation (+1.3%). Employment declined in wholesale and retail trade (-2.9%); accommodation and food services (-3.5%); business, building and other support services (-4.2%); and finance, insurance, real estate, rental and leasing (-1.0%). Overall employment in services-producing industries increased by 90,600 (+1.4%).
In the first quarter of 2024, employment increased in the services-producing industries (+90,600, +1.4%) compared to the same period in 2023. Seven services-producing industries experienced employment growth with professional, scientific and technical services (+53,700, +6.6%) experiencing the largest employment gain, followed by transportation and warehousing (+34,100, +9.1%), which also experienced the largest rate of employment growth. Four industry groups experienced a decline in employment with the largest decrease in wholesale and retail trade (-32,400, -2.9%).
Employment change by occupational group, Ontario, Q1 2024 over Q1 2023footnote 4
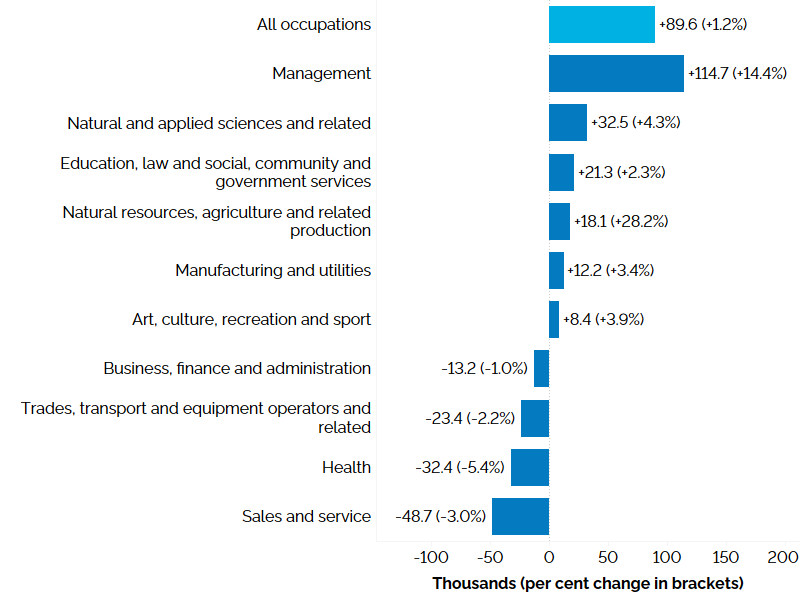
The horizontal bar chart shows a year-over-year (between the first quarters of 2023 and 2024) change in Ontario’s employment by broad occupational group measured in thousands with percentage changes in brackets. Management occupations experienced the largest employment increase (+14.4%), followed by natural and applied sciences and related occupations (+4.3%); occupations in education, law and social, community and government services (+2.3%); natural resources, agriculture and related production occupations (+28.2%); occupations in manufacturing and utilities (+3.4%); and occupations in art, culture, recreation and sport (+3.9%). Employment declined in sales and service occupations (-3.0%); health occupations (-5.4%); trades, transport and equipment operators and related occupations (-2.2%); and business, finance and administration occupations (-1.0%). Overall employment increased by 89,600 (+1.2%).
Year-over-year, management occupations (+114,700, +14.4%) experienced the largest employment gain followed by natural and applied sciences and related occupations (+32,500, +4.3%) and occupations in education, law and social, community and government services (+21,300, +2.3%). Four occupational groups experienced a decline in employment with the largest decrease in sales and service occupations (-48,700, -3.0%).
Geographic region
Ontario regionsfootnote 5
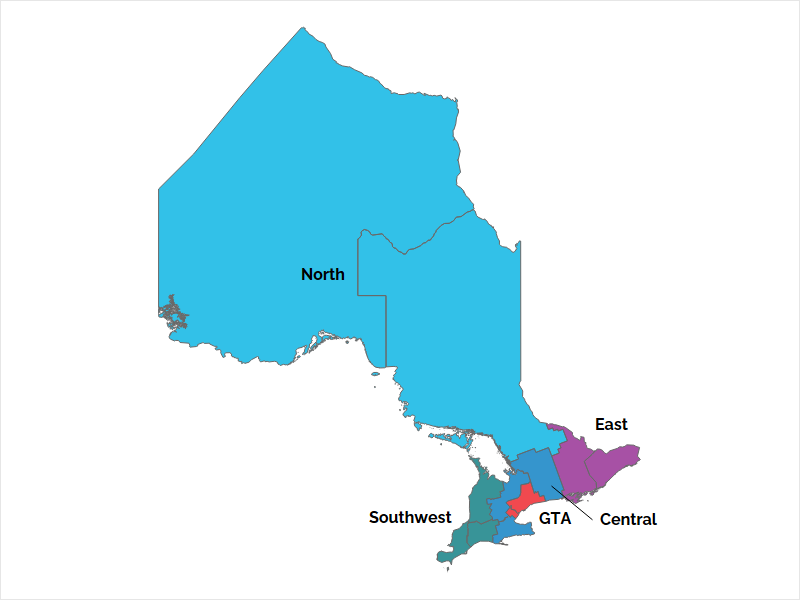
The map shows Ontario’s five regions: Northern Ontario, Eastern Ontario, Southwestern Ontario, Central Ontario and the Greater Toronto Area.
Employment change by Ontario region, Q1 2024 over Q1 2023footnote 6
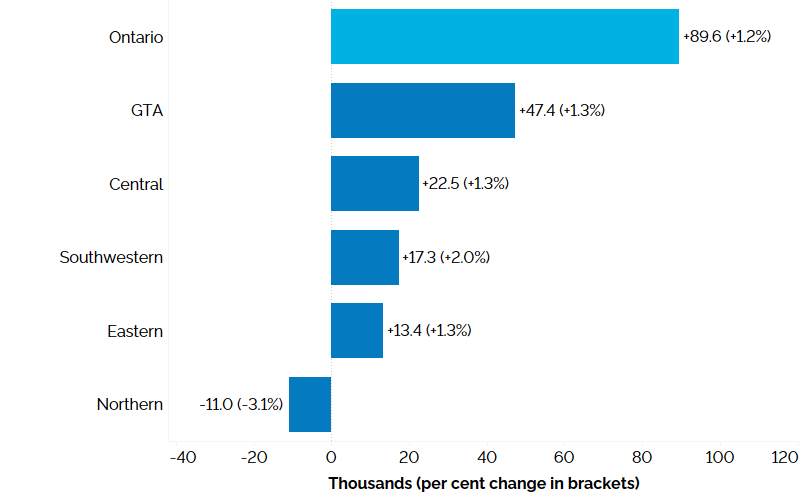
The horizontal bar chart shows a year-over-year (between the first quarters of 2023 and 2024) change in employment with percentage changes in brackets in the five Ontario regions: Northern Ontario, Eastern Ontario, Southwestern Ontario, Central Ontario and the Greater Toronto Area (GTA). Employment increased in the Greater Toronto Area (GTA) (+47,400, +1.3%), Central Ontario (+22,500, +1.3%), Southwestern Ontario (+17,300, +2.0%), and Eastern Ontario (+13,400, +1.3%), and declined in Northern Ontario (-11,000, -3.1%). Overall employment in Ontario increased by 89,600 (+1.2%).
Year-over-year, employment increased in all Ontario regions in the first quarter of 2024, except for Northern Ontario (-11,000, -3.1%). The Greater Toronto Area (GTA)
Unemployment rates by Ontario region, Q1 2024footnote 8
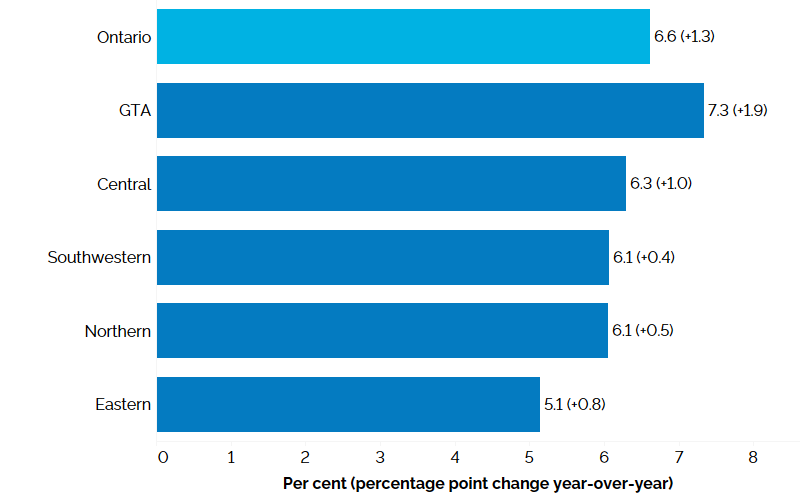
The horizontal bar chart shows unemployment rates by Ontario region in the first quarter of 2024 with percentage point changes from the first quarter of 2023 in brackets. The Greater Toronto Area had the highest unemployment rate at 7.3% (+1.9 percentage points compared to the first quarter of 2023), followed by Central Ontario at 6.3% (+1.0 percentage point), Southwestern Ontario at 6.1% (+0.4 percentage point), Northern Ontario at 6.1% (+0.5 percentage point) and Eastern Ontario at 5.1% (+0.8 percentage point). The overall unemployment rate for Ontario was 6.6% (+1.3 percentage points).
In the first quarter of 2024, the unemployment rate increased in all regions. The GTA had the highest unemployment rate (7.3%), followed by Central Ontario (6.3%), Southwestern Ontario (6.1%), and Northern Ontario (6.1%). Eastern Ontario had the lowest unemployment rate (5.1%).
Participation rates by Ontario region, Q1 2024footnote 9
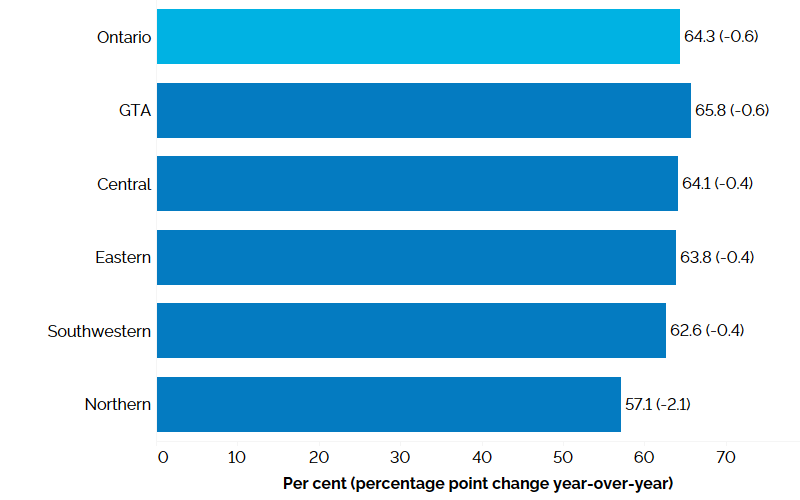
The horizontal bar chart shows participation rates by Ontario region in the first quarter of 2024 with percentage point changes from the first quarter of 2023 in brackets. The Greater Toronto Area had the highest participation rate at 65.8% (-0.6 percentage point compared to the first quarter of 2023), followed by Central Ontario at 64.1% (-0.4 percentage point), Eastern Ontario at 63.8% (-0.4 percentage point), Southwestern Ontario at 62.6% (-0.4 percentage point) and Northern Ontario at 57.1% (-2.1 percentage points). The overall participation rate for Ontario was 64.3% (-0.6 percentage point).
Labour force participation rates ranged from 57.1% in Northern Ontario to 65.8% in the GTA in the first quarter of 2024. Year-over-year, labour force participation rates declined in all regions.
Age and gender
Employment change by age group and gender, Ontario, Q1 2024 over Q1 2023
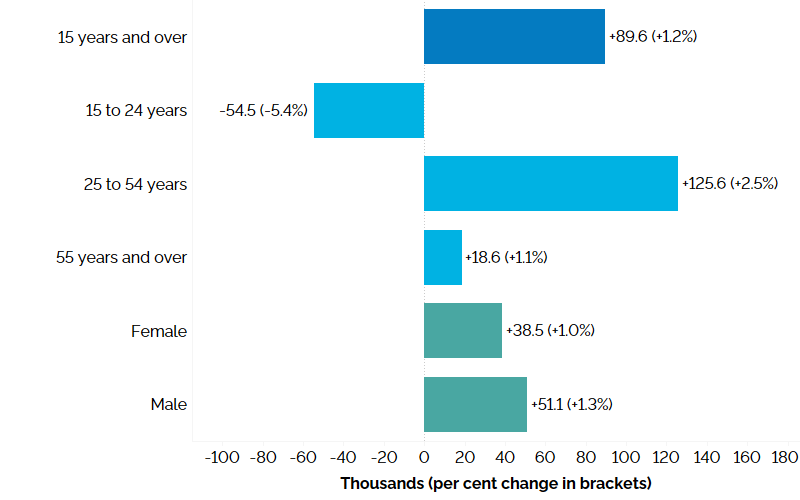
The horizontal bar chart shows year-over-year (between the first quarters of 2023 and 2024) change in Ontario’s employment for the three major age groups, as well as by gender, compared to the overall population. This is measured in thousands with percentage changes in brackets. Employment increased among core-aged workers aged 25 to 54 years (+125,600, +2.5%) and older workers aged 55 years and over (+18,600, +1.1%), but decreased among youth aged 15 to 24 years (-54,500, -5.4%). Female employment increased by 38,500 (+1.0%) and male employment increased by 51,100 (+1.3%). Total employment increased by 89,600 (+1.2%).
Compared to the same quarter last year, core-aged workers aged 25 to 54 years posted the highest rate of employment growth (+2.5%), followed by older workers aged 55 years and over (+1.1%). Employment declined for youth aged 15 to 24 years (-5.4%).
Year-over-year, employment increased more for males (+1.3%) than females (+1.0%).
Unemployment rates by age group and gender, Ontario, Q1 2024
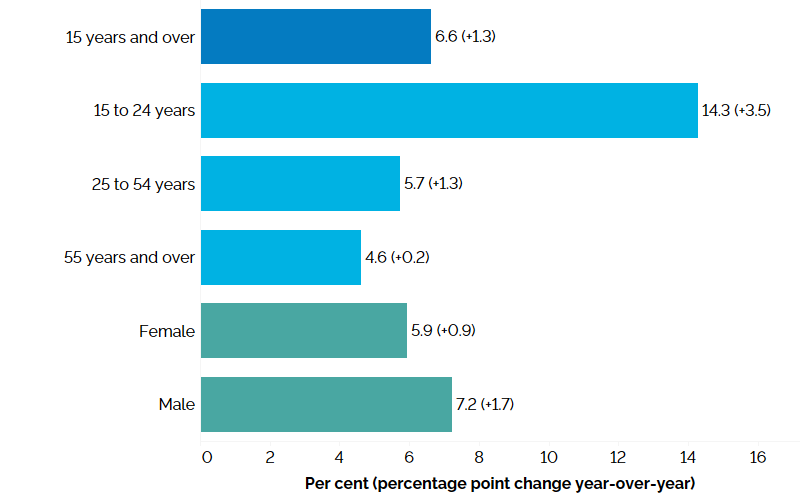
The horizontal bar chart shows unemployment rates in the first quarter of 2024 for Ontario as a whole, by major age group and by gender with percentage point changes from the first quarter of 2023 in brackets. Ontario’s overall unemployment rate in the first quarter of 2024 was 6.6% (+1.3 percentage points compared to the first quarter of 2023). Youth aged 15 to 24 years had the highest unemployment rate at 14.3% (+3.5 percentage points), followed by the core-aged population aged 25 to 54 years at 5.7% (+1.3 percentage points) and older workers aged 55 years and over at 4.6% (+0.2 percentage point). The female unemployment rate was 5.9% (+0.9 percentage point) and the male unemployment rate was 7.2% (+1.7 percentage points).
In the first quarter of 2024, youth had the highest unemployment rate (14.3%), followed by core-aged individuals (5.7%) and older individuals (4.6%). Compared to the same period last year, the unemployment rate increased by 3.5 percentage points for youth, 1.3 percentage points for core-aged individuals, and 0.2 percentage point for older individuals.
In the first quarter of 2024, the unemployment rate for males (7.2%) was higher than that of females (5.9%). Compared to the same period last year, the unemployment rate increased by 0.9 percentage point for females and 1.7 percentage points for males.
Participation rates by age group and gender, Ontario, Q1 2024
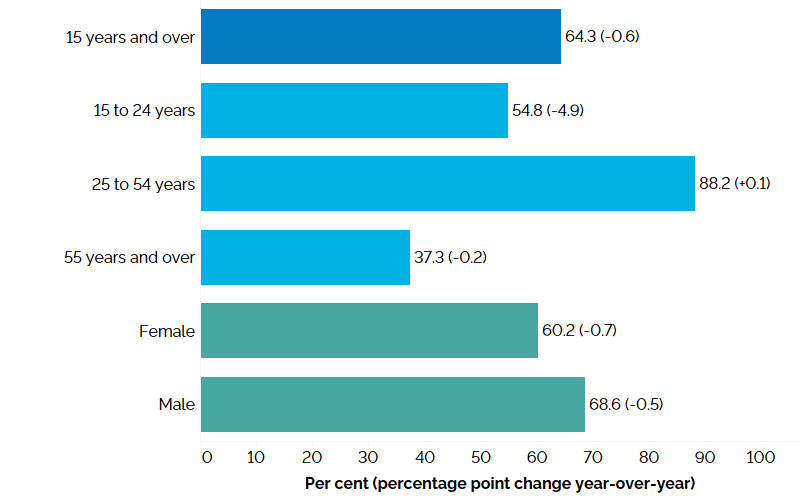
The horizontal bar chart shows labour force participation rates in the first quarter of 2024 for Ontario as a whole, by major age group and by gender with percentage point changes from the first quarter of 2023 in brackets. Ontario’s overall labour force participation rate was 64.3% (-0.6 percentage point from the first quarter of 2023). The core-aged population aged 25 to 54 years had the highest labour force participation rate at 88.2% (+0.1 percentage point), followed by youth aged 15 to 24 years at 54.8% (-4.9 percentage points), and older workers aged 55 years and over at 37.3% (-0.2 percentage point). The male participation rate (68.6%, -0.5 percentage point) was higher than the female participation rate (60.2%, -0.7 percentage point).
In the first quarter of 2024, core-aged individuals had the highest labour force participation rate (88.2%), followed by youth (54.8%) and older individuals (37.3%). Compared to the first quarter of 2023, the participation rate decreased by 4.9 percentage points for youth, increased by 0.1 percentage point for the core-aged population and decreased by 0.2 percentage point for older individuals.
Males had a higher participation rate (68.6%) than females (60.2%) in the first quarter of 2024. Compared to the same period last year, the participation rate decreased by 0.7 percentage point for females and 0.5 percentage point for males. The gap in labour force participation rates between males and females widened when compared to the first quarter of 2023 from 8.1 percentage points to 8.4 percentage points.
Education level and immigrant status
Employment rates by education level and immigrant status (core-aged population), Ontario, Q1 2024footnote 10
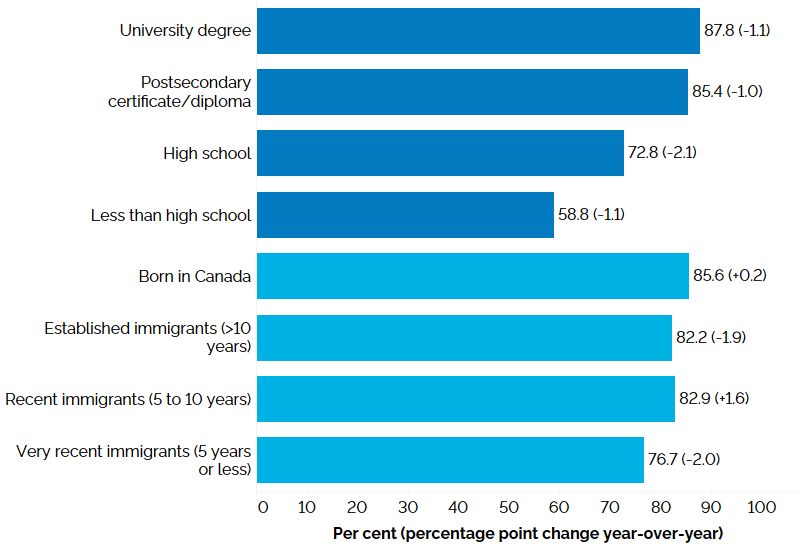
The horizontal bar chart shows employment rates by education level and immigrant status for the core-aged population (25 to 54 years), in the first quarter of 2024, with percentage point changes from the first quarter of 2023 in brackets. By education level, those with a university degree had the highest employment rate (87.8%, -1.1 percentage points), followed by those with a postsecondary certificate/diploma (85.4%, -1.0 percentage point), those with a high school diploma (72.8%, -2.1 percentage points), and those with less than high school education (58.8%, -1.1 percentage points). By immigrant status, those born in Canada had the highest employment rate (85.6%, +0.2 percentage point), followed by recent immigrants with 5 to 10 years since landing (82.9%, +1.6 percentage points), established immigrants with more than 10 years since landing (82.2%, -1.9 percentage points), and very recent immigrants with 5 years or less since landing (76.7%, -2.0 percentage points).
In the first quarter of 2024, core-aged individuals with less than a high school diploma continued to have the lowest employment rate (58.8%), while those with a university degree recorded the highest employment rate (87.8%), followed by those with a postsecondary certificate or diploma (85.4%).
Year-over-year, the employment rate for core-aged people decreased across all education levels.
Those born in Canada had the highest employment rate (85.6%), while very recent immigrants had the lowest employment rate (76.7%).
Year-over-year, the employment rate increased for the core-aged population born in Canada (+0.2 percentage point) and recent immigrants (+1.6 percentage points). Core-aged very recent immigrants (-2.0 percentage points) and established immigrants (-1.9 percentage points) recorded employment rate decreases.
Unemployment rates by education level and immigrant status (core-aged population), Ontario, Q1 2024footnote 11
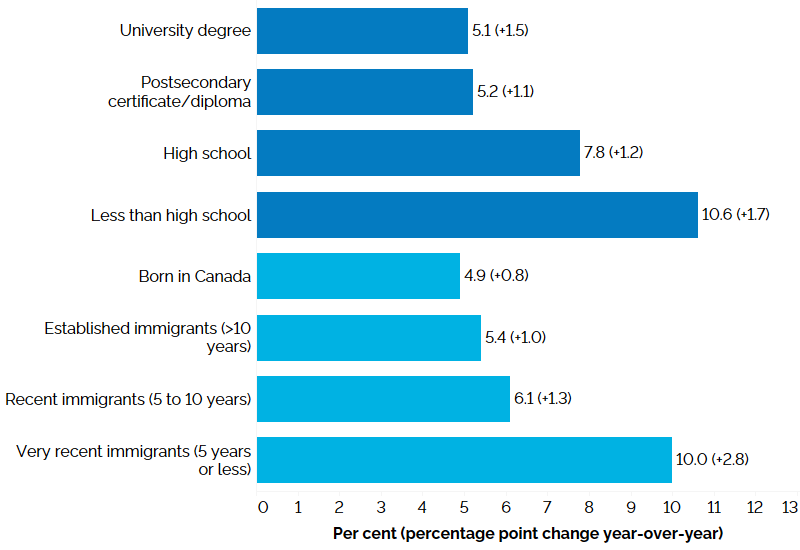
The horizontal bar chart shows unemployment rates by education level and immigrant status for the core-aged population (25 to 54 years), in the first quarter of 2024, with percentage point changes from the first quarter of 2023 in brackets. By education level, those with less than high school education had the highest unemployment rate (10.6%, +1.7 percentage point from the first quarter of 2023), followed by those with high school education (7.8%, +1.2 percentage points), those with a postsecondary certificate or diploma (5.2%, +1.1 percentage points), and university degree holders (5.1%, +1.5 percentage points). By immigrant status, very recent immigrants with 5 years or less since landing had the highest unemployment rate (10.0%, +2.8 percentage points), followed by recent immigrants with 5 to 10 years since landing (6.1%, +1.3 percentage points), established immigrants with more than 10 years since landing (5.4%, +1.0 percentage point), and those born in Canada (4.9%, +0.8 percentage point).
In the first quarter of 2024, the core-aged population with a university degree and those with a postsecondary certificate/diploma had the lowest unemployment rates (5.1% and 5.2%, respectively), while those with a high school diploma (7.8%) and less than high school education (10.6%)
In the first quarter of 2024, the core-aged population born in Canada had the lowest unemployment rate (4.9%), while very recent immigrants had the highest unemployment rate (10.0%). Year-over-year, the unemployment rate increased for all groups by immigrant status.
Participation rates by education level and immigrant status (core-aged population), Ontario, Q1 2024footnote 13
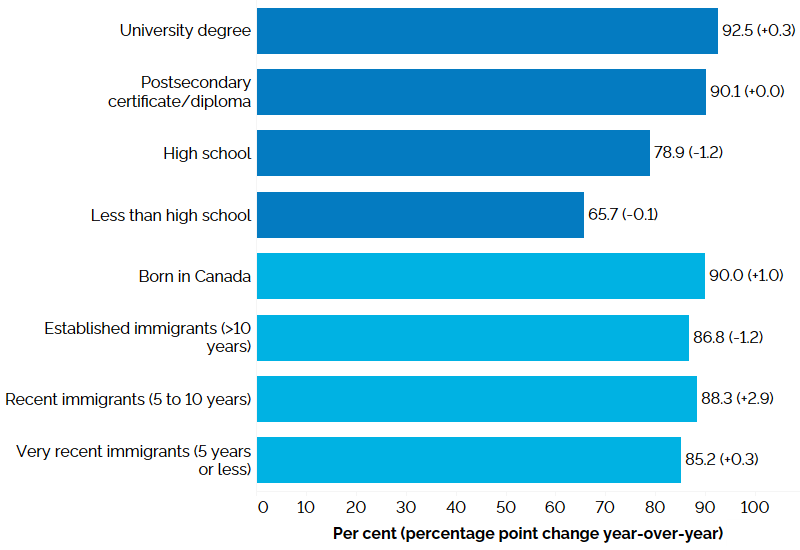
The horizontal bar chart shows labour force participation rates by education level and immigrant status for the core-aged population (25 to 54 years), in the first quarter of 2024, with percentage point changes from the first quarter of 2023 in brackets. By education level, university degree holders had the highest participation rate (92.5%, +0.3 percentage point from the first quarter of 2023), followed by postsecondary certificate or diploma holders (90.1%, +0.0 percentage point), high school graduates (78.9%, -1.2 percentage points), and those with less than high school education (65.7%, -0.1 percentage points). By immigrant status, those born in Canada had the highest participation rate (90.0%, +1.0 percentage point), followed by recent immigrants with 5 to 10 years since landing (88.3%, +2.9 percentage points), established immigrants with more than 10 years since landing (86.8%, -1.2 percentage points), and very recent immigrants with 5 years or less since landing (85.2%, +0.3 percentage point).
In the first quarter of 2024, among the core-aged population, those with a university degree continued to have the highest participation rate (92.5%), while those with less than high school education had the lowest participation rate (65.7%). Year-over-year, the participation rate increased among those with a university degree (+0.3 percentage point), but decreased for those with a high school diploma (-1.2 percentage points) and those with less than high school education (-0.1 percentage point). The participation rate for those with a postsecondary certificate/diploma was unchanged.
In the first quarter of 2024, core-aged very recent immigrants had the lowest participation rate (85.2%) compared to recent immigrants, established immigrants and those born in Canada. Year-over-year, the participation rate increased for most groups by immigrant status with the exception of established immigrants (-1.2 percentage points). Recent immigrants recorded the largest increase in the participation rate (+2.9 percentage points).
Wages
Average hourly wages by employment status, Ontario, 1997-2023
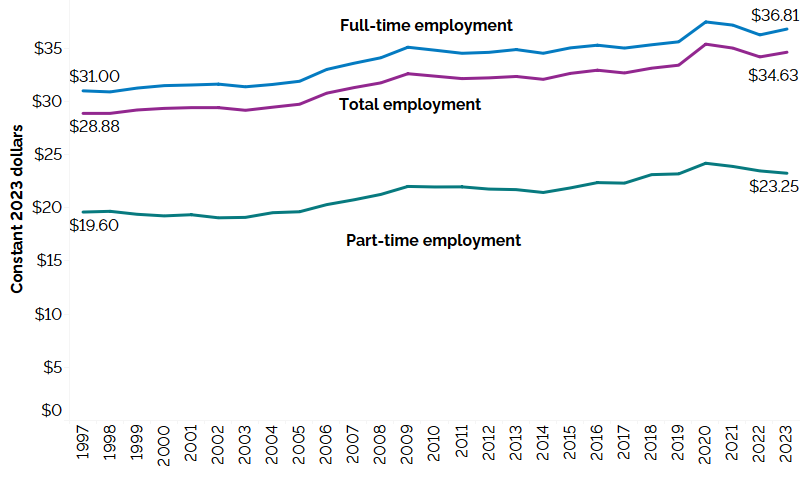
The line chart shows average hourly wages for all employees, full-time and part-time employees expressed in real 2023 dollars from 1997 to 2023. Real average hourly wages of all employees increased from $28.88 in 1997 to $34.63 in 2023; those of full-time employees increased from $31.00 in 1997 to $36.81 in 2023; and those of part-time employees increased from $19.60 in 1997 to $23.25 in 2023.
Over the last two and a half decades, the average hourly wage increased in real terms
Average hourly wage growth by type of work, Ontario, Q1 2024 over Q1 2023footnote 15
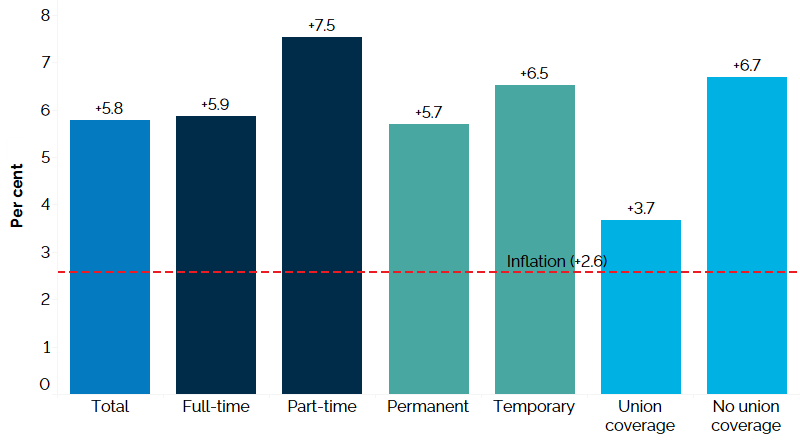
The vertical bar chart shows a year-over-year (between the first quarters of 2023 and 2024) per cent change in Ontario’s nominal hourly wages by type of work. The average hourly wage increased by 5.8%. Average hourly wages increased for full-time employees (+5.9%) and for part-time employees (+7.5%). Average hourly wages increased for permanent employees (+5.7%) and temporary employees (+6.5%). Average hourly wages increased for employees with union coverage (+3.7%) and those without union coverage (+6.7%). Inflation during the same period was 2.6%.
In the first quarter of 2024, the average hourly wage of Ontario employees was $36.01, an increase of 5.8% from the first quarter of 2023.
Part-time employees (+7.5%), temporary employees (+6.5%) and employees with no union coverage (+6.7%) experienced larger increases in average hourly wages when compared to full-time employees (+5.9%), permanent employees (+5.7%) and employees with union coverage (+3.7%).
Consumer Price Index inflation over the first quarter of 2024 compared to the first quarter of 2023 was 2.6%.
Average hourly wage rate and wage growth by occupational group, Ontario, Q1 2024footnote 17
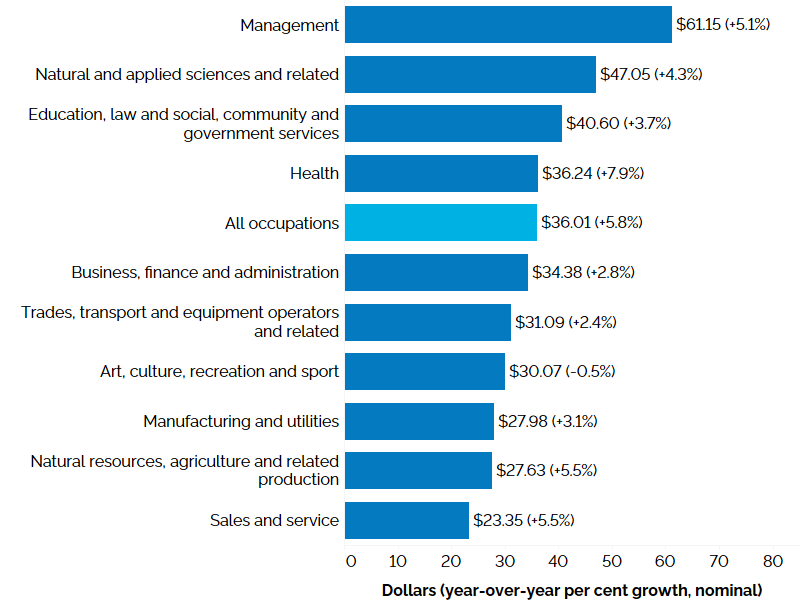
The horizontal bar chart shows average hourly wage rates by occupational group in the first quarter of 2024, with percentage changes in brackets from the first quarter of 2023 in brackets. In the first quarter of 2024, the average hourly wage rate for Ontario was $36.01 (+5.8%). The highest average hourly wage rate was for management occupations at $61.15 (+5.1%); followed by natural and applied sciences and related occupations at $47.05 (+4.3%); occupations in education, law and social, community and government services at $40.60 (+3.7%); health occupations at $36.24 (+7.9%); business, finance and administration occupations at $34.38 (+2.8%); trades, transport and equipment operators and related occupations at $31.09 (+2.4%); occupations in art, culture, recreation and sport at $30.07 (-0.5%); occupations in manufacturing and utilities at $27.98 (+3.1%); natural resources, agriculture and related production occupations at $27.63 (+5.5%); and sales and service occupations at $23.35 (+5.5%).
Year-over-year, almost all broad occupational groups experienced growth in average hourly wages, led by health occupations (+7.9%), occupations in natural resources, agriculture and related production (+5.5%), sales and service occupations (+5.5%) and management occupations (+5.1%). Occupations in art, culture, recreation and sport was the only group to record a decline in average hourly wages (-0.5%).
Appendix I
Overview of annual employment ten-year review, Ontario
| 2014 | 2015 | 2016 | 2017 | 2018 | 2019 | 2020 | 2021 | 2022 | 2023 | |
|---|---|---|---|---|---|---|---|---|---|---|
| Total Labour Force (000) | 7,384.8 | 7,386.4 | 7,442.7 | 7,576.3 | 7,679.4 | 7,866.6 | 7,788.0 | 8,048.8 | 8,190.4 | 8,392.6 |
| Participation Rate (%) | 66.0 | 65.5 | 65.2 | 65.3 | 64.9 | 65.3 | 63.7 | 65.2 | 65.4 | 65.5 |
| Male Participation Rate (%) | 70.6 | 70.4 | 69.9 | 70.0 | 69.6 | 70.0 | 68.6 | 69.9 | 69.9 | 70.0 |
| Female Participation Rate (%) | 61.6 | 60.8 | 60.6 | 60.7 | 60.5 | 60.8 | 59.1 | 60.7 | 61.2 | 61.2 |
| Total Employment (000) | 6,840.0 | 6,887.0 | 6,956.4 | 7,117.3 | 7,245.9 | 7,429.2 | 7,025.9 | 7,393.3 | 7,731.6 | 7,914.8 |
| Full-time (000) | 5,497.5 | 5,580.0 | 5,630.5 | 5,740.5 | 5,883.4 | 6,042.3 | 5,801.0 | 6,088.9 | 6,372.4 | 6,542.2 |
| Part-time (000) | 1,342.6 | 1,307.0 | 1,325.9 | 1,376.8 | 1,362.5 | 1,386.9 | 1,224.9 | 1,304.4 | 1,359.2 | 1,372.6 |
| Employment-Population Ratio (%) | 61.1 | 61.1 | 60.9 | 61.3 | 61.3 | 61.6 | 57.5 | 59.9 | 61.8 | 61.8 |
| Male Employment (000) | 3,566.0 | 3,603.7 | 3,641.9 | 3,730.4 | 3,808.7 | 3,901.7 | 3,717.3 | 3,891.6 | 4,060.1 | 4,164.6 |
| Female Employment (000) | 3,274.0 | 3,283.3 | 3,314.5 | 3,386.9 | 3,437.2 | 3,527.5 | 3,308.5 | 3,501.7 | 3,671.5 | 3,750.2 |
| Part-Time (% of total) | 19.6 | 19.0 | 19.1 | 19.3 | 18.8 | 18.7 | 17.4 | 17.6 | 17.6 | 17.3 |
| Goods-Producing Sector Employment (000) | 1,393.8 | 1,406.7 | 1,440.2 | 1,457.5 | 1,476.8 | 1,474.6 | 1,415.5 | 1,466.2 | 1,543.5 | 1,586.3 |
| Services-Producing Sector Employment (000) | 5,446.2 | 5,480.3 | 5,516.2 | 5,659.8 | 5,769.1 | 5,954.6 | 5,610.4 | 5,927.1 | 6,188.1 | 6,328.5 |
| Private Sector Employment (000) | 4,542.1 | 4,545.4 | 4,613.4 | 4,741.5 | 4,809.6 | 4,936.5 | 4,600.1 | 4,876.4 | 5,127.2 | 5,296.0 |
| Public Sector Employment (000) | 1,259.5 | 1,276.2 | 1,280.5 | 1,299.0 | 1,319.2 | 1,343.5 | 1,327.9 | 1,429.1 | 1,515.7 | 1,539.9 |
| Self-Employment (%of total) | 15.2 | 15.5 | 15.3 | 15.1 | 15.4 | 15.5 | 15.6 | 14.7 | 14.1 | 13.6 |
| Total Unemployment (000) | 544.8 | 499.5 | 486.4 | 459.0 | 433.5 | 437.5 | 762.1 | 655.5 | 458.8 | 477.8 |
| Unemployment Rate (%) | 7.4 | 6.8 | 6.5 | 6.1 | 5.6 | 5.6 | 9.8 | 8.1 | 5.6 | 5.7 |
| Male Unemployment Rate (%) | 7.6 | 7.1 | 6.8 | 6.3 | 5.6 | 5.7 | 9.6 | 8.1 | 5.5 | 5.6 |
| Female Unemployment Rate (%) | 7.1 | 6.4 | 6.2 | 5.8 | 5.7 | 5.4 | 10.0 | 8.2 | 5.7 | 5.8 |
| Long-Term (27 wks+) (% of total) | 22.5 | 19.8 | 19.7 | 19.3 | 16.3 | 15.1 | 15.0 | 28.2 | 18.2 | 16.7 |
| Average Unemployment in Weeks | 21.9 | 20.1 | 19.9 | 19.1 | 17.2 | 16.0 | 15.4 | 23.0 | 19.7 | 17.6 |
| Youth Unemployment Rate (%) | 15.2 | 14.3 | 13.4 | 11.7 | 11.7 | 11.7 | 22.1 | 15.9 | 11.5 | 12.5 |
| 25-54 y.o. Unemployment rate (%) | 6.1 | 5.6 | 5.5 | 5.2 | 4.7 | 4.6 | 7.9 | 6.7 | 4.6 | 4.7 |
| 55+ y.o. Unemployment rate (%) | 5.6 | 5.0 | 5.0 | 4.7 | 4.2 | 4.3 | 7.3 | 7.4 | 4.6 | 4.1 |
| Average Weekly Wage Rate ($) | 931.31 | 959.81 | 985.76 | 993.13 | 1,030.52 | 1,058.44 | 1,136.25 | 1,161.63 | 1,216.43 | 1,278.16 |
| Average Hourly Wage Rate ($) | 25.45 | 26.20 | 26.92 | 27.16 | 28.18 | 28.95 | 30.86 | 31.60 | 32.94 | 34.63 |
Employment by region (000)
| 2014 | 2015 | 2016 | 2017 | 2018 | 2019 | 2020 | 2021 | 2022 | 2023 | |
|---|---|---|---|---|---|---|---|---|---|---|
| Greater Toronto Area | 3,221.8 | 3,281.6 | 3,320.9 | 3,392.6 | 3,471.5 | 3,576.0 | 3,387.5 | 3,568.5 | 3,728.7 | 3,828.7 |
| Central | 1,583.5 | 1,594.9 | 1,598.6 | 1,670.4 | 1,676.2 | 1,708.6 | 1,615.1 | 1,692.6 | 1,779.9 | 1,819.2 |
| Southwest | 776.2 | 775.6 | 784.6 | 793.8 | 817.0 | 817.4 | 770.6 | 833.1 | 864.5 | 880.6 |
| East | 900.9 | 885.7 | 902.5 | 906.8 | 922.0 | 967.8 | 909.9 | 954.4 | 1,000.2 | 1,029.8 |
| North | 357.8 | 349.0 | 349.7 | 353.7 | 359.2 | 359.3 | 342.8 | 344.7 | 358.2 | 356.4 |
Unemployment rate by region (%)
| 2014 | 2015 | 2016 | 2017 | 2018 | 2019 | 2020 | 2021 | 2022 | 2023 | |
|---|---|---|---|---|---|---|---|---|---|---|
| Greater Toronto Area | 8.1 | 7.1 | 6.9 | 6.5 | 6.0 | 5.9 | 11.0 | 9.2 | 6.3 | 6.2 |
| Central | 6.3 | 5.8 | 5.9 | 5.3 | 5.3 | 5.2 | 9.1 | 7.5 | 5.0 | 5.3 |
| Southwest | 6.9 | 7.0 | 6.1 | 5.7 | 5.3 | 5.4 | 9.2 | 7.5 | 5.5 | 5.6 |
| East | 7.2 | 6.7 | 6.4 | 5.9 | 4.8 | 5.0 | 7.7 | 6.5 | 4.4 | 4.6 |
| North | 6.8 | 7.2 | 7.4 | 6.6 | 6.1 | 6.0 | 7.9 | 6.8 | 4.6 | 5.3 |
Total employment by CMA (000)
Greater Toronto Area
| 2014 | 2015 | 2016 | 2017 | 2018 | 2019 | 2020 | 2021 | 2022 | 2023 | |
|---|---|---|---|---|---|---|---|---|---|---|
| Toronto | 3,061.9 | 3,130.4 | 3,155.7 | 3,235.3 | 3,301.4 | 3,412.1 | 3,227.0 | 3,409.2 | 3,569.4 | 3,674.5 |
| Oshawa | 198.2 | 192.6 | 209.9 | 206.4 | 215.5 | 214.4 | 205.4 | 211.2 | 226.6 | 224.3 |
Central Ontario
| 2014 | 2015 | 2016 | 2017 | 2018 | 2019 | 2020 | 2021 | 2022 | 2023 | |
|---|---|---|---|---|---|---|---|---|---|---|
| Hamilton | 378.1 | 380.8 | 380.6 | 411.1 | 407.4 | 414.8 | 384.1 | 409.6 | 418.6 | 414.0 |
| Kitchener-Cambridge-Waterloo | 290.1 | 290.7 | 293.1 | 304.1 | 312.4 | 324.4 | 305.5 | 323.0 | 333.7 | 343.8 |
| St. Catharines-Niagara | 195.3 | 205.4 | 205.8 | 203.9 | 208.8 | 207.1 | 189.5 | 198.4 | 221.2 | 222.0 |
| Peterborough | 59.3 | 60.2 | 58.5 | 61.7 | 64.9 | 62.5 | 53.7 | 63.5 | 66.1 | 66.6 |
| Brantford | 68.8 | 70.0 | 70.4 | 72.7 | 70.5 | 78.7 | 72.0 | 74.2 | 77.7 | 78.2 |
| Guelph | 80.8 | 89.9 | 91.1 | 91.3 | 89.1 | 91.4 | 85.1 | 92.8 | 96.8 | 100.3 |
| Barrie | 109.7 | 106.3 | 102.7 | 114.5 | 112.4 | 117.6 | 118.7 | 115.5 | 124.3 | 129.7 |
Eastern Ontario
| 2014 | 2015 | 2016 | 2017 | 2018 | 2019 | 2020 | 2021 | 2022 | 2023 | |
|---|---|---|---|---|---|---|---|---|---|---|
| Ottawa-Gatineau (Ontario part) | 532.6 | 530.1 | 545.5 | 551.5 | 564.1 | 589.8 | 557.8 | 590.2 | 610.5 | 645.2 |
| Kingston | 78.8 | 80.1 | 80.6 | 84.8 | 83.2 | 83.9 | 80.1 | 81.3 | 87.9 | 92.4 |
| Belleville | 35.2 | 32.3 | 33.4 | 41.1 | 41.9 | 51.8 | 49.6 | 50.0 | 57.4 | 58.9 |
Southwestern Ontario
| 2014 | 2015 | 2016 | 2017 | 2018 | 2019 | 2020 | 2021 | 2022 | 2023 | |
|---|---|---|---|---|---|---|---|---|---|---|
| London | 239.6 | 249.0 | 245.2 | 247.4 | 257.3 | 256.1 | 257.9 | 281.8 | 295.4 | 306.8 |
| Windsor | 155.9 | 157.6 | 164.0 | 163.4 | 166.5 | 171.6 | 152.1 | 168.3 | 174.7 | 189.1 |
Northern Ontario
| 2014 | 2015 | 2016 | 2017 | 2018 | 2019 | 2020 | 2021 | 2022 | 2023 | |
|---|---|---|---|---|---|---|---|---|---|---|
| Greater Sudbury | 83.5 | 82.9 | 82.7 | 82.3 | 83.3 | 87.3 | 81.0 | 82.1 | 85.4 | 86.9 |
| Thunder Bay | 61.4 | 59.7 | 60.3 | 62.1 | 64.4 | 63.2 | 59.1 | 61.1 | 61.9 | 64.0 |
Overview of quarterly employment year-over-year, Ontario
| 2022Q2 | 2023Q2 | 2022Q3 | 2023Q3 | 2022Q4 | 2023Q4 | 2023Q1 | 2024Q1 | |
|---|---|---|---|---|---|---|---|---|
| Total Labour Force (000) | 8,252.7 | 8,432.8 | 8,244.3 | 8,508.7 | 8,178.7 | 8,410.8 | 8,218.0 | 8,429.0 |
| Participation Rate (%) | 66.0 | 66.1 | 65.8 | 66.2 | 65.0 | 64.8 | 64.9 | 64.3 |
| Male Participation Rate (%) | 70.4 | 70.7 | 70.5 | 70.8 | 69.3 | 69.2 | 69.1 | 68.6 |
| Female Participation Rate (%) | 61.9 | 61.7 | 61.2 | 61.6 | 60.8 | 60.6 | 60.9 | 60.2 |
| Total Employment (000) | 7,809.2 | 7,971.3 | 7,766.7 | 7,968.3 | 7,777.2 | 7,938.2 | 7,781.3 | 7,870.9 |
| - Full-time (000) | 6,442.2 | 6,581.9 | 6,494.2 | 6,670.8 | 6,373.1 | 6,521.4 | 6,394.8 | 6,426.0 |
| - Part-time (000) | 1,367.1 | 1,389.3 | 1,272.5 | 1,297.6 | 1,404.0 | 1,416.8 | 1,386.5 | 1,444.9 |
| Employment-Population Ratio (%) | 62.5 | 62.5 | 62.0 | 62.0 | 61.8 | 61.2 | 61.5 | 60.1 |
| Male Employment (000) | 4,082.1 | 4,198.6 | 4,111.7 | 4,231.8 | 4,079.1 | 4,167.8 | 4,060.4 | 4,111.6 |
| Female Employment (000) | 3,727.1 | 3,772.7 | 3,655.1 | 3,736.6 | 3,698.1 | 3,770.5 | 3,720.9 | 3,759.4 |
| Part Time (% of total) | 17.5 | 17.4 | 16.4 | 16.3 | 18.1 | 17.8 | 17.8 | 18.4 |
| Goods-Producing Sector Employment (000) | 1,554.2 | 1,607.1 | 1,587.3 | 1,634.3 | 1,559.4 | 1,575.3 | 1,528.4 | 1,527.4 |
| Services-Producing Sector Employment (000) | 6,255.0 | 6,364.1 | 6,179.4 | 6,334.1 | 6,217.8 | 6,362.9 | 6,252.9 | 6,343.5 |
| Private Sector Employment (000) | 5,184.7 | 5,356.4 | 5,197.7 | 5,391.1 | 5,140.3 | 5,261.6 | 5,174.8 | 5,191.7 |
| Public Sector Employment | 1,540.2 | 1,540.7 | 1,475.8 | 1,504.4 | 1,544.3 | 1,580.4 | 1,534.1 | 1,601.9 |
| Self-Employment (% of total) | 13.9 | 13.5 | 14.1 | 13.5 | 14.0 | 13.8 | 13.8 | 13.7 |
| Total Unemployment (000) | 443.4 | 461.6 | 477.6 | 540.3 | 401.5 | 472.6 | 436.7 | 558.0 |
| Unemployment Rate (%) | 5.4 | 5.5 | 5.8 | 6.3 | 4.9 | 5.6 | 5.3 | 6.6 |
| Male Unemployment Rate (%) | 5.5 | 5.3 | 5.3 | 5.7 | 4.8 | 5.8 | 5.5 | 7.2 |
| Female Unemployment Rate (%) | 5.2 | 5.7 | 6.3 | 7.1 | 5.0 | 5.4 | 5.1 | 5.9 |
| Long-Term (27 wks+) (% of total) | 19.6 | 17.2 | 15.8 | 14.1 | 18.7 | 19.5 | 16.5 | 20.4 |
| Average Unemployment in Weeks | 20.6 | 17.8 | 17.0 | 16.4 | 20.3 | 18.5 | 18.0 | 19.9 |
| Youth Unemployment Rate (%) | 11.6 | 13.3 | 11.3 | 13.4 | 10.4 | 12.4 | 10.8 | 14.3 |
| 25-54 y.o Unemployment Rate (%) | 4.4 | 4.4 | 4.8 | 5.3 | 4.1 | 4.7 | 4.5 | 5.7 |
| 55+ y.o Unemployment Rate (%) | 4.0 | 3.3 | 4.7 | 4.4 | 3.9 | 4.3 | 4.4 | 4.6 |
| Average Weekly Wage Rate ($) | 1,204.60 | 1,264.28 | 1,228.11 | 1,287.76 | 1,238.54 | 1,305.69 | 1,254.49 | 1,318.44 |
| Average Hourly Wage Rate ($) | 32.68 | 34.25 | 33.02 | 34.71 | 33.58 | 35.49 | 34.05 | 36.01 |
Employment by Region (000)
| Region | 2022Q2 | 2023Q2 | 2022Q3 | 2023Q3 | 2022Q4 | 2023Q4 | 2023Q1 | 2024Q1 |
|---|---|---|---|---|---|---|---|---|
| Central | 1,789.1 | 1,840.1 | 1,802.8 | 1,833.4 | 1,814.9 | 1,821.2 | 1,782.0 | 1,804.5 |
| Southwestern | 871.8 | 881.1 | 859.0 | 886.3 | 879.3 | 881.6 | 873.6 | 890.9 |
| Eastern | 1,014.9 | 1,032.3 | 1,008.7 | 1,037.6 | 1,009.8 | 1,041.6 | 1,007.9 | 1,021.3 |
| Northern | 363.6 | 357.7 | 355.5 | 355.6 | 358.4 | 355.2 | 357.1 | 346.1 |
| Greater Toronto Area (GTA) | 3,769.6 | 3,860.1 | 3,740.5 | 3,855.5 | 3,714.8 | 3,838.6 | 3,760.7 | 3,808.1 |
Unemployment Rate by Region (%)
| Region | 2022Q2 | 2023Q2 | 2022Q3 | 2023Q3 | 2022Q4 | 2023Q4 | 2023Q1 | 2024Q1 |
|---|---|---|---|---|---|---|---|---|
| Central | 4.5 | 4.9 | 5.1 | 5.5 | 4.6 | 5.3 | 5.3 | 6.3 |
| Southwestern | 5.3 | 5.1 | 5.8 | 6.2 | 4.9 | 5.6 | 5.7 | 6.1 |
| Eastern | 4.1 | 4.4 | 4.6 | 5.5 | 3.7 | 4.1 | 4.3 | 5.1 |
| Northern | 4.2 | 4.7 | 4.6 | 5.5 | 4.1 | 5.3 | 5.5 | 6.1 |
| Greater Toronto Area (GTA) | 6.2 | 6.2 | 6.5 | 7.1 | 5.5 | 6.2 | 5.5 | 7.3 |
Total Employment by CMA (000)
Greater Toronto Area
| 2022Q2 | 2023Q2 | 2022Q3 | 2023Q3 | 2022Q4 | 2023Q4 | 2023Q1 | 2024Q1 | |
|---|---|---|---|---|---|---|---|---|
| Toronto | 3,599.5 | 3,709.9 | 3,586.4 | 3,698.6 | 3,568.2 | 3,676.1 | 3,613.5 | 3,653.6 |
| Oshawa | 232.7 | 223.0 | 224.4 | 222.1 | 227.1 | 226.3 | 225.8 | 230.3 |
Central Ontario
| 2022Q2 | 2023Q2 | 2022Q3 | 2023Q3 | 2022Q4 | 2023Q4 | 2023Q1 | 2024Q1 | |
|---|---|---|---|---|---|---|---|---|
| Hamilton | 421.3 | 413.7 | 419.8 | 411.6 | 423.9 | 419.9 | 411.0 | 419.8 |
| Kitchener-Cambridge-Waterloo | 329.8 | 343.6 | 338.3 | 350.2 | 341.1 | 348.2 | 333.0 | 351.5 |
| St. Catharines-Niagara | 229.0 | 219.5 | 219.1 | 224.7 | 220.1 | 227.3 | 216.6 | 209.3 |
| Peterborough | 67.3 | 63.0 | 69.1 | 71.3 | 65.0 | 71.6 | 60.6 | 63.3 |
| Brantford | 76.3 | 78.7 | 80.9 | 77.7 | 80.5 | 78.4 | 78.2 | 78.6 |
| Guelph | 98.5 | 102.8 | 96.7 | 98.7 | 95.9 | 101.9 | 98.0 | 104.2 |
| Barrie | 126.4 | 137.0 | 129.7 | 129.0 | 129.6 | 122.0 | 130.7 | 119.5 |
Eastern Ontario
| 2022Q2 | 2023Q2 | 2022Q3 | 2023Q3 | 2022Q4 | 2023Q4 | 2023Q1 | 2024Q1 | |
|---|---|---|---|---|---|---|---|---|
| Ottawa-Gatineau (Ontario part) | 617.2 | 648.9 | 618.3 | 655.9 | 616.3 | 653.0 | 623.0 | 646.5 |
| Kingston | 87.9 | 95.3 | 90.5 | 93.1 | 91.0 | 90.1 | 91.1 | 88.8 |
| Belleville | 59.7 | 65.9 | 61.0 | 60.0 | 55.0 | 46.1 | 63.7 | 39.1 |
Southwestern Ontario
| 2022Q2 | 2023Q2 | 2022Q3 | 2023Q3 | 2022Q4 | 2023Q4 | 2023Q1 | 2024Q1 | |
|---|---|---|---|---|---|---|---|---|
| London | 298.5 | 307.8 | 295.3 | 314.2 | 293.2 | 311.2 | 294.0 | 306.7 |
| Windsor | 174.5 | 191.9 | 164.4 | 189.7 | 184.9 | 185.1 | 189.8 | 185.5 |
Northern Ontario
| 2022Q2 | 2023Q2 | 2022Q3 | 2023Q3 | 2022Q4 | 2023Q4 | 2023Q1 | 2024Q1 | |
|---|---|---|---|---|---|---|---|---|
| Greater Sudbury | 86.7 | 87.2 | 83.8 | 84.8 | 86.2 | 87.9 | 87.8 | 85.0 |
| Thunder Bay | 62.3 | 64.6 | 61.5 | 64.4 | 60.7 | 62.6 | 64.3 | 60.9 |
Overview of monthly* labour force characteristics, Ontario
| Jan-23 | Feb-23 | Mar-23 | Apr-23 | May-23 | Jun-23 | Jul-23 | Aug-23 | Sept-23 | Oct-23 | Nov-23 | Dec-23 | Jan-24 | Feb-24 | Mar-24 | |
|---|---|---|---|---|---|---|---|---|---|---|---|---|---|---|---|
| Employment | 7,851.8 | 7,863.8 | 7,884.3 | 7,904.7 | 7,896.9 | 7,946.7 | 7,934.6 | 7,940.0 | 7,960.2 | 7,949.2 | 7,950.9 | 7,913.9 | 7,937.7 | 7,944.4 | 7,970.5 |
| Unemployment rate | 5.2 | 5.2 | 5.3 | 5.1 | 5.6 | 5.7 | 5.7 | 6.0 | 6.0 | 6.2 | 6.1 | 6.3 | 6.2 | 6.5 | 6.7 |
| Participation rate | 65.6 | 65.6 | 65.6 | 65.5 | 65.6 | 65.9 | 65.6 | 65.6 | 65.7 | 65.5 | 65.3 | 64.9 | 64.8 | 64.9 | 65.0 |
* Seasonally adjusted.
Footnotes
- footnote[1] Back to paragraph Estimates of employment changes and rate calculations are based on unrounded quarterly estimates and may differ slightly from estimates based on published quarterly data due to rounding.
- footnote[2] Back to paragraph The public sector includes employees in federal, provincial, territorial, municipal and Aboriginal public administrations, as well as in Crown corporations, liquor control boards and other government institutions such as schools (including universities), hospitals and public libraries.
- footnote[3] Back to paragraph Above-average wage industries are defined as those with earnings above the average hourly earnings of all industries in 2023. Self-employment is excluded.
- footnote[4] Back to paragraph Occupation estimates are based on the 2021 National Occupational Classification. Management occupations are classified under the management occupational category and the remaining categories exclude management occupations.
- footnote[5] Back to paragraph Based on groupings of Statistics Canada’s economic regions.
- footnote[6] Back to paragraph Based on a three-month moving average for March 2024, using unadjusted data.
- footnote[7] Back to paragraph The GTA refers to the Statistics Canada definition of the Toronto Economic Region; notably, this definition excludes the city of Burlington.
- footnote[8] Back to paragraph Based on a three-month moving average for March 2024, using unadjusted data. The seasonally adjusted estimate for Ontario in Q1 2024 is 6.5%.
- footnote[9] Back to paragraph Based on a three-month moving average for March 2024, using unadjusted data.
- footnote[10] Back to paragraph Rate by immigrant status is based on a three-month moving average for March 2024. Education level refers to the highest level of schooling completed.
- footnote[11] Back to paragraph Rate by immigrant status is based on a three-month moving average for March 2024. Education level refers to the highest level of schooling completed.
- footnote[12] Back to paragraph The less than high school population includes those with 0 to 8 years of education and those with some high school education. In this quarter, the February 2024 unemployment estimate for those with 0 to 8 years was not published due to data quality concerns. As a result, the unemployment rate for the less than high school population needs to be interpreted with caution. The Q1 2024 unemployment rate for this educational category is based on an average of two months only (January and March).
- footnote[13] Back to paragraph Rate by immigrant status is based on a three-month moving average for March 2024. Education level refers to the highest level of schooling completed.
- footnote[14] Back to paragraph Real wages are based on nominal wages deflated by the Consumer Price Index (CPI) for all items. Self-employment is excluded.
- footnote[15] Back to paragraph Nominal wage growth, not adjusted for inflation. Self-employment is excluded. Inflation is measured as an increase in the all-items Consumer Price Index for Ontario between January and March 2023 and January and March 2024.
- footnote[16] Back to paragraph Year-over-year comparison (between first quarters of 2023 and 2024) is in nominal dollars.
- footnote[17] Back to paragraph Occupation estimates are based on the 2021 National Occupational Classification. Management occupations are classified under the management occupational category and the remaining categories exclude management occupations. Nominal wage growth, not adjusted for inflation. Self-employment is excluded.