January to March, 2020
Introduction
About the Ontario Employment Report
The Ontario Employment Report is released four times a year and provides an assessment of the current trends and developments in the Ontario labour market. The Ontario Employment Report is a companion report to the Ontario Economic Accounts, which provides an overall assessment of the current state of the Ontario economy. All estimates in this report are based on Statistics Canada’s Labour Force Survey.
Methodological note
In the current issue, year-over-year change represents change between the averages in the first quarter of 2019 and the first quarter of 2020. Note that the Ontario Economic Accounts report primarily shows changes between the previous and the current quarter.
This report uses seasonally adjusted data in charts displaying data with a monthly frequency in the Overview section.
Unadjusted data is used in charts and tables showing the changes for the current quarter compared with the same quarter for the previous year. Unadjusted data is also used to calculate annual averages, year-to-date averages and 2020 first quarter averages.
Impact of COVID-19 on the data
The data in this report is based on Statistics Canada’s Labour Force Survey (LFS). The March LFS results reflect labour market conditions during the week of March 15 to 21. By this point in time, the impact of COVID-19 and measures taken to stop the spread of the virus resulted in a significant slowdown in economic activity. The slowdown was in progress during the LFS reference week and will be more fully reflected in the April data and the Ontario Employment Report in the second quarter of 2020.
Appendix I of this report provides some of the early impacts of COVID-19 on Ontario’s labour market.
Overview
Ontario’s labour market overview
Employment:
+48,700 net new jobs in Q1 2020, year-over-year
+97,000 net new full-time jobs in Q1 2020, year-over-year
Unemployment rate:
6.2% in the first quarter of 2020
Year-over-year, Ontario’s employment, grew by 0.7% (48,700) in the first quarter of 2020, while Canada’s employment decreased by 0.5% (-94,700).
Ontario’s unemployment rate was 6.2% in the first quarter of 2020, lower than the Canadian rate of 6.7%.
Year-over-year overview
Ontario’s labour market, 2008-2020
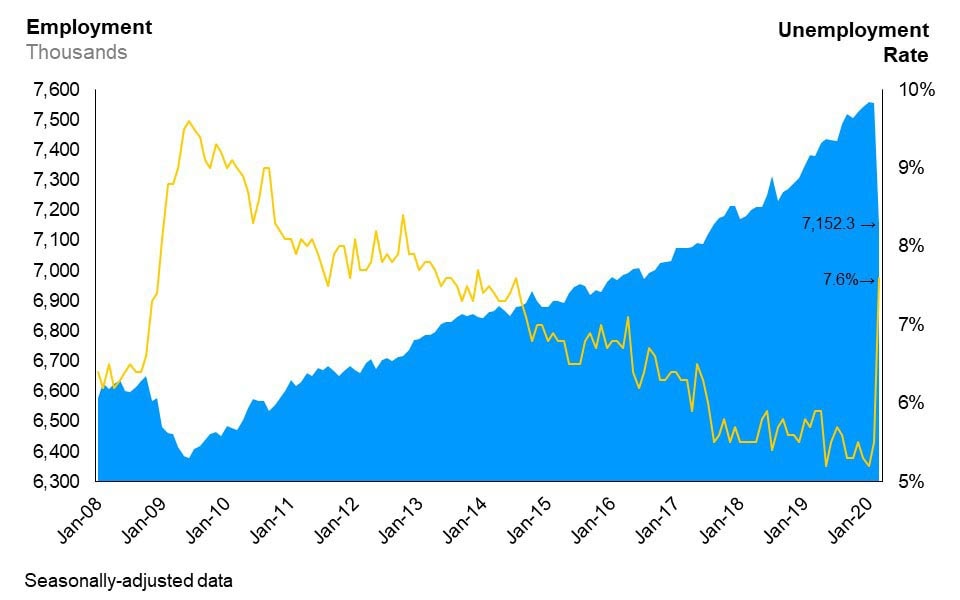
The combination line and area chart shows Ontario’s unemployment rate (line chart) and employment (area chart) from January 2008 to March 2020. Ontario’s unemployment rate has trended downwards since the recession, reaching 5.2% in January 2020, before it rises to 7.6% in March 2020. Employment in Ontario has risen steadily since the recession, reaching just over 7.5 million workers in January 2020, before dropping to 7.2 million workers in March 2020.
Between the first quarter of 2019 and 2020:
- employment growth was driven by increase in full-time employment (+1.7%), while part-time employment decreased (-3.4%)
- private sector employment decreased by 0.5%, public sector employment increased by 3.3% and self-employment increased by 2.3%.
- there were small employment gains in the services-producing sector (+0.6%); however, accommodation and food services had a significant decline in employment (-9.4%)
- three of the five Ontario regions posted employment gains with the GTA experiencing the highest employment growth (+1.1%)
- older workers experienced above-average employment growth (+4.5%)
- the average hourly wage increased by 5.4% to $29.40
Type of work quarterly details
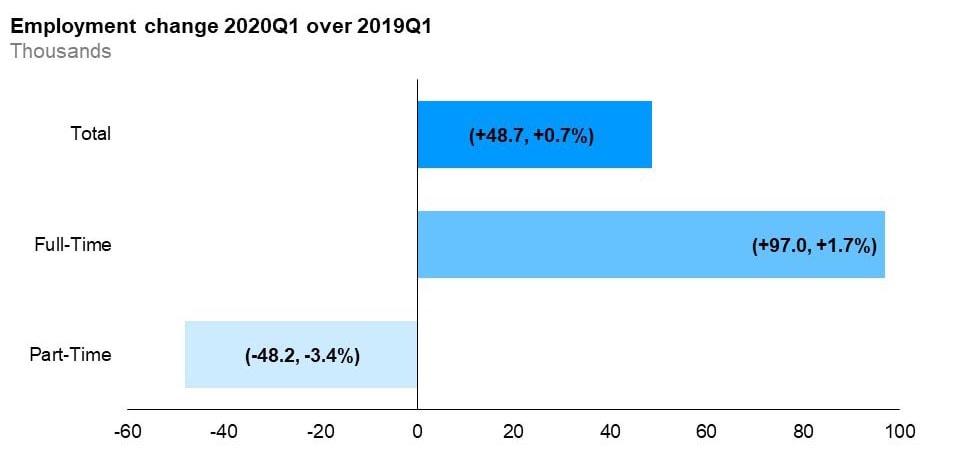
The horizontal bar chart shows a year-over-year (between the first quarters of 2019 and 2020) change in Ontario’s employment by full-time and part-time status. Total employment increased by 0.7%, with full-time employment increasing by 1.7%, and part-time employment decreasing by 3.4%.
Year-over-year, full-time employment increased by 1.7% and part-time employment decreased by 3.4% in the first quarter of 2020.
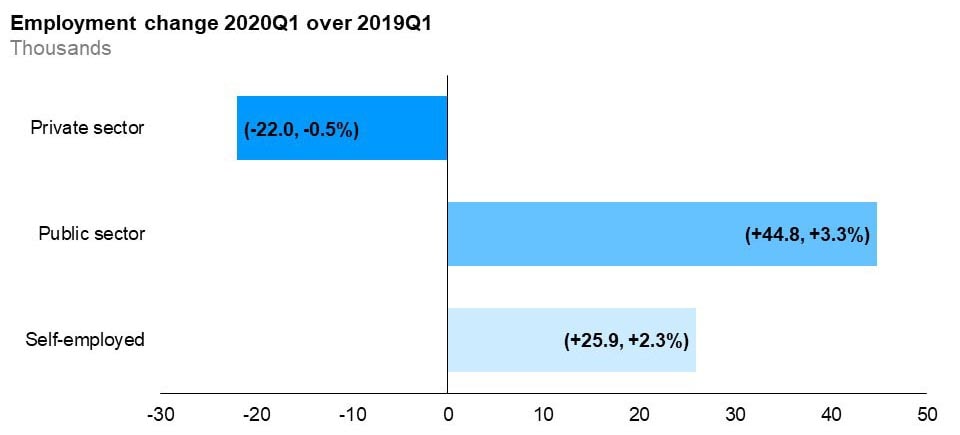
The horizontal bar chart shows a year-over-year (between the first quarters of 2019 and 2020) change in Ontario’s employment for the private sector, public sector and self-employment. Employment increased in the public sector (+3.3%) and self-employment (+2.3%), and decreased in the private sector (-0.5%).
Year-over-year, public sector employment increased by 3.3%, self-employment increased by 2.3%, and private sector employment decreased by 0.5%.
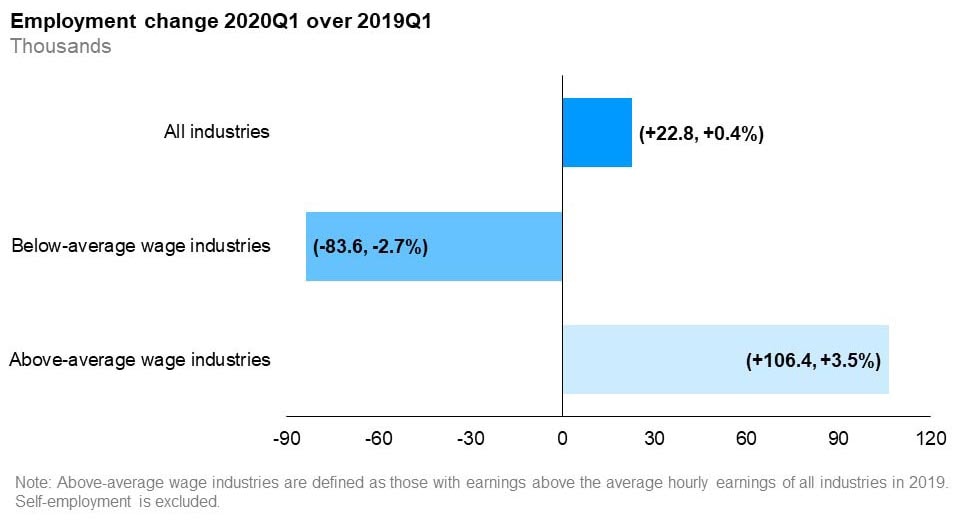
The horizontal bar chart shows a year-over-year (between the first quarters of 2019 and 2020) change in Ontario’s employment for above- and below-average wage industries, compared to the paid employment in all industries. Employment in above-average wage industries increased (+3.5%) while employment in below-average wage industries decreased (-2.7%). Paid employment in all industries (excluding self-employment) rose by 0.4%. Above-average wage industries are defined as those with wage rates above the average hourly wages of all industries in 2019.
Year-over-year, paid employment increased in above-average wage industries by 3.5%, while employment in below-average wage industries decreased by 2.7%.
Sector and occupation quarterly details
Employment change by industry, goods-producing industries
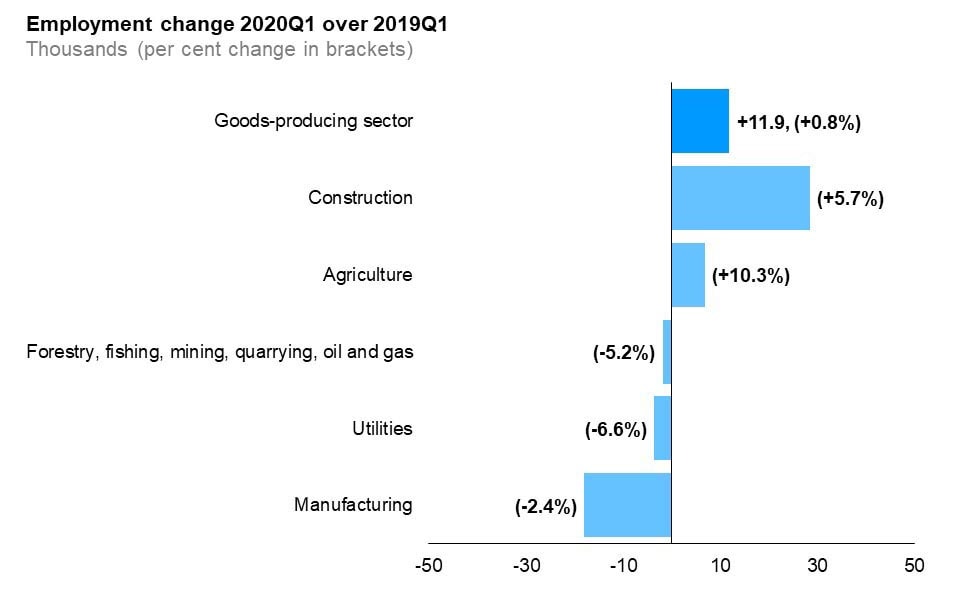
The horizontal bar chart shows a year-over-year (between the first quarters of 2019 and 2020) change in Ontario’s employment by industry for goods-producing industries. Construction experienced the largest employment gains (+5.7%), followed by agriculture (+10.3). Manufacturing had the largest employment decline (-2.4%), followed by utilities (-6.6%) and forestry, fishing, mining, quarrying, oil and gas (+5.2%). The overall employment in goods-producing industries increased by 0.8%.
Employment increases in the goods-producing industries, was mostly driven by construction (+5.7%), however agriculture experienced the highest employment growth rate (+10.3%). Employment declined in manufacturing (-2.4%), forestry, fishing, mining, quarrying, oil and gas (-5.2%) and utilities (-6.6%).
Employment change by industry, services-producing industries
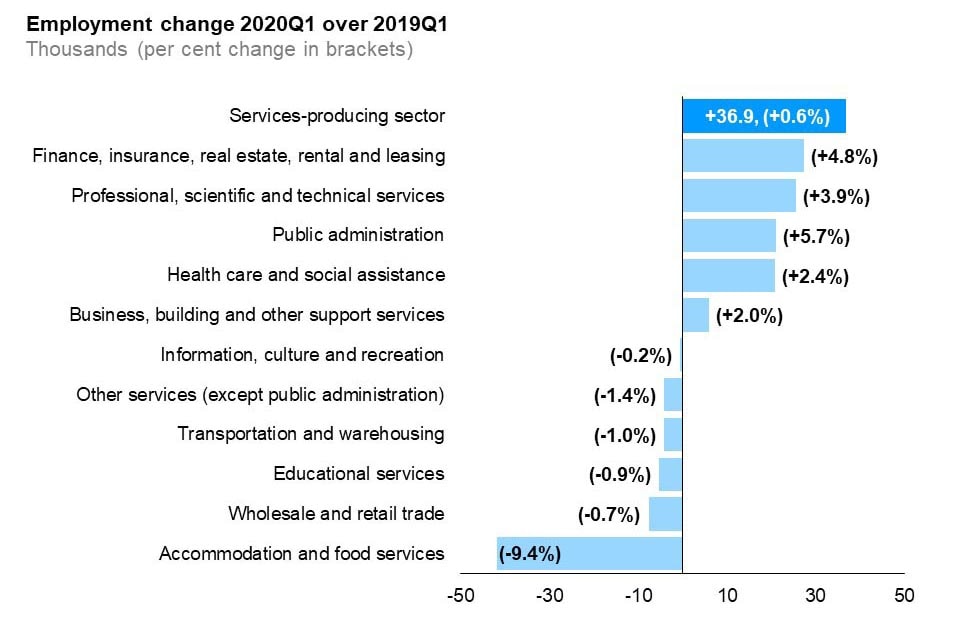
The horizontal bar chart shows a year-over-year (between the first quarters of 2019 and 2020) change in Ontario’s employment by industry for services-producing industries. Almost half of the services-producing industries had an increase in employment. Finance, insurance, real estate, rental and leasing experienced the largest employment gain (+4.8%) followed by professional, scientific and technical services (+3.9%) and public administration (+5.7%). The largest employment decline occurred in accommodation and food services (-9.4%) followed by wholesale and retail trade (-0.7%) and educational services (-0.9%). The overall employment in services-producing industries increased by 0.6%.
Among services-producing industries, finance, insurance, real estate, rental and leasing gained the most jobs (+4.8%) while public administration experienced the highest rate of employment growth (+5.7%). Compared to the same quarter last year, professional, scentific and technical services (+3.9%), health care and social assistance (+2.4%) and business, building and other support services (+2.0%) were among services-producing industries that gained jobs.
Accomodation and food services had a significant decline in employment (-9.4%), likely due to the COVID-19 outbreak. Wholesale and retail trade (-0.7%), educational services (-0.9%) and transportation and werehousing (-1.0%) were also among the services-producing industries in which employment decreased the most.
Employment change by occupational group
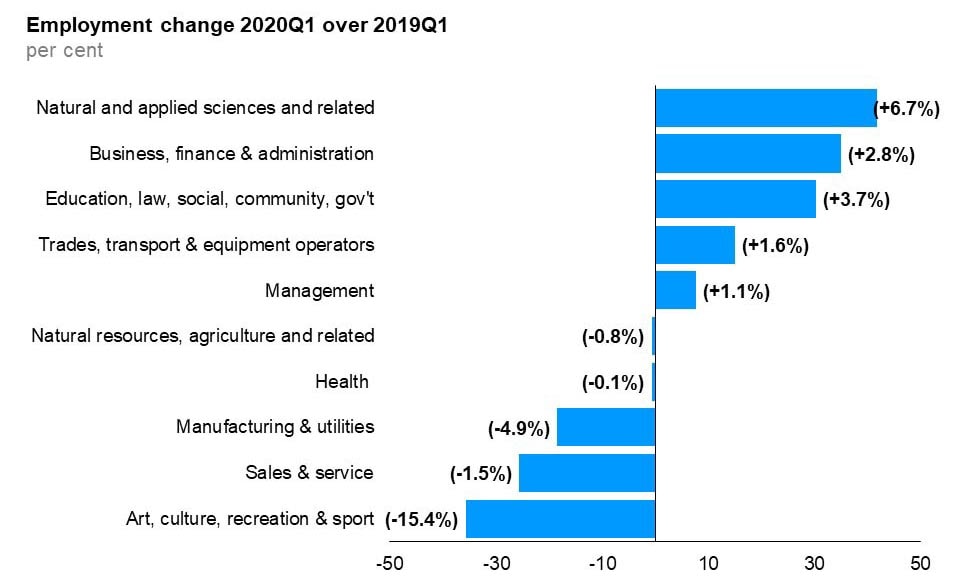
The horizontal bar chart shows a year-over-year (between the first quarters of 2019 and 2020) change in Ontario’s employment by broad occupational group. Five occupational groups experienced employment gains. Natural and applied sciences and related occupations (+6.7%) experienced the biggest employment gain followed by business, finance and administration occupations (+2.8%) and education, law and social, community and government services occupations (+3.7%). Employment in five occupational categories decreased. Employment in art, culture, recreation and sport occupations declined the most (-15.4%) followed by sales and service (-1.5%) and manufacturing and utilities (-4.9%) occupations.
Among broad occupational groups, natural and applied sciences and related occupations experienced the largest employment gain and the highest employment growth (+6.7%) compared to the first quarter of 2019. Employment in art, culture, recreation and sport occupations experienced the biggest decline (-15.4%) folllowed by sales and service (-1.5%) and manufacturing and utilities (-4.9%) occupations.
Geographic region
Ontario regions
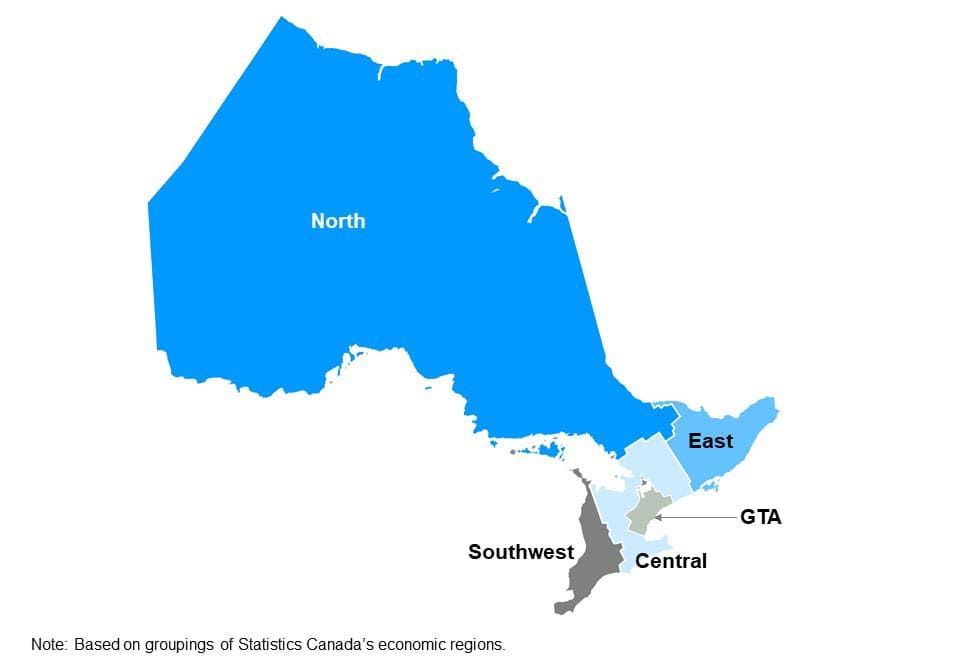
The map shows Ontario’s five regions: Northern Ontario, Eastern Ontario, Southwestern Ontario, Central Ontario and the Greater Toronto Area. This map is based on groupings of Statistics Canada’s economic regions.
Employment change by Ontario region

The horizontal bar chart shows a year-over-year (between the first quarters of 2019 and 2020) change in employment in the five Ontario regions: Northern Ontario, Eastern Ontario, Southwestern Ontario, Central Ontario and the Greater Toronto Area (GTA). Employment increased in three of the five regions. The rate of employment growth was highest in the Greater Toronto Area (GTA) (1.1%) followed by Central Ontario (+0.9%) and Southwestern Ontario (+0.8%). Employment decreased in Eastern Ontario (-0.4%) and Northern Ontario (-2.3%). The overall employment in Ontario increased by 0.7% (+48.6).
Year-over-year, employment increased in three of the five Ontario regions. The rate of employment growth was highest in the Greater Toronto Area (GTA)
Unemployment rates by Ontario region
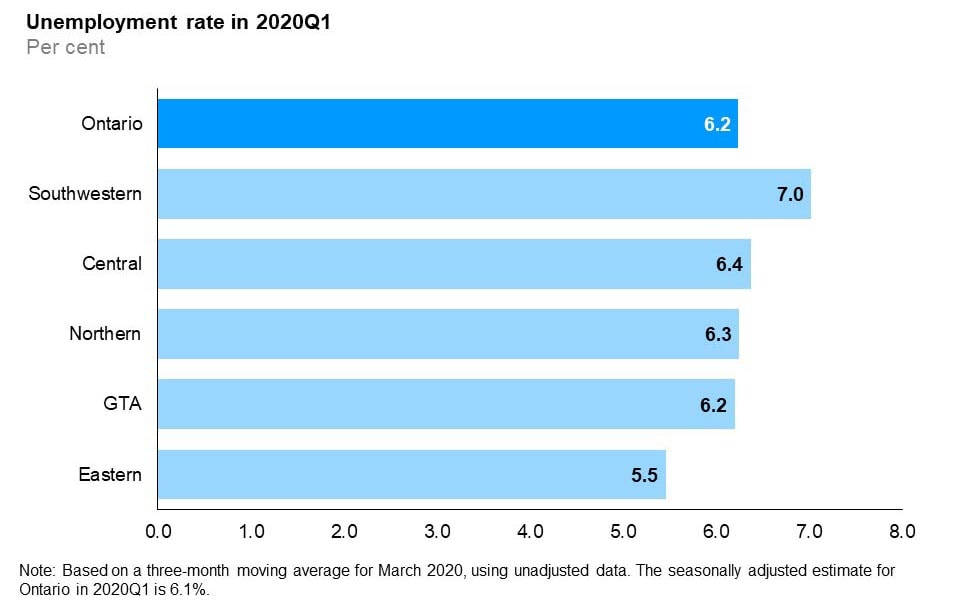
The horizontal bar chart shows unemployment rates by Ontario region in the first quarter of 2020. Southwestern Ontario had the highest unemployment rate at 7.0%, followed by Central Ontario (6.4%), Northern Ontario (6.3%), the Greater Toronto Area (6.2%) and Eastern Ontario (5.5%). The overall unemployment rate for Ontario was 6.2%.
In the first quarter of 2020, Eastern Ontario had the lowest unemployment rate (5.5%), while Southwestern Ontario had the highest unemployment rate (7.0%).
Participation rates by Ontario region
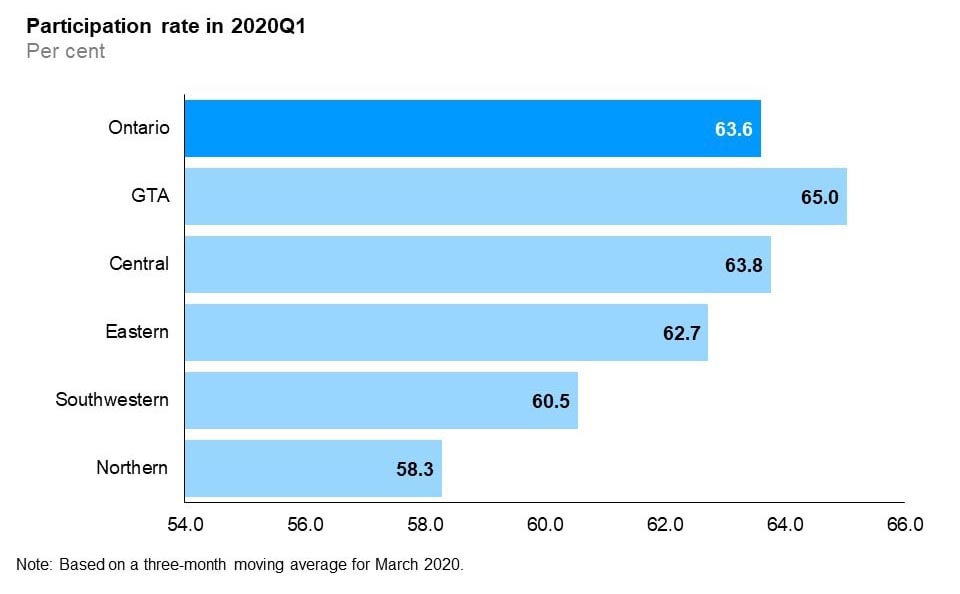
The horizontal bar chart shows participation rates by Ontario region in the first quarter of 2020. The Greater Toronto Area had the highest participation rate at 65.0%, followed by Central Ontario (63.8%), Eastern Ontario (62.7%), Southwestern Ontario (60.5%) and Northern Ontario (58.3%). The overall participation rate for Ontario was 63.6%.
Quarterly labour force participation rates varied considerably among the economic regions. In the first quarter of 2020, the participation rate ranged from 58.3% in Northern Ontario to 65.0% in the GTA.
Age and gender quarterly details
Employment change by age group and gender
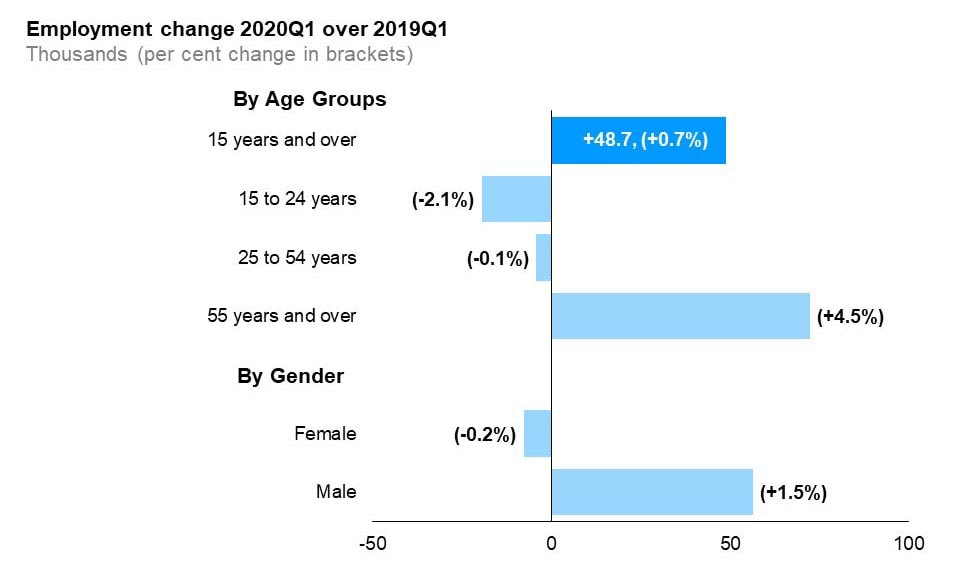
The horizontal bar chart shows a year-over-year (between the first quarters of 2019 and 2020) change in Ontario’s employment for the three major age groups, as well as by gender, compared to the overall population. Ontarians aged 55 years and over are the only age group that gained jobs (+4.5%). Employment for Ontarians aged 15 to 24 years declined by -2.1% and for Ontarians aged 25 to 54 years declined by -0.1%. Total employment (for population aged 15 and over) increased by 0.7%. Male employment increased year-over-year by +1.5% while female employment declined by -0.2%.
Compared to the same quarter last year, older workers (55 years and over) experienced above-average employment growth (+4.5%). Employment among core-aged workers (25 to 54 years) and youth (15 to 24 years) decreased by -0.1% and -2.1% respectively.
Male employment increased year-over-year by +1.5% while female employment decreased by -0.2%.
Unemployment rates by age group and gender
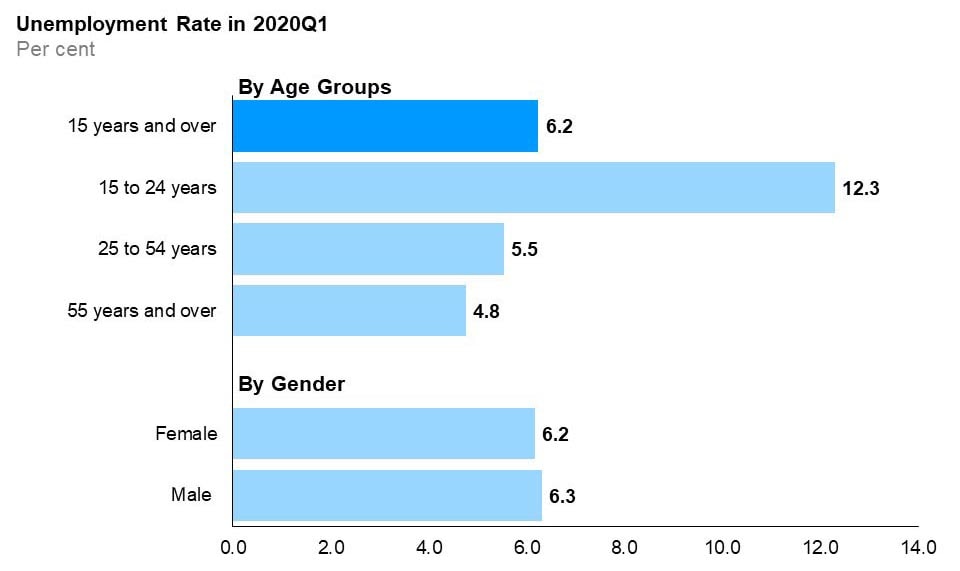
The horizontal bar chart shows unemployment rates for the three major age groups, as well as by gender, compared to the overall rate, in the fist quarter of 2020. Youth (15 to 24 years) had the highest unemployment rate at 12.3%, followed by the core-aged population (25 to 54 years) at 5.5% and older Ontarians (55 years and over) at 4.8%. The overall unemployment rate in the first quarter of 2020 was 6.2%. The male unemployment rate was 6.3% slightly higher than the female unemployment rate (6.2%).
In the first quarter of 2020, compared to a year ago, the unemployment rate decreased by 0.2 percentage points for males and increased by 0.9 percentage points for females. The youth unemployment rate decreased by 0.1 percentage points to 12.3% and remained the highest among the three age groups. The unemployment rate for core-aged workers increased by 0.6 percentage points to 5.5% and for older workers it decreased by 0.2 percentage points to 4.8% in the first quarter of 2020.
Participation rates by age group and gender
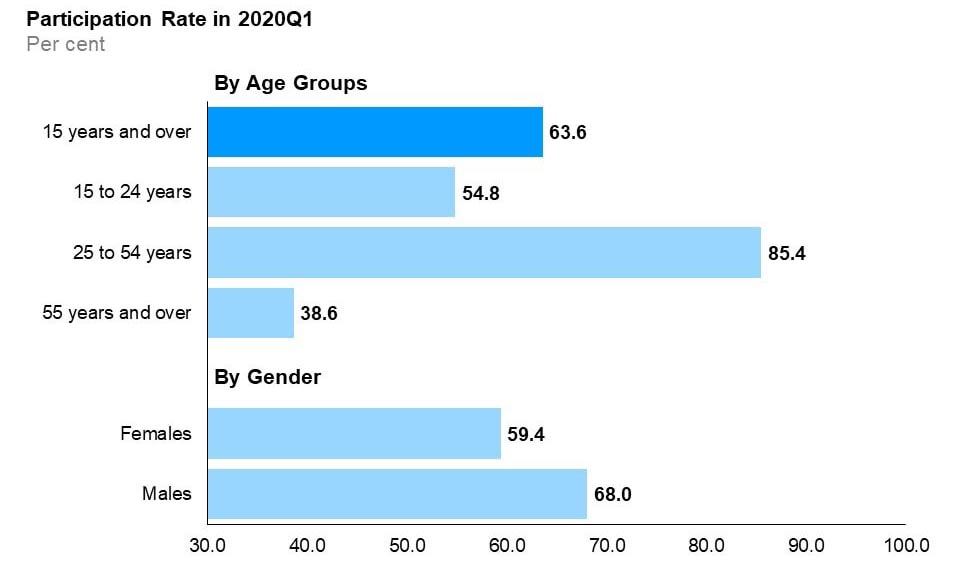
The horizontal bar chart shows labour force participation rates for the three major age groups, as well as by gender, compared to the overall rate, in the first quarter of 2020. The core-aged population (25 to 54 years old) had the highest labour force participation rate at 85.4%, followed by youth (15 to 24 years old) at 54.8%, and older Ontarians (55 years and over) at 38.6%. The overall participation rate was 63.6%. The male participation rate (68.0%) was higher than the female participation rate (59.4%).
In the first quarter of 2020, core-aged workers had the highest participation rate at 85.4%, followed by youth at 54.8% and older workers at 38.6%. Compared to a year ago, the participation rate decreased among all age groups except for older workers. The participation rates for both males and females decreased by 0.6 percentage points compared to the first quarter of 2019.
Education level and immigrant status quarterly details
Employment rates by education level and immigrant status (core-aged population)
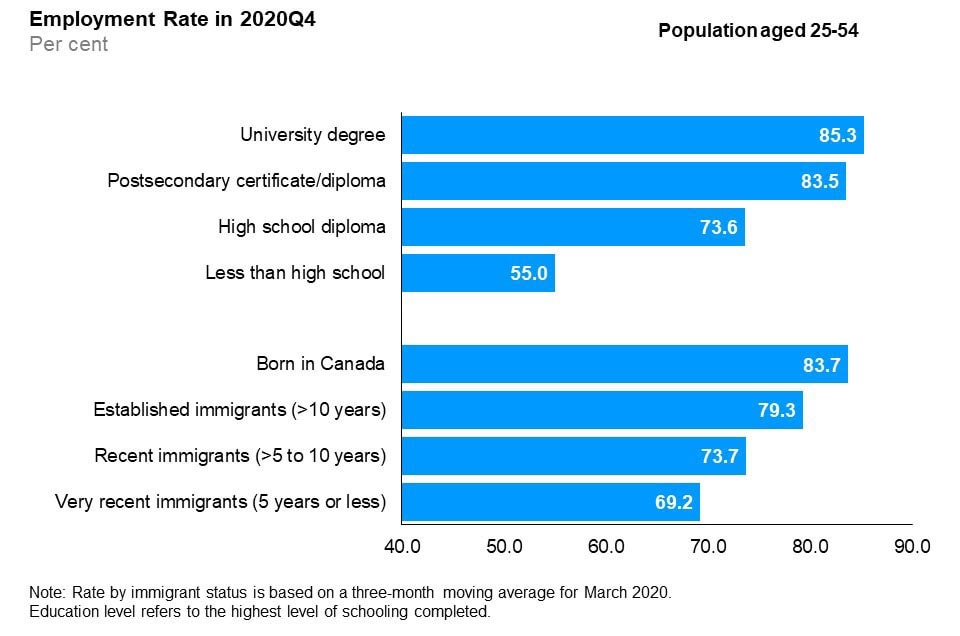
The horizontal bar chart shows employment rates by education level and immigrant status for the core-aged population (25 to 54 years old), in the first quarter of 2020. By education level, those with a university degree had the highest employment rate (85.3%), followed by those with a postsecondary certificate/diploma (83.5%), those with a high school diploma (73.6%), and those with less than high school education (55.0%). By immigrant status, those born in Canada had the highest employment rate (83.7%), followed by established immigrants with more than 10 years since landing (79.3%), recent immigrants with more than 5 to 10 years since landing (73.7%), and very recent immigrants with 5 years or less since landing (69.2%).
In the first quarter of 2020, those with less than a high school diploma continued to have the lowest employment rate (55.0%), while university degree holders recorded the highest employment rate (85.3%), followed by postsecondary certificate and diploma holders (83.5%).
Those born in Canada recorded the highest employment rate (83.7%), while very recent immigrants continued to have the lowest employment rate (69.2%).
Unemployment rates by education level and immigrant status (core-aged population)
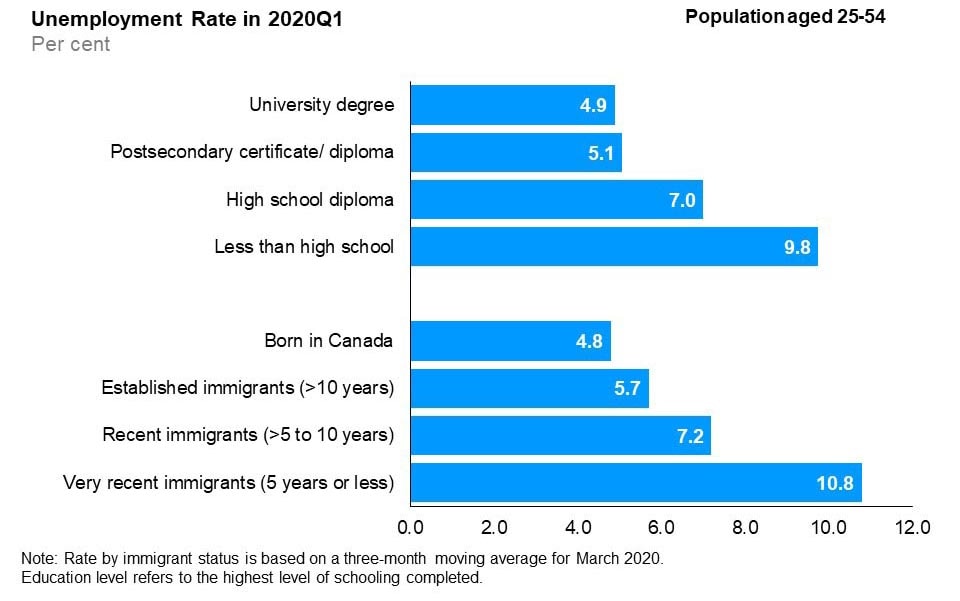
The horizontal bar chart shows unemployment rates by education level and immigrant status for the core-aged population (25 to 54 years old), in the first quarter of 2020. By education level, those with less than high school education had the highest unemployment rate (9.8%), followed by high school graduates (7.0%), those with a postsecondary certificate or diploma (5.1%), and university degree (4.9%). By immigrant status, very recent immigrants with 5 years or less since landing had the highest unemployment rate (10.8%), followed by recent immigrants with more than 5 to 10 years since landing (7.2%), established immigrants with more than 10 years since landing (5.7%) and those born in Canada (4.8%).
In the first quarter of 2020, university degree holders recorded the lowest unemployment rate (4.9%) among all education levels. Those with less than a high school diploma had the highest unemployment rate (9.8%). Year-over-year, the unemployment rate of core-aged workers for all education levels increased.
Year-over-year, the unemployment rate increased for all groups by immigrant status.
Participation rates by education level and immigrant status (core-aged population)
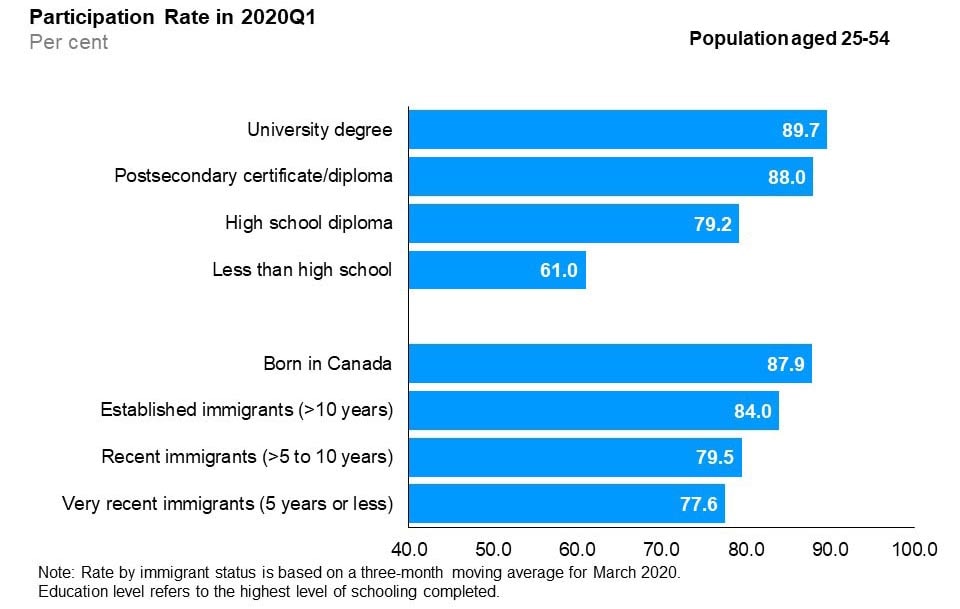
The horizontal bar chart shows labour force participation rates by education level and immigrant status for the core-aged population (25 to 54 years old), in the first quarter of 2020. By education level, university degree holders had the highest participation rate (89.7%), followed by postsecondary certificate or diploma holders (88.0%), high school graduates (79.2%), and those with less than high school education (61.0%). By immigrant status, those born in Canada had the highest participation rate (87.9%), followed by established immigrants with more than 10 years since landing (84.0%), recent immigrants with more than 5 to 10 years since landing (79.5%) and very recent immigrants with 5 years or less since landing (77.6%).
In the first quarter of 2020, university degree holders continued to record the highest participation rate (89.7%), while those with less than a high school diploma had the lowest participation rate (61.0%). Year-over-year, the participation rate for all education levels decreased.
In the first quarter of 2020, recent immigrants and very recent immigrants continued to have the lowest participation rate compared to established immigrants and those born in Canada. Year-over-year, the participation rate for recent immigrants increased (+4.1 percentage points) and decreased for other immigrant groups and those born in Canada.
Wages quarterly details
Average hourly wages by employment status, 1997-2019
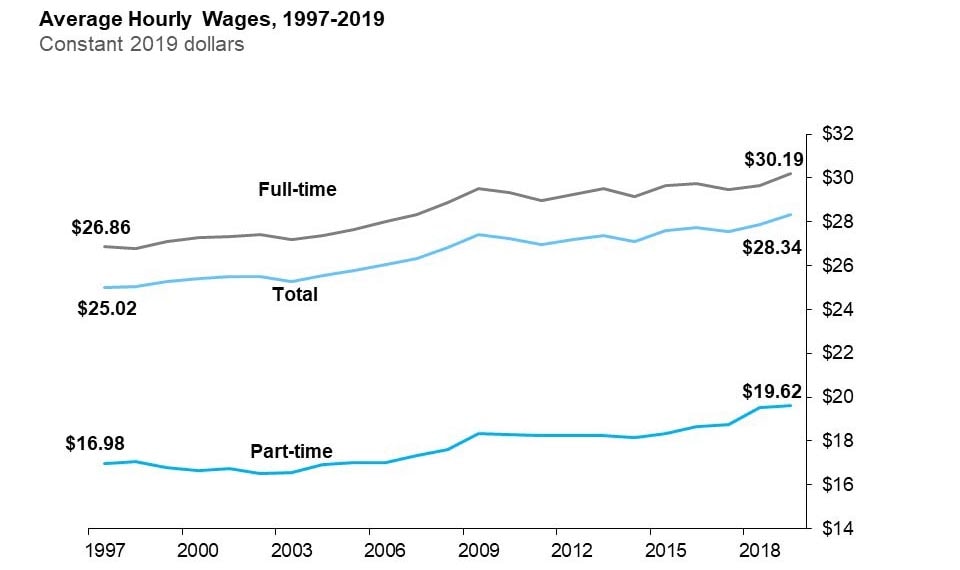
The line chart shows average hourly wages for all employees, full-time and part-time employees expressed in real 2019 dollars from 1997 to 2019. Real average hourly wages of all employees increased from $25.02 in 1997 to $28.34 in 2019; those of full-time employees increased from $26.86 in 1997 to $30.19 in 2019 and those of part-time employees increased from $16.98 in 1997 to $19.62 in 2019.
Over the last two decades, the average hourly wage increased in real terms
Hourly wage growth by type of work
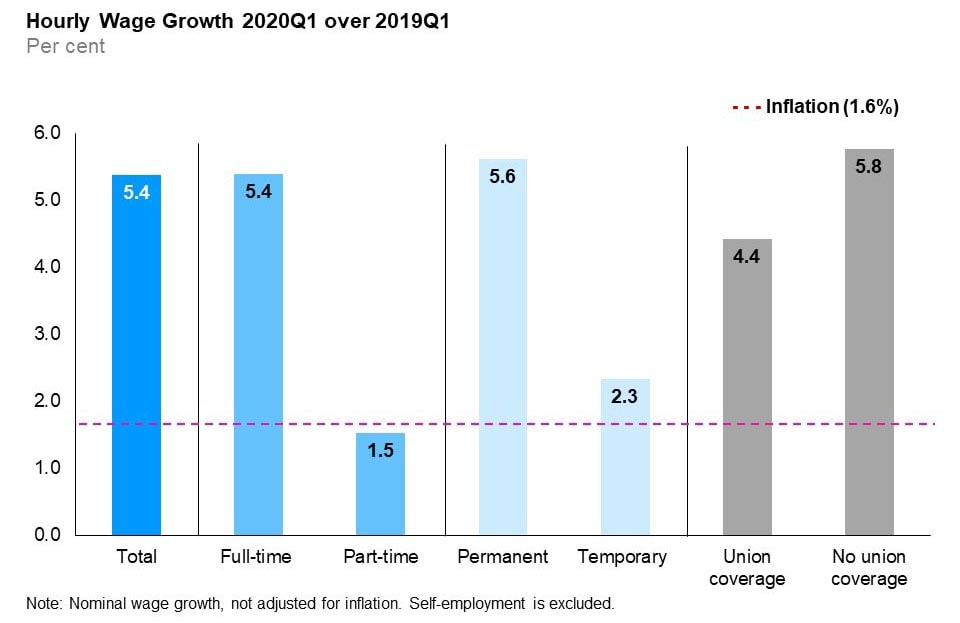
The vertical bar chart shows a year-over-year (between the first quarters of 2019 and 2020) per cent change in Ontario’s nominal hourly wages by type of work. The average hourly wage increased by 5.4%. Hourly wages increased for both full-time (+5.4%) and part-time employees (+1.5%); permanent (+5.6%) and temporary employees (+2.3%) and employees with union coverage (+4.4%) and those without union coverage (+5.8%). Inflation during the same period was 2.0%.
In the first quarter of 2020, the average hourly wage of Ontario employees was $29.40, an increase of 5.4% from the first quarter of 2019.
Consumer Price Index inflation over the same period was 1.6%.
Average hourly wage rate and wage growth by occupational group
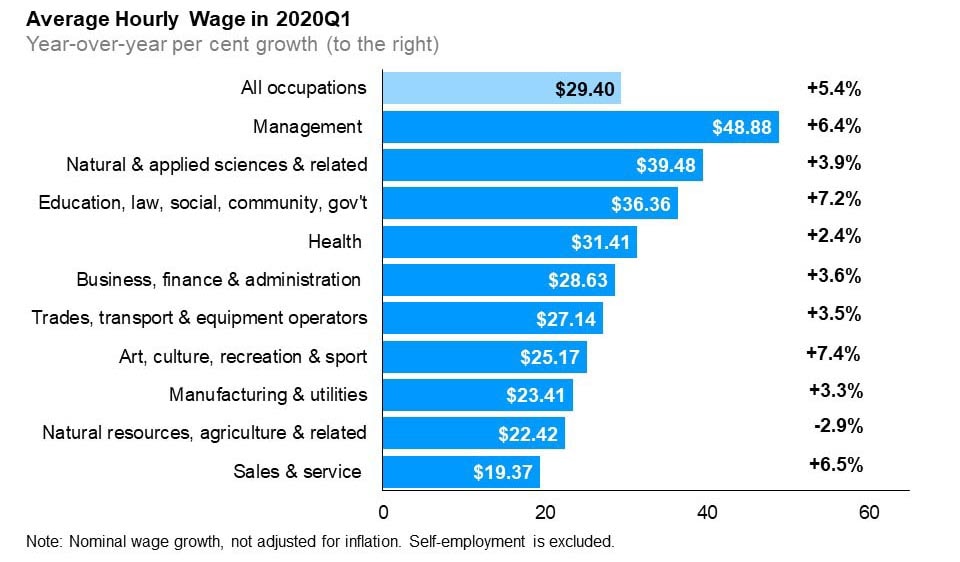
The horizontal bar chart shows average hourly wage rates in the first quarter of 2020 and year-over-year (between the first quarters of 2019 and 2020) wage growth in average hourly wage rate, by occupational group. In the first quarter of 2020, the average hourly wage rate for Ontario was $29.40 (+5.4%). The highest average hourly wage rate was for management occupations at $48.88 (+6.4%); followed by natural and applied sciences and related occupations at $39.48 (+3.9%); and occupations in education, law and social, community and government services at $36.36 (+7.2%). The lowest average hourly wage rate was for sales and service occupations at $19.37 (+6.5%).
Year-over-year, all broad occupational groups experienced growth in average hourly wages, except for natural resources, agriculture and related occupations (-2.9%). The three broad occupational groups that experienced the highest wage growth were: art, culture, recreation and sport (+7.4%), education, law and social, community and government services (+7.2%), and sales and service (+6.5%).
Appendix I
The impacts of COVID-19 on the labour market
The first quarter of 2020 included data from March 2020, in which the impacts of the COVID-19 outbreak started to take place. Interventions such as the closure of non-essential businesses, travel restrictions, and public health measures limiting public interactions resulted in a significant slowdown in economic activity and a sudden shock to the labour market. The slowdown continued beyond the month of March and will likely be more fully reflected in the following months data and the Ontario Employment Report in the second quarter of 2020.
To illustrate some of the early impacts of COVID-19 on the labour market, below are comparisons of employment data between March and February 2020 (seasonally-adjusted) and between March 2019 and March 2020 (seasonally-unadjusted).
| March-over-February 2020 (seasonally-adjusted) | March 2020 over March 2019 (unadjusted) | |
|---|---|---|
| Employment | Employment in the province decreased in March by 402,800 from February. | Compared to a year ago, employment in March 2020 decreased by 232,700. |
| Unemployment rate | Unemployment rate increased from 5.5% in February to 7.6% in March. | Unemployment rate increased from 6.3% in March 2019 to 8.0% in March 2020. |
| Participation rate | Participation rate decreased from 65.1% in February to 63.0% in March | Participation rate decreased from 64.3% in March 2019 to 62.2% in March 2020 |
| Full-time positions | Full-time positions decreased by 248,500, while part-time positions were down 154,300. | Full-time positions decreased by 80,900, while part-time positions were down 151,800. |
| Services-producing sector | Service sector employment declined by 350,000 in March, led by lower employment in accommodation and food services (-119,600). | Service sector employment declined by 210,800, led by lower employment in accommodation and food services (-115,700). |
| Goods-producing sector | Goods sector employment decreased by 52,800 in March, led by lower employment in manufacturing (-31,600) and utilities (-7,700) | Goods sector employment decreased by 21,900, led by lower employment in manufacturing (-33,200) and utilities (-9,800) |
| Youth employment | Employment for youth decreased by 158,800 in March 2020. The impact was highest among female youth, for which employment decreased by 97,800 jobs, while male youth employment decreased by 61,000 jobs. | Employment for youth decreased by 128,100 jobs. The impact was higher among female youth, for which employment decreased by 67,600 jobs, while male youth employment decreased by 60,600 jobs. |
Appendix II
Overview of annual employment ten-year review
| 2010 | 2011 | 2012 | 2013 | 2014 | 2015 | 2016 | 2017 | 2018 | 2019 | |
|---|---|---|---|---|---|---|---|---|---|---|
| Total Labour Force (000) | 7,160.9 | 7,227.4 | 7,276.4 | 7,383.8 | 7,418.6 | 7,426.1 | 7,489.5 | 7,579.8 | 7,673.0 | 7,890.6 |
| Participation Rate (%) | 66.8 | 66.6 | 66.2 | 66.3 | 65.8 | 65.2 | 65.0 | 64.9 | 64.5 | 65.1 |
| Male Participation Rate (%) | 71.1 | 71.1 | 70.7 | 70.5 | 70.3 | 70 | 69.5 | 69.2 | 68.7 | 69.6 |
| Female Participation Rate (%) | 62.8 | 62.3 | 61.9 | 62.2 | 61.6 | 60.7 | 60.7 | 60.7 | 60.5 | 60.7 |
| Total Employment (000) | 6,537.8 | 6,658.4 | 6,702.6 | 6,823.4 | 6,877.9 | 6,923.2 | 6,999.6 | 7,128.0 | 7,242.4 | 7,452.6 |
| - Full-time (000) | 5,256.1 | 5,373.5 | 5,412.0 | 5,489.5 | 5,540.0 | 5,618.2 | 5,672.6 | 5,778.7 | 5,909.0 | 6,065.8 |
| - Part-time (000) | 1,281.8 | 1,284.8 | 1,290.6 | 1,334.0 | 1,337.9 | 1,305.0 | 1,327.0 | 1,349.3 | 1,333.4 | 1,386.8 |
| Employment-Population Ratio (%) | 61.0 | 61.4 | 60.9 | 61.2 | 61.0 | 60.8 | 60.7 | 61.0 | 60.9 | 61.4 |
| Male Employment (000) | 3,363.6 | 3,450.4 | 3,471.5 | 3,522.8 | 3,567.1 | 3,607.1 | 3,635.9 | 3,700.9 | 3,763.9 | 3,894.7 |
| Female Employment (000) | 3,174.2 | 3,207.9 | 3,231.1 | 3,300.6 | 3,310.8 | 3,316.1 | 3,363.7 | 3,427.1 | 3,478.5 | 3,557.9 |
| Part-Time (% of total) | 19.6 | 19.3 | 19.3 | 19.6 | 19.5 | 18.8 | 19.0 | 18.9 | 18.4 | 18.6 |
| Goods-Producing Sector Employment (000) | 1,380.6 | 1,408.7 | 1,415.3 | 1,397.5 | 1,382.0 | 1,401.4 | 1,418.1 | 1,432.6 | 1,453.1 | 1,467.8 |
| Services-Producing Sector Employment (000) | 5,157.3 | 5,249.7 | 5,287.3 | 5,425.9 | 5,495.9 | 5,521.7 | 5,581.4 | 5,695.4 | 5,789.2 | 5,984.8 |
| Private Sector Employment (000) | 4,268.2 | 4,339.7 | 4,373.0 | 4,447.0 | 4,517.0 | 4,540.7 | 4,597.3 | 4,690.6 | 4,740.6 | 4,863.4 |
| Public Sector Employment (000) | 1,254.7 | 1,294.3 | 1,286.0 | 1,314.0 | 1,305.4 | 1,294.1 | 1,306.4 | 1,329.1 | 1,376.7 | 1,385.9 |
| Self-Employment (% of total) | 15.5 | 15.4 | 15.6 | 15.6 | 15.3 | 15.7 | 15.7 | 15.5 | 15.5 | 16.1 |
| Total Unemployment (000) | 623.1 | 569.1 | 573.8 | 560.3 | 540.7 | 502.9 | 489.9 | 451.8 | 430.7 | 438.0 |
| Unemployment Rate (%) | 8.7 | 7.9 | 7.9 | 7.6 | 7.3 | 6.8 | 6.5 | 6.0 | 5.6 | 5.6 |
| Male Unemployment Rate (%) | 9.4 | 8.2 | 8.3 | 8.0 | 7.5 | 7 | 6.8 | 6.2 | 5.6 | 5.7 |
| Female Unemployment Rate (%) | 8.0 | 7.6 | 7.5 | 7.2 | 7.1 | 6.5 | 6.3 | 5.7 | 5.6 | 5.4 |
| Long-Term (27 wks+) (% of total) | 24.9 | 24.1 | 22.7 | 22.9 | 22.8 | 20.0 | 19.9 | 19.5 | 16.9 | 15.1 |
| Average Unemployment in Weeks | 22.0 | 22.4 | 22.2 | 21.8 | 22.4 | 20.0 | 19.9 | 19.3 | 17.2 | 15.9 |
| Youth Unemployment Rate (%) | 17.4 | 15.9 | 17.0 | 16.2 | 15.7 | 14.7 | 14.0 | 12.3 | 11.9 | 12.1 |
| 25-54 y.o. Unemployment rate (%) | 7.3 | 6.5 | 6.4 | 6.2 | 5.9 | 5.6 | 5.4 | 5.0 | 4.7 | 4.6 |
| 55+ y.o. Unemployment rate (%) | 6.4 | 6.0 | 5.8 | 5.5 | 5.3 | 4.9 | 4.9 | 4.5 | 4.2 | 4.1 |
| Average Weekly Wage Rate ($) | 842.35 | 862.45 | 883.12 | 895.56 | 907.17 | 938.09 | 958.5 | 967.44 | 1,001.74 | 1,036.51 |
| Average Hourly Wage Rate ($) | 23.09 | 23.55 | 24.09 | 24.48 | 24.82 | 25.59 | 26.15 | 26.43 | 27.36 | 28.34 |
Employment by region (000)
| 2010 | 2011 | 2012 | 2013 | 2014 | 2015 | 2016 | 2017 | 2018 | 2019 | |
|---|---|---|---|---|---|---|---|---|---|---|
| Greater Toronto Area | 3,034.6 | 3,077.8 | 3,112.3 | 3,240.2 | 3,241.1 | 3,320.4 | 3,373.2 | 3,442.9 | 3,521.6 | 3,652.9 |
| Central | 1,508.1 | 1,552.0 | 1,551.4 | 1,559.5 | 1,597.2 | 1,597.5 | 1,598.0 | 1,655.2 | 1,656.9 | 1,690.8 |
| Southwestern | 761.7 | 771.1 | 772.9 | 769.4 | 775.0 | 770.5 | 775.8 | 778.4 | 794.3 | 793.5 |
| Eastern | 879.6 | 897.0 | 908.7 | 898.4 | 907.9 | 889.2 | 904.9 | 903.4 | 916.0 | 963.6 |
| Northern | 354.0 | 360.4 | 357.3 | 355.9 | 356.6 | 345.5 | 347.7 | 348.2 | 353.6 | 351.9 |
Unemployment rate by region (%)
| 2010 | 2011 | 2012 | 2013 | 2014 | 2015 | 2016 | 2017 | 2018 | 2019 | |
|---|---|---|---|---|---|---|---|---|---|---|
| Greater Toronto Area | 9.2 | 8.4 | 8.8 | 8.2 | 8.0 | 7.1 | 6.9 | 6.4 | 6.1 | 5.9 |
| Central | 8.4 | 7.4 | 7.0 | 6.9 | 6.2 | 5.9 | 5.9 | 5.3 | 5.2 | 5.1 |
| Southwestern | 9.1 | 8.1 | 7.8 | 7.7 | 7.0 | 6.9 | 6.1 | 5.6 | 5.2 | 5.5 |
| Eastern | 7.2 | 6.7 | 6.6 | 6.6 | 7.0 | 6.7 | 6.4 | 5.7 | 4.9 | 4.9 |
| Northern | 8.3 | 7.8 | 7.2 | 7.4 | 6.6 | 7.2 | 7.1 | 6.4 | 5.8 | 6.0 |
Total employment by CMA (000)
Greater Toronto Area
| 2010 | 2011 | 2012 | 2013 | 2014 | 2015 | 2016 | 2017 | 2018 | 2019 | |
|---|---|---|---|---|---|---|---|---|---|---|
| Toronto | 2,880.3 | 2,923.4 | 2,960.6 | 3,092.1 | 3,087.4 | 3,176.7 | 3,215.0 | 3,289.6 | 3,353.0 | 3,491.5 |
| Oshawa | 184.3 | 189.0 | 190.0 | 194.5 | 201.4 | 196.4 | 214.0 | 210.4 | 220.6 | 218.6 |
Central Ontario
| 2010 | 2011 | 2012 | 2013 | 2014 | 2015 | 2016 | 2017 | 2018 | 2019 | |
|---|---|---|---|---|---|---|---|---|---|---|
| Hamilton | 369.1 | 375.1 | 376.6 | 374.8 | 383.7 | 385.4 | 385.8 | 417.9 | 413.8 | 422.8 |
| Kitchener | 258.1 | 270.5 | 271.6 | 278.9 | 283.1 | 279.8 | 281.6 | 287.8 | 292.2 | 302.1 |
| St. Catharines-Niagara | 190.4 | 196.1 | 201.8 | 193.5 | 195.4 | 204.1 | 203.1 | 197.6 | 201.7 | 199.6 |
| Peterborough | 56.6 | 57.6 | 58.5 | 54.9 | 60.5 | 61.2 | 59.5 | 61.2 | 63.6 | 61.1 |
| Brantford | 67.4 | 68.5 | 67.5 | 68.9 | 68.6 | 69.3 | 70.2 | 72.3 | 70.0 | 78.7 |
| Guelph | 79.2 | 82.0 | 83.9 | 79.8 | 81.8 | 90.5 | 90.6 | 90.8 | 88.8 | 92.6 |
| Barrie | 99.1 | 101.5 | 102.3 | 109.4 | 111.6 | 108.4 | 104.2 | 115.6 | 114.6 | 119.2 |
Eastern Ontario
| 2010 | 2011 | 2012 | 2013 | 2014 | 2015 | 2016 | 2017 | 2018 | 2019 | |
|---|---|---|---|---|---|---|---|---|---|---|
| Ottawa | 515.3 | 517.4 | 535.4 | 523.5 | 533.8 | 531.1 | 543.4 | 546.7 | 557.6 | 590.1 |
| Kingston | 76.7 | 79.3 | 80.6 | 82.6 | 81.4 | 82.9 | 83.6 | 87.3 | 86.4 | 87.5 |
Southwestern Ontario
| 2010 | 2011 | 2012 | 2013 | 2014 | 2015 | 2016 | 2017 | 2018 | 2019 | |
|---|---|---|---|---|---|---|---|---|---|---|
| London | 239.6 | 237.7 | 242.3 | 240.4 | 243.0 | 252.0 | 245.9 | 245.8 | 252.9 | 251.2 |
| Windsor | 147.5 | 147.9 | 153.3 | 154.8 | 155.2 | 158.0 | 164.1 | 162.8 | 164.5 | 170.4 |
Northern Ontario
| 2010 | 2011 | 2012 | 2013 | 2014 | 2015 | 2016 | 2017 | 2018 | 2019 | |
|---|---|---|---|---|---|---|---|---|---|---|
| Sudbury | 80.7 | 82.1 | 80.8 | 83.3 | 83.1 | 82.3 | 81.7 | 81.1 | 81.4 | 85.2 |
| Thunder Bay | 60.2 | 60.3 | 61.8 | 62.8 | 61.5 | 59.7 | 60.1 | 61.5 | 63.7 | 61.7 |
Overview of quarterly employment year-over-year
| 2018q2 | 2019q2 | 2018q3 | 2019q3 | 2018q4 | 2019q4 | 2019q1 | 2020q1 | |
|---|---|---|---|---|---|---|---|---|
| Total Labour Force (000) | 7,717.1 | 7,913.8 | 7,782.4 | 8,002.8 | 7,682.1 | 7,917.9 | 7,728.0 | 7,804.0 |
| Participation Rate (%) | 65.0 | 65.4 | 65.2 | 65.8 | 64.1 | 64.8 | 64.2 | 63.6 |
| Male Participation Rate (%) | 69.1 | 70.0 | 69.6 | 70.8 | 68.4 | 69.0 | 68.6 | 68.0 |
| Female Participation Rate (%) | 61.1 | 61.0 | 61.1 | 61.0 | 60.0 | 60.7 | 60.0 | 59.3 |
| Total Employment (000) | 7,269.2 | 7,472.1 | 7,315.2 | 7,535.0 | 7,302.7 | 7,535.2 | 7,268.2 | 7,317.0 |
| - Full-time (000) | 5,970.2 | 6,096.2 | 6,049.1 | 6,218.9 | 5,909.0 | 6,089.8 | 5,858.2 | 5,955.2 |
| - Part-time (000) | 1,299.0 | 1,375.9 | 1,266.0 | 1,316.1 | 1,393.7 | 1,445.4 | 1,409.9 | 1,361.8 |
| Employment-Population Ratio (%) | 61.2 | 61.8 | 61.3 | 61.9 | 60.9 | 61.6 | 60.4 | 59.6 |
| Male Employment (000) | 3,773.8 | 3,906.0 | 3,833.8 | 3,982.6 | 3,794.3 | 3,919.1 | 3,771.2 | 3,827.7 |
| Female Employment (000) | 3,495.4 | 3,566.1 | 3,481.3 | 3,552.4 | 3,508.4 | 3,616.1 | 3,497.0 | 3,489.3 |
| Part-Time (% of total) | 17.9 | 18.4 | 17.3 | 17.5 | 19.1 | 19.2 | 19.4 | 18.6 |
| Goods-Producing Sector Employment (000) | 1,451.7 | 1,474.0 | 1,491.0 | 1,512.0 | 1,463.0 | 1,474.2 | 1,411.0 | 1,422.8 |
| Services-Producing Sector Employment (000) | 5,817.5 | 5,998.1 | 5,824.2 | 6,023.0 | 5,839.7 | 6,061.0 | 5,857.2 | 5,894.1 |
| Private Sector Employment (000) | 4,756.9 | 4,872.6 | 4,810.7 | 4,944.3 | 4,774.8 | 4,885.3 | 4,751.6 | 4,729.6 |
| Public Sector Employment (000) | 1,396.0 | 1,389.3 | 1,373.5 | 1,350.5 | 1,385.1 | 1,435.4 | 1,368.5 | 1,413.3 |
| Self-Employment (% of total) | 15.4 | 16.2 | 15.5 | 16.5 | 15.6 | 16.1 | 15.8 | 16.0 |
| Total Unemployment (000) | 447.9 | 441.7 | 467.2 | 467.8 | 379.4 | 382.7 | 459.8 | 487.0 |
| Unemployment Rate (%) | 5.8 | 5.6 | 6.0 | 5.8 | 4.9 | 4.8 | 5.9 | 6.2 |
| Male Unemployment Rate (%) | 5.8 | 5.7 | 5.5 | 5.4 | 5.2 | 5.0 | 6.6 | 6.3 |
| Female Unemployment Rate (%) | 5.8 | 5.5 | 6.6 | 6.3 | 4.6 | 4.6 | 5.3 | 6.2 |
| Long-Term (27 wks+) (% of total) | 17.1 | 14.4 | 16.9 | 13.8 | 17.3 | 16.4 | 16.0 | 14.3 |
| Average Unemployment in Weeks | 17.5 | 15.5 | 16.8 | 14.1 | 17.5 | 17.6 | 16.6 | 15.4 |
| Youth Unemployment Rate (%) | 13.0 | 12.5 | 12.1 | 12.7 | 10.8 | 10.5 | 12.4 | 12.3 |
| 25-54 y.o. Unemployment rate (%) | 4.7 | 4.5 | 5.2 | 4.8 | 4.2 | 4.1 | 5.0 | 5.5 |
| 55+ y.o. Unemployment rate (%) | 4.3 | 4.2 | 4.1 | 4.1 | 3.5 | 3.4 | 4.9 | 4.8 |
| Average Weekly Wage Rate ($) | 1,007.3 | 1,035.2 | 1,004.2 | 1,048.3 | 1,000.7 | 1,047.6 | 1,014.3 | 1,074.9 |
| Average Hourly Wage Rate ($) | 27.4 | 28.3 | 27.3 | 28.5 | 27.5 | 28.7 | 27.9 | 29.4 |
Employment by Region (000)
| 2018q2 | 2019q2 | 2018q3 | 2019q3 | 2018q4 | 2019q4 | 2019q1 | 2020q1 | |
|---|---|---|---|---|---|---|---|---|
| Greater Toronto Area (GTA) | 3,538.8 | 3,659.1 | 3,535.7 | 3,704.3 | 3,545.4 | 3,684.9 | 3,563.5 | 3,603.6 |
| Central | 1,646.6 | 1,699.4 | 1,686.1 | 1,698.7 | 1,696.3 | 1,714.2 | 1,650.7 | 1,665.2 |
| Southwestern | 801.3 | 797.0 | 810.3 | 798.0 | 790.3 | 806.7 | 772.4 | 778.4 |
| Eastern | 924.4 | 962.8 | 917.9 | 979.3 | 916.1 | 980.5 | 931.6 | 927.6 |
| Northern | 358.0 | 353.8 | 365.4 | 354.8 | 354.5 | 348.8 | 350.0 | 342.0 |
Unemployment Rate by Region (%)
| 2018q2 | 2019q2 | 2018q3 | 2019q3 | 2018q4 | 2019q4 | 2019q1 | 2020q1 | |
|---|---|---|---|---|---|---|---|---|
| Greater Toronto Area (GTA) | 6.4 | 5.9 | 6.6 | 6.2 | 5.5 | 5.0 | 6.4 | 6.2 |
| Central | 5.5 | 5.1 | 5.5 | 5.5 | 4.1 | 4.7 | 5.2 | 6.4 |
| Southwestern | 5.0 | 4.8 | 5.5 | 6.2 | 4.4 | 4.7 | 6.1 | 7.0 |
| Eastern | 4.8 | 5.2 | 5.1 | 5.0 | 4.6 | 4.2 | 5.2 | 5.5 |
| Northern | 5.9 | 6.8 | 5.5 | 5.7 | 5.5 | 5.2 | 6.1 | 6.3 |
Total Employment by CMA (000)
Greater Toronto Area
| 2018q2 | 2019q2 | 2018q3 | 2019q3 | 2018q4 | 2019q4 | 2019q1 | 2020q1 | |
|---|---|---|---|---|---|---|---|---|
| Toronto | 3,363.4 | 3,492.2 | 3,361.9 | 3,545.3 | 3,380.9 | 3,534.9 | 3,393.6 | 3,454.3 |
| Oshawa | 228.6 | 227.0 | 222.4 | 214.8 | 219.5 | 209.7 | 222.9 | 214.5 |
Central Ontario
| 2018q2 | 2019q2 | 2018q3 | 2019q3 | 2018q4 | 2019q4 | 2019q1 | 2020q1 | |
|---|---|---|---|---|---|---|---|---|
| Hamilton | 414.3 | 415.4 | 412.4 | 423.1 | 420.7 | 437.6 | 415.1 | 417.0 |
| Kitchener | 286.5 | 306.3 | 303.1 | 303.4 | 302.3 | 303.3 | 295.6 | 302.0 |
| St. Catharines-Niagara | 204.4 | 196.0 | 205.1 | 203.1 | 201.8 | 206.8 | 192.4 | 188.2 |
| Peterborough | 62.0 | 62.3 | 66.3 | 60.7 | 66.5 | 59.2 | 62.2 | 52.7 |
| Brantford | 68.5 | 80.9 | 68.9 | 80.7 | 71.8 | 77.8 | 75.5 | 71.6 |
| Guelph | 86.8 | 95.3 | 88.6 | 91.8 | 92.9 | 89.0 | 94.4 | 88.2 |
| Barrie | 112.3 | 117.9 | 120.9 | 119.2 | 119.1 | 125.0 | 114.9 | 124.8 |
Eastern Ontario
| 2018q2 | 2019q2 | 2018q3 | 2019q3 | 2018q4 | 2019q4 | 2019q1 | 2020q1 | |
|---|---|---|---|---|---|---|---|---|
| Ottawa (Ontario part) | 567.2 | 575.2 | 557.3 | 606.2 | 553.7 | 614.1 | 564.9 | 572.3 |
| Kingston | 87.3 | 91.2 | 87.9 | 87.5 | 85.1 | 85.3 | 86.1 | 84.0 |
Southwestern Ontario
| 2018q2 | 2019q2 | 2018q3 | 2019q3 | 2018q4 | 2019q4 | 2019q1 | 2020q1 | |
|---|---|---|---|---|---|---|---|---|
| London | 257.9 | 244.9 | 260.3 | 251.9 | 247.8 | 261.5 | 246.5 | 260.3 |
| Windsor | 164.2 | 174.4 | 163.7 | 168.6 | 169.1 | 167.2 | 171.5 | 158.5 |
Northern Ontario
| 2018q2 | 2019q2 | 2018q3 | 2019q3 | 2018q4 | 2019q4 | 2019q1 | 2020q1 | |
|---|---|---|---|---|---|---|---|---|
| Sudbury | 80.8 | 85.8 | 82.2 | 85.0 | 84.6 | 85.0 | 84.9 | 81.9 |
| Thunder Bay | 65.7 | 62.3 | 65.3 | 62.6 | 61.7 | 62.3 | 59.8 | 59.7 |
Overview of monthly* labour force characteristics
| Mar-19 | Apr-19 | May-19 | Jun-19 | Jul-19 | Aug-19 | Sep-19 | Oct-19 | Nov-19 | Dec-19 | Jan-20 | Feb-20 | Mar-20 | |
|---|---|---|---|---|---|---|---|---|---|---|---|---|---|
| Employment | 7379.9 | 7422.4 | 7435.4 | 7433.2 | 7430.3 | 7485.4 | 7519.3 | 7507.4 | 7525.3 | 7542.4 | 7558.3 | 7555.1 | 7,152.3 |
| Unemployment rate | 5.9 | 5.9 | 5.2 | 5.5 | 5.7 | 5.6 | 5.3 | 5.3 | 5.5 | 5.3 | 5.2 | 5.5 | 7.6 |
| Participation rate | 65.0 | 65.3 | 64.9 | 64.9 | 64.9 | 65.2 | 65.1 | 65.0 | 65.2 | 65.1 | 65.1 | 65.1 | 63.0 |
*Seasonally-adjusted
Note: All estimates in this appendix are based on Statistics Canada’s Labour Force Survey.
Footnotes
- footnote[1] Back to paragraph For further details on LFS notes related to COVID-19, please refer to Statistics Canada Labour Force Survey, March 2020 accessed at https://www150.statcan.gc.ca/n1/daily-quotidien/200409/dq200409a-eng.htm?CMP=mstatcan
- footnote[2] Back to paragraph This economic region closely matches the GTA, the main exception being that it excludes the city of Burlington.
- footnote[3] Back to paragraph Real wages are based on nominal wages deflated by the Consumer Price Index (CPI) for all items. Self-employment is excluded.
- footnote[4] Back to paragraph Year-over-year comparison (between first quarters of 2019 and 2020) is in nominal dollars.
- footnote[5] Back to paragraph Measured as an increase in the all-items Consumer Price Index for Ontario between January and March of 2019 and January and March of 2020.