

SB-1 — Climatic and Seismic Data
Introduction
The great diversity of climate in Ontario has a considerable effect on the performance of buildings; consequently, building design must reflect this diversity. This Supplementary Standard briefly describes how climatic design values are computed and provides recommended design data for a number of cities, towns, and lesser populated locations. Through the use of such data, appropriate allowances can be made for climate variations in different localities of Ontario and the Building Code can be applied provincially.
The climatic design data provided in Table 2 are based on weather observations collected by the Meteorological Service of Canada, Environment and Climate Change Canada. The data were researched and analyzed for the Canadian Commission on Building and Fire Codes by Environment and Climate Change Canada.
As it is not practical to list values for all municipalities in Ontario, recommended climatic design values for locations not listed can be obtained by e-mail from the Engineering Climate Services Unit of Environment and Climate Change Canada at scg-ecs@ec.gc.ca. It should be noted, however, that these recommended values may differ from the values accepted by municipal building authorities based on local experience.
The information on seismic hazard given in Table 3 has been provided by Natural Resources Canada.
General
The choice of climatic elements tabulated in this Supplementary Standard and the form in which they are expressed have been dictated largely by the requirements for specific values in several sections of the Building Code. These elements include ground snow loads, wind pressures, design temperatures, heating degree-days, one-day and 15-minute rainfalls, and annual total precipitation values. The following notes briefly explain the significance of these particular elements in building design, and indicate which weather observations were used and how they were analyzed to yield the required design values.
Climatic design data in Table 2 provides weather information and elevations for over 230 locations which have been chosen based on a variety of reasons. Many incorporated cities and towns with significant populations are included unless located close to larger cities. For sparsely populated areas, many smaller towns and villages are listed. Other locations have been added to the list when the demand for climatic design recommendations at these sites has been significant. The named locations refer to the specific latitude and longitude defined by the Gazetteer of Canada (Natural Resources Canada), available from Publishing and Depository Services Canada, Public Works and Government Services Canada, Ottawa, Ontario KIA OS5.
Almost all of the weather observations used in preparing Table 2 were, of necessity, observed at inhabited locations. To estimate design values for arbitrary locations, the observed or computed values for the weather stations were mapped and interpolated appropriately. Where possible, adjustments have been applied for the influence of elevation and known topographical effects. Such influences include the tendency of cold air to collect in depressions, for precipitation to increase with elevation, and for generally stronger winds near large bodies of water. Elevations have been added to Table 2 because of their potential to significantly influence climatic design values. The elevations are given in metres and refer to heights above sea level.
Since interpolation from the values in Table 2 to other locations may not be valid due to local and other effects, Environment and Climate Change Canada will provide climatic design element recommendations for locations not listed in Table 2. Local effects are particularly significant in mountainous areas, where the values apply only to populated valleys and not to the mountain slopes and high passes, where very different conditions are known to exist.
Changing and Variable Climates
Climate is not static. At any location, weather and climatic conditions vary from season to season, year to year, and over longer time periods (climate cycles). This has always been the case. Evidence is mounting that the climates of Ontario are changing and will continue to change significantly in the future. When estimating climatic design loads, this variability can be considered using appropriate statistical analysis, data records spanning sufficient periods, and meteorological judgement. The analysis generally assumes that the past climate will be representative of the future climate.
Past and ongoing modifications to atmospheric chemistry (from greenhouse gas emissions and land use changes) are expected to alter most climatic regimes in the future despite the success of the most ambitious greenhouse gas mitigation plans.(1) Some regions could see an increase in the frequency and intensity of many weather extremes, which will accelerate weathering processes. Consequently, many buildings will need to be designed, maintained and operated to adequately withstand ever changing climatic loads.
Similar to global trends, the last decade in Canada was noted as the warmest in instrumented record. Canada has warmed, on average, at almost twice the rate of the global average increase, while the western Arctic is warming at a rate that is unprecedented over the past 400 years.(1) Mounting evidence from Arctic communities indicates that rapid changes to climate in the North have resulted in melting permafrost and impacts from other climate changes have affected nearly every type of built structure. Furthermore, analyses of Canadian precipitation data shows that many regions of the country have, on average, also been tending towards wetter conditions.(1) In the United States, where the density of climate monitoring stations is greater, a number of studies have found an unambiguous upward trend in the frequency of heavy to extreme precipitation events, with these increases coincident with a general upward trend in the total amount of precipitation. Climate change model results, based on an ensemble of global climate models worldwide, project that future climate warming rates will be greatest in higher latitude countries such as Canada.(2)
January Design Temperatures
A building and its heating system should be designed to maintain the inside temperature at some pre-determined level. To achieve this, it is necessary to know the most severe weather conditions under which the system will be expected to function satisfactorily. Failure to maintain the inside temperature at the pre-determined level will not usually be serious if the temperature drop is not great and if the duration is not long. The outside conditions used for design should, therefore, not be the most severe in many years, but should be the somewhat less severe conditions that are occasionally but not greatly exceeded.
The January design temperatures are based on an analysis of January air temperatures only. Wind and solar radiation also affect the inside temperature of most buildings and may need to be considered for energy-efficient design.
The January design temperature is defined as the lowest temperature at or below which only a certain small percentage of the hourly outside air temperatures in January occur. In the past, stations with records from all or part of the period 1951-1966 formed the basis for calculation of the 2.5 and 1% January temperatures. Where necessary, the data were adjusted for consistency. Since most of the temperatures were observed at airports, design values for the core areas of large cities could be 1° or 2°C milder, although the values for the fringe areas are probably about the same as for the airports. No adjustments were made for this urban heat island effect. The design values for the next 20 to 30 years will probably differ from these tabulated values due to year-to-year climate variability and global climate change resulting from the impact of human on atmospheric chemistry.
The design temperatures were reviewed and updated using hourly temperature observations from stations for a 25-year period up to 2006 with at least 8 years of complete data. These data are consistent with data shown for Canadian locations in the 2009 Handbook of Fundamentals(3) published by the American Society of Heating, Refrigerating, and Air-Conditioning Engineers (ASHRAE). The most recent 25 years of record were used to provide a balance between accounting for trends in the climate and the sampling variation owing to year-to-year variation. The 1% and 2.5% values used for the design conditions represent percentiles of the cumulative frequency distribution of hourly temperatures and correspond to January temperatures that are colder for 8 and 19 hours, respectively, on average over the long term.
The 2.5% January design temperature is the value ordinarily used in the design of heating systems. In special cases, when the control of inside temperature is more critical, the 1% value may be used. Other temperature-dependent climatic design parameters may be considered for future issues of this document.
July Design Temperatures
A building and its cooling and dehumidifying system should be designed to maintain the inside temperature and humidity at certain pre-determined levels. To achieve this, it is necessary to know the most severe weather conditions under which the system is expected to function satisfactorily. Failure to maintain the inside temperature and humidity at the pre-determined levels will usually not be serious if the increases in temperature and humidity are not great and the duration is not long. The outside conditions used for design should, therefore, not be the most severe in many years, but should be the somewhat less severe conditions that are occasionally but not greatly exceeded.
The summer design temperatures in this Supplementary Standard are based on an analysis of July air temperatures and humidities. Wind and solar radiation also affect the inside temperature of most buildings and may, in some cases, be more important than the outside air temperature. More complete summer and winter design information can be obtained from Environment and Climate Change Canada.
The July design dry-bulb and wet-bulb temperatures were reviewed and updated using hourly temperature observations from stations for a 25-year period up to 2006. These data are consistent with data shown for Canadian locations in the 2009 Handbook of Fundamentals(3) published by ASHRAE. As with January design temperatures, data from the most recent 25-year period were analyzed to reflect any recent climatic changes or variations. The 2.5% values used for the dry- and wet-bulb design conditions represent percentiles of the cumulative frequency distribution of hourly dry- and wet-bulb temperatures and correspond to July temperatures that are higher for 19 hours on average over the long term.
Heating Degree-Days
The rate of consumption of fuel or energy required to keep the interior of a small building at 21°C when the outside air temperature is below 18°C is roughly proportional to the difference between 18°C and the outside temperature. Wind speed, solar radiation, the extent to which the building is exposed to these elements and the internal heat sources also affect the heat required and may have to be considered for energy-efficient design. For average conditions of wind, radiation, exposure, and internal sources, however, the proportionality with the temperature difference generally still holds.
Since the fuel required is also proportional to the duration of the cold weather, a convenient method of combining these elements of temperature and time is to add the differences between 18°C and the mean temperature for every day in the year when the mean temperature is below 18°C. It is assumed that no heat is required when the mean outside air temperature for the day is 18°C or higher.
Although more sophisticated computer simulations using other forms of weather data have now almost completely replaced degree-day-based calculation methods for estimating annual heating energy consumption, degree-days remain a useful indicator of relative severity of climate and can form the basis for certain climate-related code requirements.
The degree-days below 18°C were compiled for stations for the 25-year period ending in 2006. This analysis period is consistent with the one used to derive the design temperatures described above and with the approach used by ASHRAE.(1)
A difference of only one Celsius degree in the mean annual temperature will cause a difference of 250 to 350 in the Celsius degree-days. Since differences of 0.5 of a Celsius degree in the mean annual temperature are quite likely to occur between two stations in the same town, heating degree-days cannot be relied on to an accuracy of less than about 100 degree-days.
Heating degree-day values for the core areas of larger cities can be 200 to 400 degree-days less (warmer) than for the surrounding fringe areas. The observed degree-days, which are based on daily temperature observations, are often most representative of rural settings or the fringe areas of cities.
Climatic Data for Energy Consumption Calculations
The climatic elements tabulated in this Supplementary Standard represent commonly used design values but do not include detailed climatic profiles, such as hourly weather data. Where hourly values of weather data are needed for the purpose of simulating the annual energy consumption of a building, they can be obtained from multiple sources, such as Environment and Climate Change Canada, Natural Resources Canada, the Regional Conservation Authority and other such public agencies that record this information. Hourly weather data are also available from public and private agencies that format this information for use with annual energy consumption simulation software; in some cases, these data have been incorporated into the software.
Snow Loads
The roof of a building should be able to support the greatest weight of snow that is likely to accumulate on it in many years. Some observations of snow on roofs have been made in Canada, but not enough to form the basis for estimating roof snow loads throughout the country. Similarly, observations of the weight, or water equivalent, of the snow on the ground have not been available in digital form in the past. The observations of roof loads and water equivalents are very useful, as noted below, but the measured depth of snow on the ground is used to provide the basic information for a consistent set of snow loads.
The estimation of the design snow load on a roof from snow depth observations involves the following steps:
- The depth of snow on the ground, which has an annual probability of exceedance of 1-in-50, is computed.
- The appropriate specific weight is selected and used to convert snow depth to loads, Ss.
- The load, Sr, which is due to rain falling on the snow, is computed.
- Because the accumulation of snow on roofs is often different from that on the ground, adjustments are applied to the ground snow load to provide a design snow load on a roof.
The annual maximum depth of snow on the ground has been assembled from stations for which data has been recorded by the Meteorological Service of Canada (MSC). The period of record used varied from station to station, ranging from 7 to 38 years. These data were analyzed using a Gumbel extreme value distribution fitted using the method of moments(4) as reported by Newark et al.(5) The resulting values are the snow depths, which have a probability of 1-in-50 of being exceeded in any one year.
The specific weight of old snow generally ranges from 2 to 5 kN/m³, and it is usually assumed in Canada that 1 kN/m³ is the average for new snow. Average specific weights of the seasonal snow pack have been derived for different regions across the country(6) and an appropriate value has been assigned to each weather station. Typically, the values average 2.01 kN/m³ east of the continental divide (except for 2.94 kN/m³ north of the treeline), and range from 2.55 to 4.21 kN/m³ west of the divide. The product of the 1-in-50 snow depth and the average specific weight of the seasonal snow pack at a station is converted to the snow load (SL) in units of kilopascals (kPa).
Except for the mountainous areas of western Canada, the values of the ground snow load at MSC stations were normalized assuming a linear variation of the load above sea level in order to account for the effects of topography. They were then smoothed using an uncertainty-weighted moving-area average in order to minimize the uncertainty due to snow depth sampling errors and site-specific variations. Interpolation from analyzed maps of the normalized values yielded a value for each location in Table 2, which could then be converted to the listed code values (Ss) by means of an equation in the form:
Ss = smooth normalized SL + bZ
where b is the assumed rate of change of SL with elevation at the location and Z is the location's elevation above mean sea level (MSL). Although they are listed in Table 2 to the nearest tenth of a kilopascal, values of Ss typically have an uncertainty of about 20%. Areas of sparse data in northern Canada were an exception to this procedure. In these regions, an analysis was made of the basic SL values. The effects of topography, variations due to local climates, and smoothing were all subjectively assessed. The values derived in this fashion were used to modify those derived objectively.
Tabulated values cannot be expected to indicate all the local differences in Ss. For this reason, especially in complex terrain areas, values should not be interpolated from Table 2 for unlisted locations. The values of Ss in Table 2 apply for the elevation and the latitude and longitude of the location, as defined by the Gazetteer of Canada. Values at other locations can be obtained from Environment and Climate Change Canada.
The heaviest loads frequently occur when the snow is wetted by rain, thus the rain load, Sr, was estimated to the nearest 0.1 kPa and is provided in Table 2. When values of Sr, are added to Ss, this provides a 1-in-50-year estimate of the combined ground snow and rain load. The values of Sr are based on an analysis from weather station values of the 1-in-50-year one-day maximum rain amount. This return period is appropriate because the rain amounts correspond approximately to the joint frequency of occurrence of the one-day rain on maximum snow packs. For the purpose of estimating rain on snow, the individual observed one-day rain amounts were constrained to be less than or equal to the snow pack water equivalent, which was estimated by a snow pack accumulation model reported by Bruce and Clark.(7)
The results from surveys of snow loads on roofs indicate that average roof loads are generally less than loads on the ground. The conditions under which the design snow load on the roof may be taken as a percentage of the ground snow load are given in Subsection 4.1.6. of Division B of the Building Code. The Code also permits further decreases in design snow loads for steeply sloping roofs, but requires substantial increases for roofs where snow accumulation may be more rapid due to such factors as drifting. Recommended adjustments are given in the "Structural Commentaries (User's Guide – NBC 2020: Part 4 of Division B)".
The ground snow values, Ss, were updated for this edition of the Building Code using a similar approach to the one used for the ground snow load update in the 1990 edition. The Gumbel extreme value distribution was fitted to the annual maxima of daily snow depth observations made at weather stations, which were compiled from 1990 onward – to as recently as 2012 for some stations – to calculate the 50-year return period snow depth. The 50-year ground snow load was then calculated for each weather station by combining the 50-year snow pack with the assigned snow pack density. The Ss values for each location in Table 2 were compared with the updated weather station values and revised accordingly. As a result, Ss values remain unchanged for about 89% of the locations, have increased for 5.7% of the locations, and have decreased for 5.3% of the locations.
Annual Total Precipitation
Total precipitation is the sum in millimetres of the measured depth of rainwater and the estimated or measured water equivalent of the snow (typically estimated as 0.1 of the measured depth of snow, since the average density of fresh snow is about 0.1 that of water).
The average annual total precipitation amounts in Table 2 have been interpolated from an analysis of precipitation observations from stations for the 30-year period from 1961 to 1990.
Annual Rainfall
The total amount of rain that normally falls in one year is frequently used as a general indication of the wetness of a climate, and is therefore included in this Supplementary Standard.
Rainfall Intensity
Roof drainage systems are designed to carry off rainwater from the most intense rainfall that is likely to occur. A certain amount of time is required for the rainwater to flow across and down the roof before it enters the gutter or drainage system. This results in the smoothing out of the most rapid changes in rainfall intensity. The drainage system, therefore, need only cope with the flow of rainwater produced by the average rainfall intensity over a period of a few minutes, which can be called the concentration time.
In Canada, it has been customary to use the 15-minute rainfall that will probably be exceeded on an average of once in 10 years. The concentration time for small roofs is much less than 15 minutes and hence the design intensity will be exceeded more frequently than once in 10 years. The safety factors in Part 7 of Division B of the Building Code will probably reduce the frequency to a reasonable value and, in addition, the occasional failure of a roof drainage system will not be particularly serious in most cases.
The rainfall intensity values were updated for the 2012 edition of the Building Code using observations of annual maximum 15-minute rainfall amounts from stations with 10 or more years of record, including data up to 2007 for some stations. Ten-year return period values − the 15-minute rainfall having a probability of 1-in-10 of being exceeded in any year − were calculated by fitting the annual maximum values to the Gumbel extreme value distribution(4) using the method of moments. The updated values are compiled from the most recent short-duration rainfall intensity-duration-frequency (IDF) graphs and tables available from Environment and Climate Change Canada.
It is very difficult to estimate the pattern of rainfall intensity in mountainous areas, where precipitation is extremely variable and rainfall intensity can be much greater than in other types of areas. Many of the observations for these areas were taken at locations in valley bottoms or in extensive, fairly level areas.
One-Day Rainfall
If for any reason a roof drainage system becomes ineffective, the accumulation of rainwater may be great enough in some cases to cause a significant increase in the load on the roof. In the past, when the period during which rainwater could accumulate was unknown, it had been common practice to use the maximum one-day rainfall ever observed for estimating the additional load. Since the length of record for weather stations in Canada is quite variable, the maximum one-day rainfall amounts in previous editions often reflected the variable length of record at nearby stations as much as the climatology. As a result, the maximum values often differed greatly within relatively small areas where little difference should be expected. The current values have been standardized to represent the one-day rainfall amounts that have 1 chance in 50 of being exceeded in any one year or the 1-in-50-year return value one-day rainfalls.
The one-day rainfall values were updated using daily rainfall observations from stations with 10 years or more of record, including data up to 2008 for some stations. The 50-year return period values were calculated by fitting the annual maximum one-day rainfall observations to the Gumbel extreme value distribution using the method of moments.(4)
Rainfall frequency observations can vary considerably over time and space. This is especially true for mountainous areas, where elevation effects can be significant. In other areas, small scale intense storms or local influences can produce significant spatial variability in the data. As a result, the analysis incorporates some spatial smoothing.
Moisture Index (MI)
Moisture index (MI) values were developed through the work of a consortium that included representatives from industry and researchers from NRC.(1) The MI is an indicator of the moisture load imposed on a building by the climate and is used in Part 9 to define the minimum levels of protection from precipitation to be provided by cladding assemblies on exterior walls.
It must be noted, in using MI values to determine the appropriate levels of protection from precipitation, that weather conditions can vary markedly within a relatively small geographical area. Although the values provided in the Table give a good indication of the average conditions within a particular region, some caution must be exercised when applying them to a locality that is outside the region where the weather station is located.
MI is calculated from a wetting index (WI) and a drying index (DI).
Wetting Index (WI)
To define, quantitatively, the rainwater load on a wall, wind speed and wind direction have to be taken into consideration in addition to rainfall, along with factors that can affect exposure, such as nearby buildings, vegetation and topography. Quantitative determination of load, including wind speed and wind direction, can be done. However, due to limited weather data, it is not currently possible to provide this information for most of the locations identified in the Table.
This lack of information, however, has been shown to be non-critical for the purpose of classifying locations in terms of severity of rain load. The results of the research indicated that simple annual rainfall is as good an indicator as any for describing rainwater load. That is to say, for Canadian locations, and especially once drying is accounted for, the additional sensitivity provided by hourly directional rainfall values does not have a significant effect on the order in which locations appear when listed from wet to dry.
Consequently, the wetting index (WI) is based on annual rainfall and is normalized based on 1000 mm.
Drying Index (DI)
Temperature and relative humidity together define the drying capacity of ambient air. Based on simple psychrometrics, values were derived for the locations listed in the Table using annual average drying capacity normalized based on the drying capacity at Lytton, B.C. The resultant values are referred to as drying indices (DI).
Determination of Moisture Index (MI)
The relationship between WI and DI to correctly define moisture loading on a wall is not known. The MI values provided in the Table are based on the root mean square values of WI and 1-DI, with those values equally weighted. This is illustrated in Figure 1. The resultant MI values are sufficiently consistent with industry's understanding of climate severity with respect to moisture loading as to allow limits to be identified for the purpose of specifying where additional protection from precipitation is required.
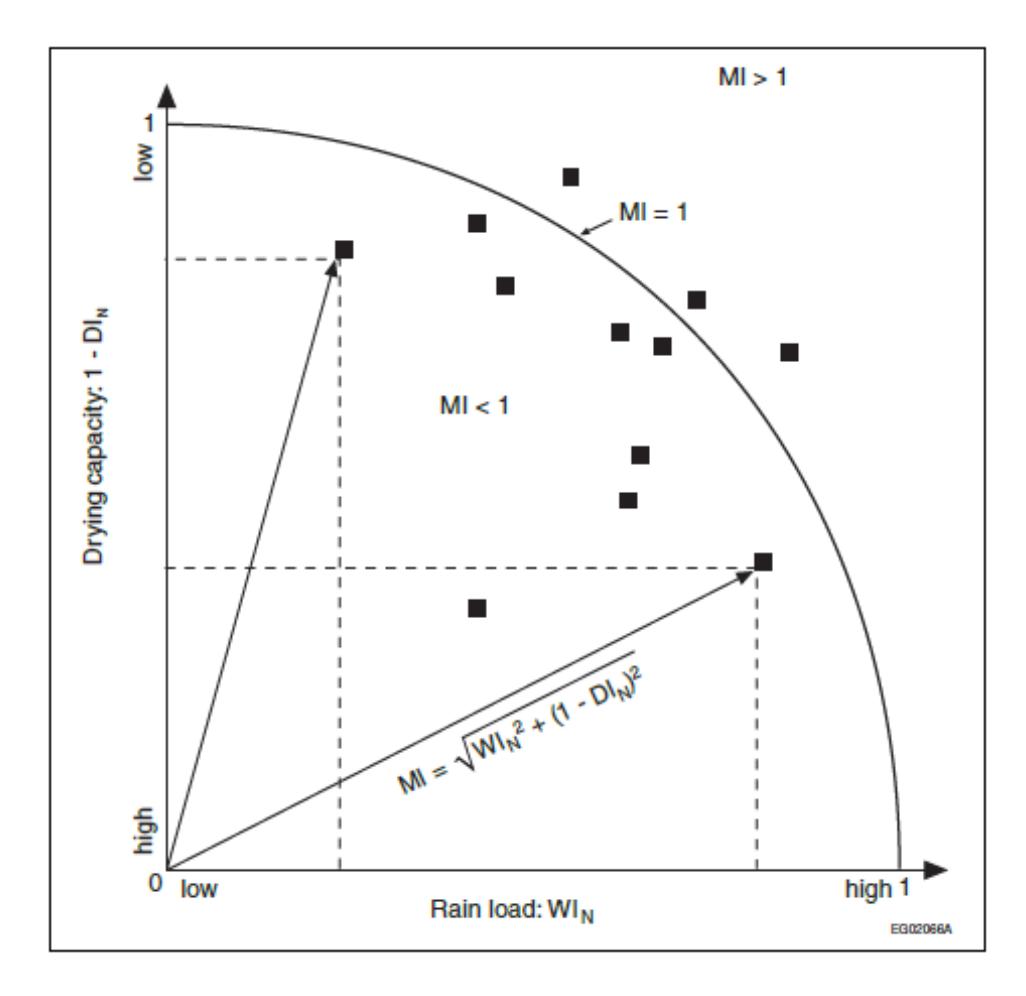
Notes to Figure 1:
- MI equals the hypotenuse of the triangle defined by WIN and 1-DIN.
Driving Rain Wind Pressure (DRWP)
The presence of rainwater on the face of a building, with or without wind, must be addressed in the design and construction of the building envelope so as to minimize the entry of water into the assembly. Wind pressure on the windward faces of a building will promote the flow of water through any open joints or cracks in the facade.
Driving rain wind pressure (DRWP) is the wind load that is coincident with rain, measured or calculated at a height of 10 m. The values provided in Table 2 represent the loads for which there is 1 chance in 5 of being reached or exceeded in any one year, or a probability of 20% within any one year. Approximate adjustments for height can be made using the values for Ce given in Sentence 4.1.7.3.(5) of Division B as a multiplier.
Because of inaccuracies in developing the DRWP values related to the averaging of extreme wind pressures, the actual heights of recording anemometers, and the use of estimated rather than measured rainfall values, the values are considered to be higher than actual loads.(8)(9) Thus the actual probability of reaching or exceeding the DRWP in a particular location is less than 20% per year and these values can be considered to be conservative.
DRWP can be used to determine the height to which wind will drive rainwater up enclosed vertical conduits. This provides a conservative estimate of the height needed for fins in window extrusions and end dams on flashings to control water ingress. This height can be calculated as:
height of water, mm = DRWP / 10, Pa
Note that the pressure difference across the building envelope may be augmented by internal pressures induced in the building interior by the wind. These additional pressures can be estimated using the information provided in the Commentary entitled Wind Load and Effects of the "Structural Commentaries (User's Guide – NBC 2020: Part 4 of Division B)".
Wind Effects
All structures need to be designed to ensure that the main structural system and all secondary components, such as cladding and appurtenances, will withstand the pressures and suctions caused by the strongest wind likely to blow at that location in many years. Some flexible structures, such as tall buildings, slender towers and bridges, also need to be designed to minimize excessive wind-induced oscillations or vibrations.
At any time, the wind acting upon a structure can be treated as a mean or time-averaged component and as a gust or unsteady component. For a small structure, which is completely enveloped by wind gusts, it is only the peak gust velocity that needs to be considered. For a large structure, the wind gusts are not well correlated over its different parts and the effects of individual gusts become less significant. The "Structural Commentaries (User's Guide – NBC 2020: Part 4 of Division B)" evaluates the mean pressure acting on a structure, provide appropriate adjustments for building height and exposure and for the influence of the surrounding terrain and topography (including wind speed-up for hills), and then incorporate the effects of wind gusts by means of the gust factor, which varies according to the type of structure and the size of the area over which the pressure acts.
The wind speeds and corresponding velocity pressures used in the Code are regionally representative or reference values. The reference wind speeds are nominally one-hour averages of wind speeds representative of the 10 m height in flat open terrain corresponding to Exposure A or open terrain in the terminology of the "Structural Commentaries (User's Guide – NBC 2020: Part 4 of Division B)". The reference wind speeds and wind velocity pressures are based on long-term wind records observed at a large number of weather stations across Canada.
Reference wind velocity pressures in the 1975 to 2006 editions of the Building Code were based mostly on records of hourly averaged wind speeds (i.e, the number of miles of wind passing an anemometer in an hour) from several stations across Ontario with 10 to 22 years of observations ending in the 1950 s. The wind pressure values derived from these measurements represented true hourly wind pressures.
The reference wind velocity pressures were reviewed and updated for the 2012 edition of the Building Code. The primary data set used for the analysis comprised wind records compiled from stations with hourly averaged wind speeds and from stations with aviation (one- or two-minute average) speeds or surface weather (ten-minute average) speeds observed once per hour at the top of the hour; the periods of record used ranged from 10 to 54 years. In addition, peak wind gust records from stations with periods of record ranging from 10 to 43 years were used. Peak wind gusts (gust durations of approximately 3 to 7 seconds) were used to supplement the primary once-per-hour observations in the analysis.
Several steps were involved in updating the reference wind values. Where needed, speeds were adjusted to represent the standard anemometer height above ground of 10 m. The data from years when the anemometer at a station was installed on the top of a lighthouse or building were eliminated from the analysis since it is impractical to adjust for the effects of wind flow over the structure. (Most anemometers were moved to 10 m towers by the 1960 s.) Wind speeds of the various observation types-hourly averaged, aviation, surface weather and peak wind gust — were adjusted to account for different measure durations to represent a one-hour averaging period and to account for differences in the surface roughness of flat open terrain at observing stations.
The annual maximum wind speed data was fitted to the Gumbel distribution using the method of moments(4) to calculate hourly wind speeds having the annual probability of occurrence of 1-in-10 and 1-in-50 (10-year and 50-year return periods). The values were plotted on maps, then analyzed and abstracted for the locations in Table 2.
The wind velocity pressures, q, were calculated in Pascals using the following equation:
q = ½ ρV²
where ρ is an average air density for the windy months of the year and V is wind speed in metres per second. While air density depends on both air temperature and atmospheric pressure, the density of dry air at 0°C and standard atmospheric pressure of 1.2929 kg/m³ was used as an average value for the wind pressure calculations. As explained by Boyd(10), this value is within 10% of the monthly average air densities for most of Canada in the windy part of the year.
As a result of the updating procedure for the 2012 edition of the Building Code, the 1-in-50 reference wind velocity pressures remain unchanged for most of the locations listed in Table 2; both increases and decreases were noted for the remaining locations. Many of the decreases resulted from the fact that anemometers at most of the stations used in the previous analysis were installed on lighthouses, airport hangers and other structures. Wind speeds on the tops of buildings are often much higher compared to those registered by a standard 10 m tower. Eliminating anemometer data recorded on the tops of buildings from the analysis resulted in lower values at several locations.
For the 2024 edition of the Building Code, the reference wind velocity pressures were updated to reflect the new data collected in the approximately 10 years since the previous update for the 2012 edition. Only data collected at stations with a period of record of at least 20 years were used in the analysis. As a result, the data set comprised wind records from many hourly and daily peak wind gust stations across Ontario with periods of record ranging from 20 to 65 years. The annual maximum wind speed data were fitted to the Gumbel distribution.
The 1-in-50 hourly wind speeds, after adjusting for roughness to represent open exposure, were mapped and compared to the 2012 Building Code values for the locations in Table 2. This updating procedure resulted in small changes to the 1-in-50 reference wind velocity pressures for some locations.
The 1-in-10 reference wind velocity pressures were updated using the same procedure, except that regional values of the coefficient of variation were used in the calculations instead of the national value used previously. This procedure resulted in small changes to the 1-in-10 reference wind velocity pressures for many locations across Ontario, including many for which there was no change to the 1-in-50 reference wind velocity pressure.
Wind speeds that have a 1-in-"n" chance of being exceeded in any year can be calculated from the wind speeds corresponding to the 1-in-10 and 1-in-50 return period values in Table 2 using the following equation:
V1/n = (1 / 1.4565) { V1/50 + 0.4565 V1/10 + [(V1/50 − V1/10) / 1.1339] × ln[−0.0339 / ln(1 − 1/n)] }
Table 1 has been arranged to give pressures to the nearest one-hundredth of a kPa and their corresponding wind speeds. The value of "q" in kPa is assumed to be equal to 0.00064645 V², where V is given in m/s.
Table 1: Wind Speeds
| q kPa | V m/s | q kPa | V m/s | q kPa | V m/s | q kPa | V m/s |
|---|---|---|---|---|---|---|---|
| 0.15 | 15.2 | 0.53 | 28.6 | 0.91 | 37.5 | 1.29 | 44.7 |
| 0.16 | 15.7 | 0.54 | 28.9 | 0.92 | 37.7 | 1.30 | 44.8 |
| 0.17 | 16.2 | 0.55 | 29.2 | 0.93 | 37.9 | 1.31 | 45.0 |
| 0.18 | 16.7 | 0.56 | 29.4 | 0.94 | 38.1 | 1.32 | 45.2 |
| 0.19 | 17.1 | 0.57 | 29.7 | 0.95 | 38.3 | 1.33 | 45.4 |
| 0.20 | 17.6 | 0.58 | 30.0 | 0.96 | 38.5 | 1.34 | 45.5 |
| 0.21 | 18.0 | 0.59 | 30.2 | 0.97 | 38.7 | 1.35 | 45.7 |
| 0.22 | 18.4 | 0.60 | 30.5 | 0.98 | 38.9 | 1.36 | 45.9 |
| 0.23 | 18.9 | 0.61 | 30.7 | 0.99 | 39.1 | 1.37 | 46.0 |
| 0.24 | 19.3 | 0.62 | 31.0 | 1.00 | 39.3 | 1.38 | 46.2 |
| 0.25 | 19.7 | 0.63 | 31.2 | 1.01 | 39.5 | 1.39 | 46.4 |
| 0.26 | 20.1 | 0.64 | 31.5 | 1.02 | 39.7 | 1.40 | 46.5 |
| 0.27 | 20.4 | 0.65 | 31.7 | 1.03 | 39.9 | 1.41 | 46.7 |
| 0.28 | 20.8 | 0.66 | 32.0 | 1.04 | 40.1 | 1.42 | 46.9 |
| 0.29 | 21.2 | 0.67 | 32.2 | 1.05 | 40.3 | 1.43 | 47.0 |
| 0.30 | 21.5 | 0.68 | 32.4 | 1.06 | 40.5 | 1.44 | 47.2 |
| 0.31 | 21.9 | 0.69 | 32.7 | 1.07 | 40.7 | 1.45 | 47.4 |
| 0.32 | 22.2 | 0.70 | 32.9 | 1.08 | 40.9 | 1.46 | 47.5 |
| 0.33 | 22.6 | 0.71 | 33.1 | 1.09 | 41.1 | 1.47 | 47.7 |
| 0.34 | 22.9 | 0.72 | 33.4 | 1.10 | 41.3 | 1.48 | 47.8 |
| 0.35 | 23.3 | 0.73 | 33.6 | 1.11 | 41.4 | 1.49 | 48.0 |
| 0.36 | 23.6 | 0.74 | 33.8 | 1.12 | 41.6 | 1.50 | 48.2 |
| 0.37 | 23.9 | 0.75 | 34.1 | 1.13 | 41.8 | 1.51 | 48.3 |
| 0.38 | 24.2 | 0.76 | 34.3 | 1.14 | 42.0 | 1.52 | 48.5 |
| 0.39 | 24.6 | 0.77 | 34.5 | 1.15 | 42.2 | 1.53 | 48.6 |
| 0.40 | 24.9 | 0.78 | 34.7 | 1.16 | 42.4 | 1.54 | 48.8 |
| 0.41 | 25.2 | 0.79 | 35.0 | 1.17 | 42.5 | 1.55 | 49.0 |
| 0.42 | 25.5 | 0.80 | 35.2 | 1.18 | 42.7 | 1.56 | 49.1 |
| 0.43 | 25.8 | 0.81 | 35.4 | 1.19 | 42.9 | 1.57 | 49.3 |
| 0.44 | 26.1 | 0.82 | 35.6 | 1.20 | 43.1 | 1.58 | 49.4 |
| 0.45 | 26.4 | 0.83 | 35.8 | 1.21 | 43.3 | 1.59 | 49.6 |
| 0.46 | 26.7 | 0.84 | 36.0 | 1.22 | 43.4 | 1.60 | 49.7 |
| 0.47 | 27.0 | 0.85 | 36.3 | 1.23 | 43.6 | 1.61 | 49.9 |
| 0.48 | 27.2 | 0.86 | 36.5 | 1.24 | 43.8 | 1.62 | 50.1 |
| 0.49 | 27.5 | 0.87 | 36.7 | 1.25 | 44.0 | 1.63 | 50.2 |
| 0.50 | 27.8 | 0.88 | 36.9 | 1.26 | 44.1 | 1.64 | 50.4 |
| 0.51 | 28.1 | 0.89 | 37.1 | 1.27 | 44.3 | 1.65 | 50.5 |
| 0.52 | 28.4 | 0.90 | 37.3 | 1.28 | 44.5 | 1.66 | 50.7 |
| Column 1 | 2 | 3 | 4 | 5 | 6 | 7 | 8 |
Table 2: Climatic Design Data
| Location | Elevation, m | Design Temperature — January — 2.5%, °C | Design Temperature — January — 1%, °C | Design Temperature — July 2.5% — Dry, °C | Design Temperature — July 2.5% — Wet, °C | Degree Days Below 18°C | 15 Min Rain, mm | One Day Rain, 1/50, mm | Annual Rain, mm | Moisture Index | Annual Total Precipitation, mm | Driving Rain Wind Pressures, Pa, 1/5 | Snow Load, kPa, 1/50 — Ss | Snow Load, kPa, 1/50 — Sr | Hourly Wind Pressures, kPa — 1/10 | Hourly Wind Pressures, kPa — 1/50 |
|---|---|---|---|---|---|---|---|---|---|---|---|---|---|---|---|---|
| Ailsa Craig | 230 | -17 | -19 | 30 | 23 | 3840 | 25 | 103 | 800 | 0.9 | 950 | 180 | 2.2 | 0.4 | 0.37 | 0.48 |
| Ajax | 95 | -20 | -22 | 30 | 23 | 3820 | 23 | 92 | 760 | 0.9 | 825 | 160 | 1.0 | 0.4 | 0.37 | 0.48 |
| Alexandria | 80 | -24 | -26 | 30 | 23 | 4600 | 25 | 103 | 800 | 0.9 | 975 | 160 | 2.4 | 0.4 | 0.31 | 0.4 |
| Alliston | 220 | -23 | -25 | 29 | 23 | 4200 | 28 | 113 | 690 | 0.8 | 875 | 120 | 2.0 | 0.4 | 0.28 | 0.36 |
| Almonte | 120 | -26 | -28 | 30 | 23 | 4620 | 25 | 97 | 730 | 0.8 | 800 | 140 | 2.5 | 0.4 | 0.32 | 0.41 |
| Armstrong | 340 | -37 | -40 | 28 | 21 | 6500 | 23 | 97 | 525 | 0.8 | 725 | 100 | 2.7 | 0.4 | 0.22 | 0.3 |
| Arnprior | 85 | -27 | -29 | 30 | 23 | 4680 | 23 | 86 | 630 | 0.8 | 775 | 140 | 2.5 | 0.4 | 0.29 | 0.37 |
| Atikokan | 400 | -33 | -35 | 29 | 22 | 5750 | 25 | 103 | 570 | 0.8 | 760 | 100 | 2.4 | 0.3 | 0.22 | 0.3 |
| Attawapiskat | 10 | -37 | -39 | 28 | 21 | 7100 | 18 | 81 | 450 | 0.8 | 650 | 160 | 2.8 | 0.3 | 0.3 | 0.41 |
| Aurora | 270 | -21 | -23 | 30 | 23 | 4210 | 28 | 108 | 700 | 0.8 | 800 | 140 | 2.0 | 0.4 | 0.34 | 0.44 |
| Bancroft | 365 | -28 | -31 | 29 | 23 | 4740 | 25 | 92 | 720 | 0.9 | 900 | 100 | 3.1 | 0.4 | 0.25 | 0.32 |
| Barrie | 245 | -24 | -26 | 29 | 23 | 4380 | 28 | 97 | 700 | 0.8 | 900 | 120 | 2.5 | 0.4 | 0.28 | 0.36 |
| Barriefield | 100 | -22 | -24 | 28 | 23 | 3990 | 23 | 108 | 780 | 1.0 | 950 | 160 | 2.1 | 0.4 | 0.37 | 0.47 |
| Beaverton | 240 | -24 | -26 | 30 | 23 | 4300 | 25 | 108 | 720 | 0.9 | 950 | 120 | 2.2 | 0.4 | 0.28 | 0.36 |
| Belleville | 90 | -22 | -24 | 29 | 23 | 3910 | 23 | 97 | 760 | 0.9 | 850 | 180 | 1.7 | 0.4 | 0.34 | 0.43 |
| Belmont | 260 | -17 | -19 | 30 | 24 | 3840 | 25 | 97 | 850 | 1.0 | 950 | 180 | 1.7 | 0.4 | 0.37 | 0.47 |
| Big Trout Lake (Kitchenuhmaykoosib) | 215 | -38 | -40 | 26 | 20 | 7450 | 18 | 92 | 400 | 0.75 | 600 | 150 | 3.2 | 0.2 | 0.31 | 0.42 |
| Borden (CBF) | 225 | -23 | -25 | 29 | 23 | 4300 | 28 | 103 | 690 | 0.82 | 875 | 120 | 2.2 | 0.4 | 0.28 | 0.36 |
| Bracebridge | 310 | -26 | -28 | 29 | 23 | 4800 | 25 | 103 | 830 | 1.0 | 1050 | 120 | 3.1 | 0.4 | 0.27 | 0.35 |
| Bradford | 240 | -23 | -25 | 30 | 23 | 4280 | 28 | 108 | 680 | 0.8 | 800 | 120 | 2.1 | 0.4 | 0.28 | 0.36 |
| Brampton | 215 | -19 | -21 | 30 | 23 | 4100 | 28 | 119 | 720 | 0.8 | 820 | 140 | 1.3 | 0.4 | 0.34 | 0.44 |
| Brantford | 205 | -18 | -20 | 30 | 23 | 3900 | 23 | 103 | 780 | 0.9 | 850 | 160 | 1.3 | 0.4 | 0.33 | 0.42 |
| Brighton | 95 | -21 | -23 | 29 | 23 | 4000 | 23 | 94 | 760 | 0.9 | 850 | 160 | 1.6 | 0.4 | 0.37 | 0.48 |
| Brockville | 85 | -23 | -25 | 29 | 23 | 4060 | 25 | 103 | 770 | 0.9 | 975 | 180 | 2.2 | 0.4 | 0.34 | 0.44 |
| Burk's Falls | 305 | -26 | -28 | 29 | 22 | 5020 | 25 | 97 | 810 | 0.9 | 1010 | 120 | 2.7 | 0.4 | 0.27 | 0.35 |
| Burlington | 80 | -17 | -19 | 31 | 23 | 3740 | 23 | 103 | 770 | 0.9 | 850 | 160 | 1.1 | 0.4 | 0.36 | 0.46 |
| Caledon | 425 | -21 | -23 | 30 | 23 | 4450 | 28 | 119 | 730 | 0.84 | 875 | 140 | 2.2 | 0.4 | 0.31 | 0.4 |
| Cambridge | 295 | -18 | -20 | 29 | 23 | 4100 | 25 | 113 | 800 | 0.9 | 890 | 160 | 1.6 | 0.4 | 0.28 | 0.36 |
| Campbellford | 150 | -23 | -26 | 30 | 23 | 4280 | 25 | 97 | 730 | 0.9 | 850 | 160 | 1.7 | 0.4 | 0.32 | 0.41 |
| Cannington | 255 | -24 | -26 | 30 | 23 | 4310 | 25 | 108 | 740 | 0.9 | 950 | 120 | 2.2 | 0.4 | 0.28 | 0.36 |
| Carleton Place | 135 | -25 | -27 | 30 | 23 | 4600 | 25 | 97 | 730 | 0.8 | 850 | 160 | 2.5 | 0.4 | 0.32 | 0.41 |
| Cavan | 200 | -23 | -25 | 30 | 23 | 4400 | 25 | 97 | 740 | 0.9 | 850 | 140 | 2.0 | 0.4 | 0.34 | 0.44 |
| Centralia | 260 | -17 | -19 | 30 | 23 | 3800 | 25 | 103 | 820 | 1.0 | 1000 | 180 | 2.3 | 0.4 | 0.37 | 0.48 |
| Chapleau | 425 | -35 | -38 | 27 | 21 | 5900 | 20 | 97 | 530 | 0.7 | 850 | 80 | 3.6 | 0.4 | 0.23 | 0.3 |
| Chatham | 180 | -16 | -18 | 31 | 24 | 3470 | 28 | 103 | 800 | 0.9 | 850 | 180 | 1.0 | 0.4 | 0.34 | 0.43 |
| Chesley | 275 | -19 | -21 | 29 | 22 | 4320 | 28 | 103 | 810 | 0.9 | 1125 | 140 | 2.8 | 0.4 | 0.35 | 0.45 |
| Clinton | 280 | -17 | -19 | 29 | 23 | 4150 | 25 | 103 | 810 | 0.9 | 1000 | 160 | 2.6 | 0.4 | 0.36 | 0.46 |
| Coboconk | 270 | -25 | -27 | 30 | 23 | 4500 | 25 | 108 | 740 | 0.9 | 950 | 120 | 2.5 | 0.4 | 0.27 | 0.35 |
| Cobourg | 90 | -21 | -23 | 29 | 23 | 3980 | 23 | 94 | 760 | 0.9 | 825 | 160 | 1.2 | 0.4 | 0.38 | 0.49 |
| Cochrane | 245 | -34 | -36 | 29 | 21 | 6200 | 20 | 92 | 575 | 0.8 | 875 | 80 | 2.8 | 0.3 | 0.27 | 0.35 |
| Colborne | 105 | -21 | -23 | 29 | 23 | 3980 | 23 | 94 | 760 | 0.9 | 850 | 160 | 1.6 | 0.4 | 0.38 | 0.49 |
| Collingwood | 190 | -21 | -23 | 29 | 23 | 4180 | 28 | 97 | 720 | 0.9 | 950 | 160 | 2.7 | 0.4 | 0.3 | 0.39 |
| Cornwall | 35 | -23 | -25 | 30 | 23 | 4250 | 25 | 103 | 780 | 0.9 | 960 | 180 | 2.2 | 0.4 | 0.32 | 0.41 |
| Corunna | 185 | -16 | -18 | 31 | 24 | 3600 | 25 | 100 | 760 | 0.9 | 800 | 180 | 1.0 | 0.4 | 0.37 | 0.47 |
| Deep River | 145 | -29 | -32 | 30 | 22 | 4900 | 23 | 92 | 650 | 0.8 | 850 | 100 | 2.5 | 0.4 | 0.27 | 0.35 |
| Deseronto | 85 | -22 | -24 | 29 | 23 | 4070 | 23 | 92 | 760 | 0.9 | 900 | 160 | 1.9 | 0.4 | 0.34 | 0.43 |
| Dorchester | 260 | -18 | -20 | 30 | 24 | 3900 | 28 | 103 | 850 | 1.0 | 950 | 180 | 1.9 | 0.4 | 0.37 | 0.47 |
| Dorion | 200 | -33 | -35 | 28 | 21 | 5950 | 20 | 103 | 550 | 0.8 | 725 | 160 | 2.8 | 0.4 | 0.29 | 0.39 |
| Dresden | 185 | -16 | -18 | 31 | 24 | 3750 | 28 | 97 | 760 | 0.8 | 820 | 180 | 1.0 | 0.4 | 0.34 | 0.43 |
| Dryden | 370 | -34 | -36 | 28 | 22 | 5850 | 25 | 97 | 550 | 0.7 | 700 | 120 | 2.4 | 0.3 | 0.22 | 0.3 |
| Dundalk | 525 | -22 | -24 | 29 | 22 | 4700 | 28 | 108 | 750 | 0.9 | 1080 | 150 | 3.2 | 0.4 | 0.33 | 0.42 |
| Dunnville | 175 | -15 | -17 | 30 | 24 | 3660 | 23 | 108 | 830 | 1.0 | 950 | 160 | 2.0 | 0.4 | 0.36 | 0.46 |
| Durham | 340 | -20 | -22 | 29 | 22 | 4340 | 28 | 103 | 815 | 0.9 | 1025 | 140 | 2.8 | 0.4 | 0.34 | 0.44 |
| Dutton | 225 | -16 | -18 | 31 | 24 | 3700 | 28 | 92 | 850 | 1.0 | 925 | 180 | 1.3 | 0.4 | 0.37 | 0.47 |
| Earlton | 245 | -33 | -36 | 29 | 22 | 5730 | 23 | 92 | 560 | 0.8 | 820 | 120 | 3.1 | 0.4 | 0.35 | 0.45 |
| Edison | 365 | -34 | -36 | 28 | 22 | 5740 | 25 | 108 | 510 | 0.7 | 680 | 120 | 2.4 | 0.3 | 0.23 | 0.31 |
| Elliot Lake | 380 | -26 | -28 | 29 | 21 | 4950 | 23 | 108 | 630 | 0.8 | 950 | 160 | 2.9 | 0.4 | 0.3 | 0.38 |
| Elmvale | 220 | -24 | -26 | 29 | 23 | 4200 | 28 | 97 | 720 | 0.9 | 950 | 140 | 2.6 | 0.4 | 0.28 | 0.36 |
| Embro | 310 | -19 | -21 | 30 | 23 | 3950 | 28 | 113 | 830 | 0.9 | 950 | 160 | 2.0 | 0.4 | 0.37 | 0.48 |
| Englehart | 205 | -33 | -36 | 29 | 22 | 5800 | 23 | 92 | 600 | 0.8 | 880 | 100 | 2.8 | 0.4 | 0.32 | 0.41 |
| Espanola | 220 | -25 | -27 | 29 | 21 | 4920 | 23 | 108 | 650 | 0.8 | 840 | 160 | 2.3 | 0.4 | 0.33 | 0.42 |
| Exeter | 265 | -17 | -19 | 30 | 23 | 3900 | 25 | 113 | 810 | 0.9 | 975 | 180 | 2.4 | 0.4 | 0.37 | 0.48 |
| Fenelon Falls | 260 | -25 | -27 | 30 | 23 | 4440 | 25 | 108 | 730 | 0.9 | 950 | 120 | 2.3 | 0.4 | 0.28 | 0.36 |
| Fergus | 400 | -20 | -22 | 29 | 23 | 4300 | 28 | 108 | 760 | 0.9 | 925 | 160 | 2.2 | 0.4 | 0.28 | 0.36 |
| Forest | 215 | -16 | -18 | 31 | 23 | 3740 | 25 | 103 | 810 | 1.0 | 875 | 160 | 2.0 | 0.4 | 0.37 | 0.48 |
| Fort Erie | 180 | -15 | -17 | 30 | 24 | 3650 | 23 | 108 | 860 | 1.0 | 1020 | 160 | 2.3 | 0.4 | 0.36 | 0.46 |
| Fort Erie (Ridgeway) | 190 | -15 | -17 | 30 | 24 | 3600 | 25 | 108 | 860 | 1.0 | 1000 | 160 | 2.3 | 0.4 | 0.36 | 0.46 |
| Fort Frances | 340 | -33 | -35 | 29 | 22 | 5440 | 25 | 108 | 570 | 0.7 | 725 | 120 | 2.3 | 0.3 | 0.23 | 0.31 |
| Gananoque | 80 | -22 | -24 | 28 | 23 | 4010 | 23 | 103 | 760 | 0.9 | 900 | 180 | 2.1 | 0.4 | 0.37 | 0.47 |
| Geraldton | 345 | -36 | -39 | 28 | 21 | 6450 | 20 | 86 | 550 | 0.8 | 725 | 100 | 2.9 | 0.4 | 0.22 | 0.3 |
| Glencoe | 215 | -16 | -18 | 31 | 24 | 3680 | 28 | 103 | 800 | 0.9 | 925 | 180 | 1.5 | 0.4 | 0.34 | 0.43 |
| Goderich | 185 | -16 | -18 | 29 | 23 | 4000 | 25 | 92 | 810 | 1.0 | 950 | 180 | 2.4 | 0.4 | 0.37 | 0.48 |
| Gore Bay | 205 | -24 | -26 | 28 | 22 | 4700 | 23 | 92 | 640 | 0.8 | 860 | 160 | 2.6 | 0.4 | 0.34 | 0.44 |
| Graham | 495 | -35 | -37 | 29 | 22 | 5940 | 23 | 97 | 570 | 0.8 | 750 | 140 | 2.6 | 0.3 | 0.22 | 0.3 |
| Gravenhurst (Muskoka Airport) | 255 | -26 | -28 | 29 | 23 | 4760 | 25 | 103 | 790 | 0.9 | 1050 | 120 | 2.7 | 0.4 | 0.28 | 0.36 |
| Grimsby | 85 | -16 | -18 | 30 | 23 | 3520 | 23 | 108 | 760 | 0.9 | 875 | 160 | 0.9 | 0.4 | 0.36 | 0.46 |
| Guelph | 340 | -19 | -21 | 29 | 23 | 4270 | 28 | 103 | 770 | 0.9 | 875 | 140 | 1.9 | 0.4 | 0.28 | 0.36 |
| Guthrie | 280 | -24 | -26 | 29 | 23 | 4300 | 28 | 103 | 700 | 0.8 | 950 | 120 | 2.5 | 0.4 | 0.28 | 0.36 |
| Haileybury | 210 | -32 | -35 | 30 | 22 | 5600 | 23 | 92 | 590 | 0.8 | 820 | 120 | 2.4 | 0.4 | 0.34 | 0.44 |
| Haldimand (Caledonia) | 190 | -18 | -20 | 30 | 23 | 3750 | 23 | 108 | 810 | 0.9 | 875 | 160 | 1.2 | 0.4 | 0.34 | 0.44 |
| Haldimand (Hagersville) | 215 | -17 | -19 | 30 | 23 | 3760 | 25 | 97 | 840 | 1.0 | 875 | 160 | 1.3 | 0.4 | 0.36 | 0.46 |
| Haliburton | 335 | -27 | -29 | 29 | 23 | 4840 | 25 | 92 | 780 | 0.9 | 980 | 100 | 2.9 | 0.4 | 0.27 | 0.35 |
| Halton Hills (Georgetown) | 255 | -19 | -21 | 30 | 23 | 4200 | 28 | 119 | 750 | 0.8 | 850 | 140 | 1.4 | 0.4 | 0.29 | 0.37 |
| Hamilton — Above Escarpment - West of John C. Munro Int'l Airport | 240 | -17 | -19 | 31 | 23 | 3460 | 23 | 108 | 810 | 0.9 | 875 | 160 | 1.5 | 0.4 | 0.36 | 0.46 |
| Hamilton — Above Escarpment - East of John C. Munro Int'l Airport | 200 | -17 | -19 | 31 | 23 | 3460 | 23 | 108 | 810 | 0.9 | 875 | 160 | 1.3 | 0.4 | 0.36 | 0.46 |
| Hamilton — Below Escarpment - West of Highway 403 | 90 | -17 | -19 | 31 | 23 | 3460 | 23 | 108 | 810 | 0.9 | 875 | 160 | 1.1 | 0.4 | 0.36 | 0.46 |
| Hamilton — Below Escarpment - East of Highway 403 | 90 | -17 | -19 | 31 | 23 | 3460 | 23 | 108 | 810 | 0.9 | 875 | 160 | 1.1 | 0.4 | 0.36 | 0.46 |
| Hanover | 270 | -19 | -21 | 29 | 22 | 4300 | 28 | 103 | 790 | 0.9 | 1050 | 140 | 2.6 | 0.4 | 0.34 | 0.44 |
| Hastings | 200 | -24 | -26 | 30 | 23 | 4280 | 25 | 92 | 730 | 0.9 | 840 | 140 | 2.0 | 0.4 | 0.32 | 0.41 |
| Hawkesbury | 50 | -25 | -27 | 30 | 23 | 4610 | 23 | 103 | 800 | 0.9 | 925 | 160 | 2.3 | 0.4 | 0.32 | 0.41 |
| Hearst | 245 | -35 | -37 | 29 | 21 | 6450 | 20 | 86 | 520 | 0.7 | 825 | 80 | 2.8 | 0.3 | 0.23 | 0.3 |
| Honey Harbour | 180 | -24 | -26 | 29 | 23 | 4300 | 25 | 97 | 710 | 0.9 | 1050 | 160 | 2.7 | 0.4 | 0.3 | 0.39 |
| Hornepayne | 360 | -37 | -40 | 28 | 21 | 6340 | 20 | 93 | 420 | 0.7 | 750 | 80 | 3.3 | 0.4 | 0.22 | 0.3 |
| Huntsville | 335 | -26 | -29 | 29 | 22 | 4850 | 25 | 103 | 800 | 0.9 | 1000 | 120 | 2.9 | 0.4 | 0.27 | 0.35 |
| Ingersoll | 280 | -18 | -20 | 30 | 23 | 3920 | 28 | 108 | 840 | 1.0 | 950 | 180 | 1.7 | 0.4 | 0.37 | 0.48 |
| Iroquois Falls | 275 | -33 | -36 | 29 | 21 | 6100 | 20 | 86 | 575 | 0.8 | 825 | 100 | 2.9 | 0.3 | 0.29 | 0.37 |
| Jellicoe | 330 | -36 | -39 | 28 | 21 | 6400 | 20 | 86 | 550 | 0.8 | 750 | 100 | 2.7 | 0.4 | 0.22 | 0.3 |
| Kapuskasing | 245 | -34 | -36 | 29 | 21 | 6250 | 20 | 86 | 550 | 0.8 | 825 | 100 | 3.0 | 0.3 | 0.24 | 0.31 |
| Kemptville | 90 | -25 | -27 | 30 | 23 | 4540 | 25 | 92 | 750 | 0.9 | 925 | 160 | 2.3 | 0.4 | 0.32 | 0.41 |
| Kenora | 370 | -33 | -35 | 28 | 22 | 5630 | 25 | 113 | 515 | 0.6 | 630 | 120 | 2.5 | 0.3 | 0.23 | 0.31 |
| Killaloe | 185 | -28 | -31 | 30 | 22 | 4960 | 23 | 86 | 680 | 0.8 | 825 | 120 | 2.7 | 0.4 | 0.27 | 0.35 |
| Kincardine | 190 | -17 | -19 | 28 | 22 | 3890 | 25 | 92 | 800 | 1.0 | 950 | 180 | 2.6 | 0.4 | 0.37 | 0.48 |
| Kingston | 80 | -22 | -24 | 28 | 23 | 4000 | 23 | 108 | 780 | 1.0 | 950 | 180 | 2.1 | 0.4 | 0.37 | 0.47 |
| Kinmount | 295 | -26 | -28 | 29 | 23 | 4600 | 25 | 108 | 750 | 0.9 | 950 | 120 | 2.7 | 0.4 | 0.27 | 0.35 |
| Kirkland Lake | 325 | -33 | -36 | 29 | 22 | 6000 | 23 | 92 | 600 | 0.8 | 875 | 100 | 2.9 | 0.3 | 0.3 | 0.39 |
| Kitchener | 335 | -19 | -21 | 29 | 23 | 4200 | 28 | 119 | 780 | 0.9 | 925 | 140 | 2.0 | 0.4 | 0.29 | 0.37 |
| Lakefield | 240 | -24 | -26 | 30 | 23 | 4330 | 25 | 92 | 720 | 0.9 | 850 | 140 | 2.2 | 0.4 | 0.3 | 0.38 |
| Lansdowne House | 240 | -38 | -40 | 28 | 21 | 7150 | 23 | 92 | 500 | 0.8 | 680 | 140 | 3.0 | 0.2 | 0.24 | 0.32 |
| Leamington | 190 | -15 | -17 | 31 | 24 | 3400 | 28 | 113 | 800 | 0.9 | 875 | 180 | 0.8 | 0.4 | 0.37 | 0.47 |
| Lindsay | 265 | -24 | -26 | 30 | 23 | 4320 | 25 | 103 | 720 | 0.8 | 850 | 140 | 2.3 | 0.4 | 0.3 | 0.38 |
| Lion's Head | 185 | -19 | -21 | 27 | 22 | 4300 | 25 | 103 | 700 | 0.9 | 950 | 180 | 2.7 | 0.4 | 0.37 | 0.48 |
| Listowel | 380 | -19 | -21 | 29 | 23 | 4300 | 28 | 119 | 800 | 0.9 | 1000 | 160 | 2.6 | 0.4 | 0.34 | 0.43 |
| London | 245 | -18 | -20 | 30 | 24 | 3900 | 28 | 103 | 825 | 0.9 | 975 | 180 | 1.9 | 0.4 | 0.37 | 0.47 |
| Lucan | 300 | -17 | -19 | 30 | 23 | 3900 | 25 | 113 | 810 | 0.9 | 1000 | 180 | 2.3 | 0.4 | 0.37 | 0.48 |
| Maitland | 85 | -23 | -25 | 29 | 23 | 4080 | 25 | 103 | 770 | 0.9 | 975 | 180 | 2.2 | 0.4 | 0.34 | 0.44 |
| Markdale | 425 | -20 | -22 | 29 | 22 | 4500 | 28 | 103 | 820 | 0.9 | 1050 | 160 | 3.2 | 0.4 | 0.32 | 0.41 |
| Markham | 175 | -21 | -23 | 31 | 24 | 4000 | 25 | 86 | 720 | 0.8 | 825 | 140 | 1.3 | 0.4 | 0.34 | 0.44 |
| Martin | 485 | -35 | -37 | 29 | 22 | 5900 | 25 | 103 | 560 | 0.8 | 750 | 120 | 2.6 | 0.3 | 0.22 | 0.3 |
| Matheson | 265 | -33 | -36 | 29 | 21 | 6080 | 20 | 86 | 580 | 0.8 | 825 | 100 | 2.8 | 0.3 | 0.3 | 0.39 |
| Mattawa | 165 | -29 | -31 | 30 | 22 | 5050 | 23 | 86 | 700 | 0.9 | 875 | 100 | 2.1 | 0.4 | 0.25 | 0.32 |
| Midland | 190 | -24 | -26 | 29 | 23 | 4200 | 25 | 97 | 740 | 0.9 | 1060 | 160 | 2.7 | 0.4 | 0.3 | 0.39 |
| Milton | 200 | -18 | -20 | 30 | 23 | 3920 | 25 | 125 | 750 | 0.9 | 850 | 160 | 1.3 | 0.4 | 0.34 | 0.43 |
| Milverton | 370 | -19 | -21 | 29 | 23 | 4200 | 28 | 108 | 800 | 0.9 | 1050 | 160 | 2.4 | 0.4 | 0.34 | 0.43 |
| Minden | 270 | -27 | -29 | 29 | 23 | 4640 | 25 | 97 | 780 | 0.9 | 1010 | 100 | 2.7 | 0.4 | 0.27 | 0.35 |
| Mississauga | 160 | -18 | -20 | 30 | 23 | 3880 | 25 | 113 | 720 | 0.9 | 800 | 160 | 1.1 | 0.4 | 0.34 | 0.44 |
| Mississauga (Lester B. Pearson International Airport) | 170 | -20 | -22 | 31 | 24 | 3890 | 26 | 108 | 685 | 0.8 | 790 | 160 | 1.1 | 0.4 | 0.34 | 0.44 |
| Mississauga (Port Credit) | 75 | -18 | -20 | 29 | 23 | 3780 | 25 | 108 | 720 | 0.9 | 800 | 160 | 0.9 | 0.4 | 0.37 | 0.48 |
| Mitchell | 335 | -18 | -20 | 29 | 23 | 4100 | 28 | 113 | 810 | 0.9 | 1050 | 160 | 2.4 | 0.4 | 0.35 | 0.45 |
| Moosonee | 10 | -36 | -38 | 28 | 22 | 6800 | 18 | 81 | 500 | 0.8 | 700 | 160 | 2.7 | 0.3 | 0.26 | 0.35 |
| Morrisburg | 75 | -23 | -25 | 30 | 23 | 4370 | 25 | 103 | 800 | 0.9 | 950 | 180 | 2.3 | 0.4 | 0.32 | 0.41 |
| Mount Forest | 420 | -21 | -24 | 28 | 22 | 4700 | 28 | 103 | 740 | 0.9 | 940 | 140 | 2.7 | 0.4 | 0.32 | 0.41 |
| Nakina | 325 | -36 | -38 | 28 | 21 | 6500 | 20 | 86 | 540 | 0.8 | 750 | 100 | 2.8 | 0.4 | 0.22 | 0.3 |
| Nanticoke (Jarvis) | 205 | -17 | -18 | 30 | 23 | 3700 | 28 | 108 | 840 | 1.0 | 900 | 160 | 1.4 | 0.4 | 0.37 | 0.48 |
| Nanticoke (Port Dover) | 180 | -15 | -17 | 30 | 24 | 3600 | 25 | 108 | 860 | 1.0 | 950 | 140 | 1.2 | 0.4 | 0.37 | 0.48 |
| Napanee | 90 | -22 | -24 | 29 | 23 | 4140 | 23 | 92 | 770 | 0.9 | 900 | 160 | 1.9 | 0.4 | 0.34 | 0.43 |
| Newcastle | 115 | -20 | -22 | 30 | 23 | 3990 | 23 | 86 | 760 | 0.9 | 830 | 160 | 1.5 | 0.4 | 0.37 | 0.48 |
| Newcastle (Bowmanville) | 95 | -20 | -22 | 30 | 23 | 4000 | 23 | 86 | 760 | 0.9 | 830 | 160 | 1.4 | 0.4 | 0.37 | 0.48 |
| New Liskeard | 180 | -32 | -35 | 30 | 22 | 5570 | 23 | 92 | 570 | 0.8 | 810 | 100 | 2.6 | 0.4 | 0.34 | 0.43 |
| Newmarket | 185 | -22 | -24 | 30 | 23 | 4260 | 28 | 108 | 700 | 0.8 | 800 | 140 | 2.0 | 0.4 | 0.3 | 0.38 |
| Niagara Falls | 210 | -16 | -18 | 30 | 23 | 3600 | 23 | 96 | 810 | 0.9 | 950 | 160 | 1.8 | 0.4 | 0.34 | 0.43 |
| North Bay | 210 | -28 | -30 | 28 | 22 | 5150 | 25 | 95 | 775 | 0.9 | 975 | 120 | 2.2 | 0.4 | 0.27 | 0.34 |
| Norwood | 225 | -24 | -26 | 30 | 23 | 4320 | 25 | 92 | 720 | 0.8 | 850 | 120 | 2.1 | 0.4 | 0.32 | 0.41 |
| Oakville | 90 | -18 | -20 | 30 | 23 | 3760 | 23 | 97 | 750 | 0.9 | 850 | 160 | 1.1 | 0.4 | 0.37 | 0.47 |
| Orangeville | 430 | -21 | -23 | 29 | 23 | 4450 | 28 | 108 | 730 | 0.8 | 875 | 140 | 2.3 | 0.4 | 0.28 | 0.36 |
| Orillia | 230 | -25 | -27 | 29 | 23 | 4260 | 25 | 103 | 740 | 0.9 | 1000 | 120 | 2.4 | 0.4 | 0.28 | 0.36 |
| Oshawa | 110 | -19 | -21 | 30 | 23 | 3860 | 23 | 86 | 760 | 0.9 | 875 | 160 | 1.4 | 0.4 | 0.37 | 0.48 |
| Ottawa (Barrhaven) | 98 | -25 | -27 | 30 | 23 | 4500 | 25 | 92 | 750 | 0.8 | 900 | 160 | 2.4 | 0.4 | 0.32 | 0.41 |
| Ottawa (City Hall) | 70 | -25 | -27 | 30 | 23 | 4440 | 23 | 86 | 750 | 0.8 | 900 | 160 | 2.4 | 0.4 | 0.32 | 0.41 |
| Ottawa (Kanata) | 98 | -25 | -27 | 30 | 23 | 4520 | 25 | 92 | 730 | 0.8 | 900 | 160 | 2.5 | 0.4 | 0.32 | 0.41 |
| Ottawa (MacDonald-Cartier Int'l Airport) | 125 | -25 | -27 | 30 | 23 | 4500 | 24 | 89 | 750 | 0.8 | 900 | 160 | 2.4 | 0.4 | 0.32 | 0.41 |
| Ottawa (Orleans) | 70 | -26 | -28 | 30 | 23 | 4500 | 23 | 91 | 750 | 0.8 | 900 | 160 | 2.4 | 0.4 | 0.32 | 0.41 |
| Owen Sound | 215 | -19 | -21 | 29 | 22 | 4030 | 28 | 113 | 760 | 0.9 | 1075 | 160 | 2.8 | 0.4 | 0.34 | 0.44 |
| Pagwa River | 185 | -35 | -37 | 28 | 21 | 6500 | 20 | 86 | 540 | 0.8 | 825 | 80 | 2.7 | 0.4 | 0.22 | 0.3 |
| Paris | 245 | -18 | -20 | 30 | 23 | 4000 | 23 | 96 | 790 | 0.9 | 925 | 160 | 1.4 | 0.4 | 0.33 | 0.42 |
| Parkhill | 205 | -16 | -18 | 31 | 23 | 3800 | 25 | 103 | 800 | 0.9 | 925 | 180 | 2.1 | 0.4 | 0.37 | 0.48 |
| Parry Sound | 215 | -24 | -26 | 28 | 22 | 4640 | 23 | 97 | 820 | 1.0 | 1050 | 160 | 2.8 | 0.4 | 0.3 | 0.39 |
| Pelham (Fonthill) | 230 | -15 | -17 | 30 | 23 | 3690 | 23 | 96 | 820 | 0.9 | 950 | 160 | 2.1 | 0.4 | 0.33 | 0.42 |
| Pembroke | 125 | -28 | -31 | 30 | 23 | 4980 | 23 | 105 | 640 | 0.8 | 825 | 100 | 2.5 | 0.4 | 0.27 | 0.35 |
| Penetanguishene | 220 | -24 | -26 | 29 | 23 | 4200 | 25 | 97 | 720 | 0.9 | 1050 | 160 | 2.8 | 0.4 | 0.3 | 0.39 |
| Perth | 130 | -25 | -27 | 30 | 23 | 4540 | 25 | 92 | 730 | 0.8 | 900 | 140 | 2.3 | 0.4 | 0.32 | 0.41 |
| Petawawa | 135 | -29 | -31 | 30 | 23 | 4980 | 23 | 92 | 640 | 0.8 | 825 | 100 | 2.6 | 0.4 | 0.27 | 0.35 |
| Peterborough | 200 | -23 | -25 | 30 | 23 | 4400 | 25 | 92 | 710 | 0.8 | 840 | 140 | 2.0 | 0.4 | 0.32 | 0.41 |
| Petrolia | 195 | -16 | -18 | 31 | 24 | 3640 | 25 | 108 | 810 | 0.9 | 920 | 180 | 1.3 | 0.4 | 0.37 | 0.47 |
| Pickering Zone 1 | 85 | -19 | -21 | 30 | 23 | 3800 | 23 | 92 | 730 | 0.9 | 825 | 140 | 1.0 | 0.4 | 0.37 | 0.48 |
| Pickering Zone 2 | 175 | -20 | -22 | 30 | 23 | 3900 | 23 | 92 | 730 | 0.9 | 825 | 140 | 1.5 | 0.4 | 0.37 | 0.48 |
| Pickering Zone 3 | 255 | -21 | -23 | 30 | 23 | 4010 | 23 | 86 | 770 | 0.91 | 850 | 140 | 1.9 | 0.4 | 0.35 | 0.45 |
| Pickering Zone 4 | 315 | -22 | -24 | 30 | 23 | 4200 | 23 | 86 | 770 | 0.91 | 850 | 140 | 2.3 | 0.4 | 0.35 | 0.45 |
| Picton | 95 | -21 | -23 | 29 | 23 | 3980 | 23 | 92 | 770 | 0.9 | 940 | 160 | 2.0 | 0.4 | 0.38 | 0.49 |
| Plattsville | 300 | -19 | -21 | 29 | 23 | 4150 | 28 | 103 | 820 | 0.9 | 950 | 140 | 1.9 | 0.4 | 0.33 | 0.42 |
| Point Alexander | 150 | -29 | -32 | 30 | 22 | 4960 | 23 | 92 | 650 | 0.8 | 850 | 100 | 2.5 | 0.4 | 0.27 | 0.35 |
| Port Burwell | 195 | -15 | -17 | 30 | 24 | 3800 | 25 | 92 | 930 | 1.1 | 1000 | 180 | 1.2 | 0.4 | 0.37 | 0.47 |
| Port Colborne | 180 | -15 | -17 | 30 | 24 | 3600 | 23 | 108 | 850 | 1.0 | 1000 | 160 | 2.1 | 0.4 | 0.36 | 0.46 |
| Port Elgin | 205 | -17 | -19 | 28 | 22 | 4100 | 25 | 92 | 790 | 0.9 | 850 | 180 | 2.8 | 0.4 | 0.37 | 0.48 |
| Port Hope | 100 | -21 | -23 | 29 | 23 | 3970 | 23 | 94 | 760 | 0.9 | 825 | 180 | 1.2 | 0.4 | 0.37 | 0.48 |
| Port Perry | 270 | -22 | -24 | 30 | 23 | 4260 | 25 | 97 | 720 | 0.8 | 850 | 140 | 2.4 | 0.4 | 0.34 | 0.44 |
| Port Stanley | 180 | -15 | -17 | 31 | 24 | 3850 | 25 | 92 | 940 | 1.1 | 975 | 180 | 1.2 | 0.4 | 0.37 | 0.47 |
| Prescott | 90 | -23 | -25 | 29 | 23 | 4120 | 25 | 103 | 770 | 0.9 | 975 | 180 | 2.2 | 0.4 | 0.34 | 0.44 |
| Princeton | 280 | -18 | -20 | 30 | 23 | 4000 | 25 | 97 | 810 | 0.9 | 925 | 160 | 1.5 | 0.4 | 0.33 | 0.42 |
| Raith | 475 | -34 | -37 | 28 | 22 | 5900 | 23 | 97 | 570 | 0.8 | 750 | 120 | 2.7 | 0.4 | 0.22 | 0.3 |
| Rayside-Balfour (Chelmsford) | 270 | -28 | -30 | 29 | 21 | 5200 | 25 | 92 | 650 | 0.8 | 850 | 180 | 2.5 | 0.4 | 0.35 | 0.45 |
| Red Lake | 360 | -35 | -37 | 28 | 21 | 6220 | 20 | 92 | 470 | 0.7 | 630 | 120 | 2.6 | 0.3 | 0.22 | 0.3 |
| Renfrew | 115 | -27 | -30 | 30 | 23 | 4900 | 23 | 97 | 620 | 0.8 | 810 | 140 | 2.5 | 0.4 | 0.27 | 0.35 |
| Richmond Hill | 230 | -21 | -23 | 31 | 24 | 4000 | 25 | 97 | 740 | 0.8 | 850 | 140 | 1.5 | 0.4 | 0.34 | 0.44 |
| Rockland | 50 | -26 | -28 | 30 | 23 | 4600 | 23 | 92 | 780 | 0.9 | 950 | 160 | 2.4 | 0.4 | 0.31 | 0.4 |
| Sarnia | 190 | -16 | -18 | 31 | 24 | 3750 | 25 | 100 | 750 | 0.9 | 825 | 180 | 1.1 | 0.4 | 0.37 | 0.47 |
| Sault Ste. Marie | 190 | -25 | -28 | 29 | 22 | 4960 | 23 | 97 | 660 | 0.9 | 950 | 200 | 3.1 | 0.4 | 0.33 | 0.44 |
| Schreiber | 310 | -34 | -36 | 27 | 21 | 5960 | 20 | 103 | 600 | 0.8 | 850 | 160 | 3.3 | 0.4 | 0.29 | 0.39 |
| Seaforth | 310 | -17 | -19 | 30 | 23 | 4100 | 25 | 108 | 810 | 0.9 | 1025 | 160 | 2.5 | 0.4 | 0.35 | 0.45 |
| Shelburne | 495 | -22 | -24 | 29 | 23 | 4700 | 28 | 108 | 740 | 0.9 | 900 | 150 | 3.1 | 0.4 | 0.31 | 0.4 |
| Simcoe | 210 | -17 | -19 | 30 | 24 | 3700 | 28 | 113 | 860 | 1.0 | 950 | 160 | 1.3 | 0.4 | 0.35 | 0.45 |
| Sioux Lookout | 375 | -34 | -36 | 28 | 22 | 5950 | 25 | 97 | 520 | 0.7 | 710 | 100 | 2.6 | 0.3 | 0.22 | 0.3 |
| Smiths Falls | 130 | -25 | -27 | 30 | 23 | 4540 | 25 | 92 | 730 | 0.8 | 850 | 140 | 2.3 | 0.4 | 0.32 | 0.41 |
| Smithville | 185 | -16 | -18 | 30 | 23 | 3650 | 23 | 108 | 800 | 0.9 | 900 | 160 | 1.5 | 0.4 | 0.33 | 0.42 |
| Smooth Rock Falls | 235 | -34 | -36 | 29 | 21 | 6250 | 20 | 92 | 560 | 0.8 | 850 | 80 | 2.7 | 0.3 | 0.25 | 0.32 |
| Southampton | 180 | -17 | -19 | 28 | 22 | 4100 | 25 | 92 | 800 | 1.0 | 830 | 180 | 2.7 | 0.4 | 0.37 | 0.48 |
| South River | 355 | -27 | -29 | 29 | 22 | 5090 | 25 | 103 | 830 | 1.0 | 975 | 120 | 2.8 | 0.4 | 0.27 | 0.35 |
| St. Catharines | 105 | -16 | -18 | 30 | 23 | 3540 | 23 | 92 | 770 | 0.9 | 850 | 160 | 1.0 | 0.4 | 0.36 | 0.46 |
| St. Mary's | 310 | -18 | -20 | 30 | 23 | 4000 | 28 | 108 | 820 | 1.0 | 1025 | 160 | 2.2 | 0.4 | 0.37 | 0.47 |
| St. Thomas | 225 | -16 | -18 | 31 | 24 | 3780 | 25 | 103 | 900 | 1.0 | 975 | 180 | 1.4 | 0.4 | 0.37 | 0.47 |
| Stirling | 120 | -23 | -25 | 30 | 23 | 4220 | 25 | 97 | 740 | 0.9 | 850 | 120 | 1.7 | 0.4 | 0.31 | 0.4 |
| Stratford | 360 | -18 | -20 | 29 | 23 | 4050 | 28 | 113 | 820 | 1.0 | 1050 | 160 | 2.3 | 0.4 | 0.35 | 0.45 |
| Strathroy | 225 | -17 | -19 | 31 | 24 | 3780 | 25 | 103 | 770 | 0.9 | 950 | 180 | 1.9 | 0.4 | 0.37 | 0.47 |
| Sturgeon Falls | 205 | -28 | -30 | 29 | 21 | 5200 | 25 | 95 | 700 | 0.9 | 910 | 140 | 2.4 | 0.4 | 0.27 | 0.35 |
| Sudbury | 275 | -28 | -30 | 29 | 21 | 5180 | 25 | 97 | 650 | 0.8 | 875 | 200 | 2.5 | 0.4 | 0.36 | 0.46 |
| Sundridge | 340 | -27 | -29 | 29 | 22 | 5080 | 25 | 97 | 840 | 1.0 | 975 | 120 | 2.8 | 0.4 | 0.27 | 0.35 |
| Tavistock | 340 | -19 | -21 | 29 | 23 | 4100 | 28 | 113 | 820 | 1.0 | 1010 | 160 | 2.1 | 0.4 | 0.35 | 0.45 |
| Temagami | 300 | -30 | -33 | 30 | 22 | 5420 | 23 | 92 | 650 | 0.8 | 875 | 120 | 2.6 | 0.4 | 0.29 | 0.37 |
| Thamesford | 280 | -19 | -21 | 30 | 23 | 3950 | 28 | 108 | 820 | 0.9 | 975 | 160 | 1.9 | 0.4 | 0.37 | 0.48 |
| Thedford | 205 | -16 | -18 | 31 | 23 | 3710 | 25 | 103 | 810 | 1.0 | 900 | 180 | 2.1 | 0.4 | 0.37 | 0.48 |
| Thunder Bay | 210 | -31 | -33 | 29 | 21 | 5650 | 23 | 108 | 560 | 0.8 | 710 | 160 | 2.9 | 0.4 | 0.29 | 0.39 |
| Tillsonburg | 215 | -17 | -19 | 30 | 24 | 3840 | 25 | 103 | 880 | 1.0 | 980 | 160 | 1.3 | 0.4 | 0.34 | 0.44 |
| Timmins | 300 | -34 | -36 | 29 | 21 | 5940 | 20 | 108 | 560 | 0.8 | 875 | 100 | 3.1 | 0.3 | 0.27 | 0.35 |
| Timmins (Porcupine) | 295 | -34 | -36 | 29 | 21 | 6000 | 20 | 103 | 560 | 0.8 | 875 | 100 | 2.9 | 0.3 | 0.29 | 0.37 |
| Toronto Metropolitan Region — Etobicoke | 160 | -20 | -22 | 31 | 24 | 3800 | 26 | 108 | 720 | 0.8 | 800 | 160 | 1.1 | 0.4 | 0.34 | 0.44 |
| Toronto Metropolitan Region — North York | 175 | -20 | -22 | 31 | 24 | 3760 | 25 | 108 | 730 | 0.8 | 850 | 150 | 1.2 | 0.4 | 0.34 | 0.44 |
| Toronto Metropolitan Region — Scarborough | 180 | -20 | -22 | 31 | 24 | 3800 | 25 | 92 | 730 | 0.9 | 825 | 160 | 1.2 | 0.4 | 0.37 | 0.47 |
| Toronto Metropolitan Region — Toronto (City Hall) | 90 | -18 | -20 | 31 | 23 | 3520 | 25 | 97 | 720 | 0.9 | 820 | 160 | 0.9 | 0.4 | 0.34 | 0.44 |
| Trenton | 80 | -22 | -24 | 29 | 23 | 4110 | 23 | 97 | 760 | 0.9 | 850 | 160 | 1.6 | 0.4 | 0.37 | 0.47 |
| Trout Creek | 330 | -27 | -29 | 29 | 22 | 5100 | 25 | 103 | 780 | 0.9 | 975 | 120 | 2.7 | 0.4 | 0.27 | 0.35 |
| Uxbridge | 275 | -22 | -24 | 30 | 23 | 4240 | 25 | 103 | 700 | 0.8 | 850 | 140 | 2.4 | 0.4 | 0.33 | 0.42 |
| Vaughan (Woodbridge) | 165 | -20 | -22 | 31 | 24 | 4100 | 26 | 113 | 700 | 0.8 | 800 | 140 | 1.1 | 0.4 | 0.34 | 0.44 |
| Vittoria | 215 | -15 | -17 | 30 | 24 | 3680 | 25 | 113 | 880 | 1.0 | 950 | 160 | 1.3 | 0.4 | 0.37 | 0.47 |
| Walkerton | 275 | -18 | -20 | 30 | 22 | 4300 | 28 | 103 | 790 | 0.9 | 1025 | 160 | 2.7 | 0.4 | 0.36 | 0.46 |
| Wallaceburg | 180 | -16 | -18 | 31 | 24 | 3600 | 28 | 97 | 760 | 0.9 | 825 | 180 | 0.9 | 0.4 | 0.35 | 0.45 |
| Waterloo | 330 | -19 | -21 | 29 | 23 | 4200 | 28 | 119 | 780 | 0.9 | 925 | 160 | 2.0 | 0.4 | 0.29 | 0.37 |
| Watford | 240 | -17 | -19 | 31 | 24 | 3740 | 25 | 108 | 790 | 0.9 | 950 | 160 | 1.9 | 0.4 | 0.37 | 0.47 |
| Wawa | 290 | -34 | -36 | 26 | 21 | 5840 | 20 | 93 | 725 | 0.9 | 950 | 160 | 3.4 | 0.4 | 0.3 | 0.39 |
| Welland | 180 | -15 | -17 | 30 | 23 | 3670 | 23 | 103 | 840 | 1.0 | 975 | 160 | 2.0 | 0.4 | 0.34 | 0.43 |
| West Lorne | 215 | -16 | -18 | 31 | 24 | 3700 | 28 | 103 | 840 | 1.0 | 900 | 180 | 1.3 | 0.4 | 0.37 | 0.47 |
| Whitby | 85 | -20 | -22 | 30 | 23 | 3820 | 23 | 86 | 760 | 0.9 | 850 | 160 | 1.2 | 0.4 | 0.37 | 0.48 |
| Whitby (Brooklin) | 160 | -20 | -22 | 30 | 23 | 4010 | 23 | 86 | 770 | 0.9 | 850 | 140 | 1.9 | 0.4 | 0.35 | 0.45 |
| White River | 375 | -39 | -42 | 28 | 21 | 6150 | 20 | 92 | 575 | 0.8 | 825 | 100 | 3.6 | 0.4 | 0.22 | 0.3 |
| Wiarton | 185 | -19 | -21 | 29 | 22 | 4300 | 25 | 103 | 740 | 0.9 | 1000 | 180 | 2.7 | 0.4 | 0.34 | 0.44 |
| Windsor | 185 | -16 | -18 | 32 | 24 | 3400 | 28 | 103 | 800 | 0.9 | 900 | 180 | 0.8 | 0.4 | 0.37 | 0.47 |
| Wingham | 310 | -18 | -20 | 30 | 23 | 4220 | 28 | 108 | 780 | 0.9 | 1050 | 160 | 2.6 | 0.4 | 0.36 | 0.46 |
| Woodstock | 300 | -19 | -21 | 30 | 23 | 3910 | 28 | 113 | 830 | 0.9 | 930 | 160 | 1.9 | 0.4 | 0.34 | 0.44 |
| Wyoming | 215 | -16 | -18 | 31 | 24 | 3700 | 25 | 103 | 815 | 0.9 | 900 | 180 | 1.6 | 0.4 | 0.37 | 0.47 |
Seismic Data for Part 4
The seismic hazard values to be used for the design of buildings under Part 4 can be obtained from the 2020 National Building Code of Canada Seismic Hazard Tool (https://doi.org/10.23687/b1bd3cf0-0672-47f4-8bfa-290ae75fde9b), which provides seismic hazard values for any site in Canada defined by latitude, longitude and site designation. The seismic hazard values used for the design of buildings under Part 4 must correspond to the applicable probability of exceedance stated in Subsection 4.1.8. The tool also provides seismic hazard values at additional probabilities and periods.
Seismic hazard values can be appreciably different for localities across a large locale. Therefore, applying the same seismic hazard value to a large geographic area could result in buildings being over-designed or under-designed. Given the large number of data points in Ontario, listing every locality in a table is not practical. For archival purposes, the seismic hazard values of locations for specific latitudes and longitudes are reproduced from the 2020 National Building Code of Canada Seismic Hazard Tool on NPARC at https://doi.org/10.4224/nqzr-dz38. The digital properties of the NPARC website are more suited for a static, archival data set. As such, Figure A-1.1.3.1.(4) for Division B identifies the NPARC website as the primary data set for the specified latitude and longitudes.
The parameters used to represent seismic hazard for specific geographical locations are the 5%-damped horizontal spectral acceleration for periods of 0.2 s, 0.5 s, 1.0 s, 2.0 s, 5.0 s and 10.0 s, the horizontal peak ground acceleration (PGA) and the horizontal peak ground velocity (PGV) corresponding to a 2% probability of being exceeded in 50 years. The six spectral acceleration parameters are deemed sufficient to define spectra closely matching the shape of the uniform hazard spectra (UHS) for design purposes. Spectral acceleration values for additional periods are provided for use in the selection of ground motion time histories. Spectral acceleration values for additional probabilities of exceedance are also provided.
The seismic hazard values are mean values based on a statistical analysis of the earthquakes that have been experienced in Ontario and adjacent regions.(11) They were updated for the 2024 edition of the Building Code by slightly revising the seismic source zones(12) to match new information, revising the ground motion models (GMMs),(13) and using a probabilistic model to combine all inputs.
In addition, the method of determining seismic hazard values for different site designations has changed. For the 2012 Building Code, the seismic hazard values were calculated for reference Site Class C, and the values for other site designations were determined by applying a site coefficient to the calculated values. For the 2024 Building Code, the seismic hazard values for each site designation were calculated directly.
For almost all locations, the revised GMMs are the most significant reason for changes in the seismic hazard values from the 2012 Building Code. In general, the estimated seismic hazard has increased across Ontario.
Further details regarding the representation of seismic hazard can be found in the Commentary entitled Design for Seismic Effects in the "Structural Commentaries (User's Guide – NBC 2020: Part 4 of Division B)".
Seismic Data for Part 9
Table 3 lists the seismic hazard values to be used in the application of the prescriptive requirements in Part 9 relating to lateral loads due to earthquake (these values are the same as those listed in Table 3 of Supplementary Standard SB-1 in the 2012 Building Code Compendium).
Table 3: Seismic Design Data for Selected Locations in Ontario for Part 9 Design
| Location | Sa(0.2) for Seismic Design in Part 9 |
|---|---|
| Ailsa Craig | 0.095 |
| Ajax | 0.210 |
| Alexandria | 0.589 |
| Alliston | 0.111 |
| Almonte | 0.337 |
| Armstrong | 0.064 |
| Arnprior | 0.371 |
| Atikokan | 0.069 |
| Attawapiskat | 0.074 |
| Aurora | 0.138 |
| Bancroft | 0.151 |
| Barrie | 0.108 |
| Barriefield | 0.162 |
| Beaverton | 0.117 |
| Belleville | 0.162 |
| Belmont | 0.116 |
| Big Trout Lake (Kitchenuhmaykoosib) | 0.054 |
| CFB Borden | 0.107 |
| Bracebridge | 0.116 |
| Bradford | 0.123 |
| Brampton | 0.168 |
| Brantford | 0.155 |
| Brighton | 0.173 |
| Brockville | 0.259 |
| Burk's Falls | 0.143 |
| Burlington | 0.266 |
| Caledon | 0.168 |
| Cambridge | 0.141 |
| Campbellford | 0.144 |
| Cannington | 0.122 |
| Carleton Place | 0.302 |
| Cavan | 0.140 |
| Centralia | 0.092 |
| Chapleau | 0.071 |
| Chatham | 0.112 |
| Chesley | 0.083 |
| Clinton | 0.084 |
| Coboconk | 0.120 |
| Cobourg | 0.179 |
| Cochrane | 0.222 |
| Colborne | 0.176 |
| Collingwood | 0.096 |
| Cornwall | 0.587 |
| Corunna | 0.087 |
| Deep River | 0.389 |
| Deseronto | 0.158 |
| Dorchester | 0.112 |
| Dorion | 0.059 |
| Dresden | 0.104 |
| Dryden | 0.072 |
| Dundalk | 0.097 |
| Dunnville | 0.232 |
| Durham | 0.088 |
| Dutton | 0.116 |
| Earlton | 0.182 |
| Edison | 0.070 |
| Elliot Lake | 0.074 |
| Elmvale | 0.101 |
| Embro | 0.111 |
| Englehart | 0.175 |
| Espanola | 0.086 |
| Exeter | 0.090 |
| Fenelon Falls | 0.121 |
| Fergus | 0.115 |
| Forest | 0.087 |
| Fort Erie | 0.312 |
| Fort Erie (Ridgeway) | 0.307 |
| Fort Frances | 0.064 |
| Gananoque | 0.180 |
| Geraldton | 0.057 |
| Glencoe | 0.107 |
| Goderich | 0.079 |
| Gore Bay | 0.071 |
| Graham | 0.071 |
| Gravenhurst (Muskoka Airport) | 0.112 |
| Grimsby | 0.301 |
| Guelph | 0.133 |
| Guthrie | 0.109 |
| Haileybury | 0.219 |
| Haldimand (Caledonia) | 0.215 |
| Haldimand (Hagersville) | 0.172 |
| Haliburton | 0.133 |
| Halton Hills (Georgetown) | 0.155 |
| Hamilton | 0.260 |
| Hanover | 0.085 |
| Hastings | 0.141 |
| Hawkesbury | 0.506 |
| Hearst | 0.073 |
| Honey Harbour | 0.103 |
| Hornepayne | 0.063 |
| Huntsville | 0.129 |
| Ingersoll | 0.116 |
| Iroquois Falls | 0.196 |
| Jellicoe | 0.057 |
| Kapuskasing | 0.112 |
| Kemptville | 0.429 |
| Kenora | 0.064 |
| Killaloe | 0.264 |
| Kincardine | 0.076 |
| Kingston | 0.161 |
| Kinmount | 0.123 |
| Kirkland Lake | 0.159 |
| Kitchener | 0.122 |
| Lakefield | 0.130 |
| Lansdowne House | 0.056 |
| Leamington | 0.114 |
| Lindsay | 0.126 |
| Lion's Head | 0.080 |
| Listowel | 0.093 |
| London | 0.108 |
| Lucan | 0.097 |
| Maitland | 0.282 |
| Markdale | 0.089 |
| Markham | 0.182 |
| Martin | 0.072 |
| Matheson | 0.160 |
| Mattawa | 0.446 |
| Midland | 0.101 |
| Milton | 0.191 |
| Milverton | 0.098 |
| Minden | 0.124 |
| Mississauga | 0.219 |
| Mississauga (Lester B. Pearson International Airport) | 0.193 |
| Mississauga (Port Credit) | 0.247 |
| Mitchell | 0.093 |
| Moosonee | 0.081 |
| Morrisburg | 0.558 |
| Mount Forest | 0.093 |
| Nakina | 0.057 |
| Nanticoke (Jarvis) | 0.156 |
| Nanticoke (Port Dover) | 0.144 |
| Napanee | 0.156 |
| New Liskeard | 0.209 |
| Newcastle | 0.186 |
| Newcastle (Bowmanville) | 0.188 |
| Newmarket | 0.132 |
| Niagara Falls | 0.321 |
| North Bay | 0.247 |
| Norwood | 0.136 |
| Oakville | 0.260 |
| Orangeville | 0.115 |
| Orillia | 0.109 |
| Oshawa | 0.192 |
| Ottawa (Metropolitan) | N/A |
| Ottawa (City Hall) | 0.439 |
| Ottawa (Barrhaven) | 0.427 |
| Ottawa (Kanata) | 0.401 |
| Ottawa (MacDonald-Cartier Int'l Airport) | 0.446 |
| Ottawa (Orleans) | 0.474 |
| Owen Sound | 0.083 |
| Pagwa River | 0.060 |
| Paris | 0.141 |
| Parkhill | 0.092 |
| Parry Sound | 0.110 |
| Pelham (Fonthill) | 0.311 |
| Pembroke | 0.379 |
| Penetanguishene | 0.101 |
| Perth | 0.225 |
| Petawawa | 0.379 |
| Peterborough | 0.135 |
| Petrolia | 0.092 |
| Pickering (Zones 1 to 4) | 0.219 |
| Picton | 0.159 |
| Plattsville | 0.119 |
| Point Alexander | 0.391 |
| Port Burwell | 0.132 |
| Port Colborne | 0.298 |
| Port Elgin | 0.077 |
| Port Hope | 0.181 |
| Port Perry | 0.144 |
| Port Stanley | 0.123 |
| Prescott | 0.350 |
| Princeton | 0.129 |
| Raith | 0.067 |
| Rayside-Balfour (Chelmsford) | 0.104 |
| Red Lake | 0.068 |
| Renfrew | 0.352 |
| Richmond Hill | 0.163 |
| Rockland | 0.510 |
| Sarnia | 0.085 |
| Sault Ste. Marie | 0.062 |
| Schreiber | 0.057 |
| Seaforth | 0.087 |
| Shelburne | 0.104 |
| Simcoe | 0.141 |
| Sioux Lookout | 0.073 |
| Smiths Falls | 0.256 |
| Smithville | 0.296 |
| Smooth Rock Falls | 0.200 |
| South River | 0.164 |
| Southampton | 0.077 |
| St. Catharines | 0.319 |
| St. Mary's | 0.101 |
| St. Thomas | 0.117 |
| Stirling | 0.149 |
| Stratford | 0.103 |
| Strathroy | 0.100 |
| Sturgeon Falls | 0.183 |
| Sudbury | 0.110 |
| Sundridge | 0.157 |
| Tavistock | 0.108 |
| Temagami | 0.239 |
| Thamesford | 0.111 |
| Thedford | 0.089 |
| Thunder Bay | 0.061 |
| Tillsonburg | 0.126 |
| Timmins | 0.125 |
| Timmins (Porcupine) | 0.140 |
| Toronto Metropolitan Region | N/A |
| Etobicoke | 0.193 |
| North York | 0.195 |
| Scarborough | 0.219 |
| Toronto (City Hall) | 0.249 |
| Trenton | 0.167 |
| Trout Creek | 0.186 |
| Uxbridge | 0.139 |
| Vaughan (Woodbridge) | 0.167 |
| Vittoria | 0.139 |
| Walkerton | 0.083 |
| Wallaceburg | 0.098 |
| Waterloo | 0.118 |
| Watford | 0.095 |
| Wawa | 0.062 |
| Welland | 0.308 |
| West Lorne | 0.118 |
| Whitby | 0.203 |
| Whitby (Brooklin) | 0.176 |
| White River | 0.060 |
| Wiarton | 0.080 |
| Windsor | 0.096 |
| Wingham | 0.083 |
| Woodstock | 0.118 |
| Wyoming | 0.090 |
References
- Environment Canada, Climate Trends and Variation Bulletin: 2007, 2008.
- Intergovernmental Panel on Climate Change (IPCC), Climate Change 2007: The Physical Science Basis. Contribution of Working Group I to the Fourth Assessment Report of the Intergovernmental Panel on Climate Change. S. Solomon, D. Qin, M. Manning, Z. Chen, M. Marquis, K.B. Averyt, M. Tignor and H.L. Miller (Eds.) Cambridge University Press, Cambridge, United Kingdom and New York, NY, USA, 996 pp., 2007.
- American Society of Heating, Refrigerating, and Air-Conditioning Engineers, Handbook of Fundamentals, Chapter 14 – Climatic Design Information, Atlanta, GA. 2009.
- Lowery, M.D. and Nash, J.E., A comparison of methods of fitting the double exponential distribution. J. of Hydrology, 10 (3), pp. 259-275, 1970.
- Newark, M.J., Welsh, L.E., Morris, R.J. and Dnes, W.V. Revised Ground Snow Loads for the 1990 NBC of Canada. Can. J. Civ. Eng., Vol. 16, No. 3, June 1989.
- Newark, M.J. A New Look at Ground Snow Loads in Canada. Proceedings, 41st Eastern Snow Conference, Washington, D.C., Vol. 29, pp. 59-63, 1984.
- Bruce, J.P. and Clark, R.H. Introduction to Hydrometeorology. Pergammon Press, London, 1966.
- Skerlj, P.F. and Surry, D. A Critical Assessment of the DRWPs Used in CAN/CSA-A440-M90. Tenth International Conference on Wind Engineering, Wind Engineering into the 21st Century, Larsen, Larose & Livesay (eds), 1999 Balkema, Rotterdam, ISBN 90 5809 059 0.
- Cornick, S., Chown, G.A., et al. Committee Paper on Defining Climate Regions as a Basis for Specifying Requirements for Precipitation Protection for Walls. Institute for Research in Construction, National Research Council, Ottawa, April 2001.
- Boyd, D.W. Variations in Air Density over Canada. National Research Council of Canada, Division of Building Research, Technical Note No. 486, June 1967.
- Adams, J., Allen, T., Halchuk, S., and Kolaj, M. Canada's 6th Generation Seismic Hazard Model, as Prepared for the 2020 National Building Code. 12th Canadian Conference on Earthquake Engineering, Québec, QC, paper 192-Mkvp-139, 2019.
- Atkinson, G.M. and Adams, J. Ground motion prediction equations for application to the 2015 Canadian national seismic hazard maps, Can. J. Civ. Eng. 40, 988-998, 2013.
- Kolaj, M., Allen, T., Mayfield, R., Adams, J., and Halchuk, S. Ground-Motion Models for the 6th Generation Seismic Hazard Model of Canada. 12th Canadian Conference on Earthquake Engineering, Québec, QC, paper 192-hHtH-159, 2019.