

SB-6 — Percolation Time and Soil Descriptions
Estimation of Percolation Time
- The purpose of this Section and the associated Tables and Charts is to provide assistance to those who must decide on the percolation time(s) to be used in design. Suggested relationships between percolation time, coefficient of permeability and soils of various types are given. it must be emphasized that, particularly for fine grained soils, there is no consistent relationship due to the many factors involved. The following guidance is presented for the soil types outlined in the Unified Soil Classification System (Table 1). In order to assess a particular soil.
- Table 2 and Table 3 - Approximate relationship of soil types to permeability and percolation time.
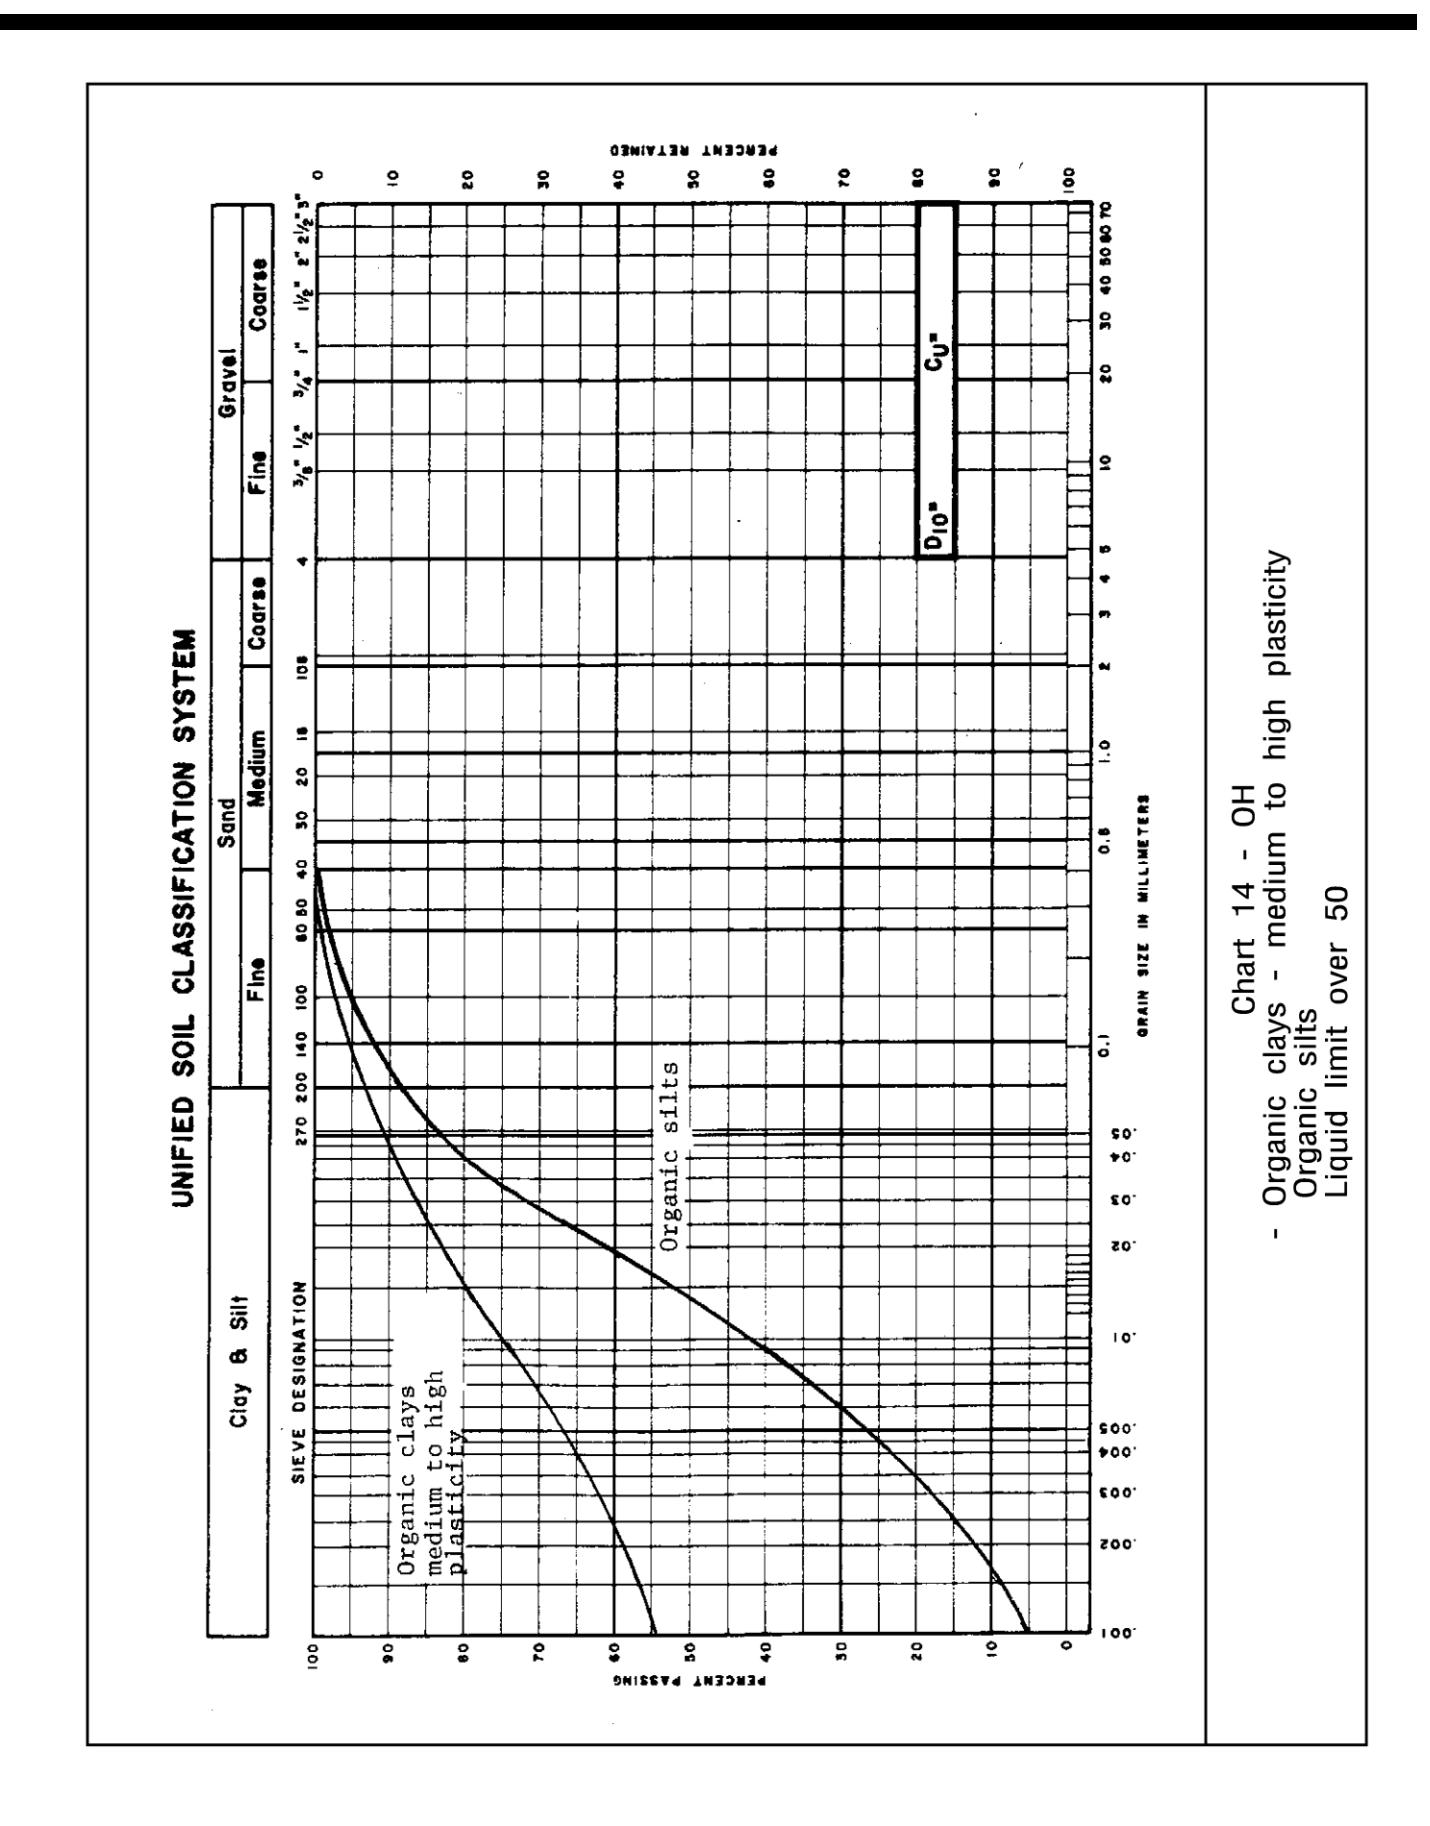
- Charts 1 to 14 - Typical grain size distribution curves for soil types in the Unified Soil Classification System.
- In Table 2 and Table 3, a range of values of “K” and of “T” are given for various soil descriptions. The principal modifiers which will influence selection of a “T” value within the range given are:
- The structure - “massive” fine-grained soils have high values of “T”.
- The density - For a given soil higher density produces a higher value of “T”.
- The percentage of clay - the higher the percentage the higher the value of “T”.
- The mineralogy of the clay portion - The more it “swells” the higher the value of “T”.
- The plasticity of the soil - The higher the plasticity index the higher the value of “T”.
- Liquid Limit - the higher the liquid limit the higher the value of “T”.
- Organic content - The presence of fine organic particles, detectable by colouration and odour, can significantly reduce the permeability and raise the value of “T”.
Table 1 — Unified Soil Classification
| Group Symbols | Typical Names |
|---|---|
| GW | Well-graded gravels, gravel-sand mixtures, little or no fines |
| GP | Poorly-graded gravels, gravel-sand mixtures, little or no fines |
| GM | Silty gravels, gravel-sand-silt mixtures |
| GC | Clayey gravels, gravel-sand-clay mixtures |
| SW | Well-graded sands, gravelly sands, little or no fines |
| SP | Poorly-graded sands, gravelly sands, little or no fines |
| SM | Silty sands, sand-silt mixtures |
| SC | Clayey sands, sand-clay mixtures |
| Column 1 | 2 |
| Group Symbols | Typical Names |
|---|---|
| ML | Inorganic silts and very fine sands, rock flour, silty or clayey fine sands or clayey silts with slight plasticity |
| CL | Inorganic clays of low to medium plasticity, gravelly clays, sandy clays, silty clays, lean clays |
| OL | Organic silts and organic silty clays of low plasticity |
| MH | Inorganic silts, micoceous or diatomaceous fine sandy or silty soils, elastic silts |
| CH | Inorganic clays of high plasticity, fat clays |
| OH | Organic clays of medium to high plasticity, organic silts |
| PT (highly organic soils) | Peat and other highly organic soils |
| Column 1 | 2 |
Table 2 — Approximate Relationship of Coarse Grained Soil Types to Permeability and Percolation Time
| Soil Type (Unified Soil Classification): Coarse Grained, More than 50% Larger than #200 | Coefficient of Permeability, K — cm/sec | Percolation Time, T — mins/cm | Comment |
|---|---|---|---|
| G.W. — Well graded gravels, gravel-sand mixtures, little or no fines. | 10−1 | <1 | very permeable unacceptable |
| G.P. — Poorly graded gravels, gravel-sand mixtures, little or no fines. | 10−1 | <1 | very permeable unacceptable |
| G.M. — Silty gravels, gravel-sand-silt mixtures. | 10−2–10−4 | 4–12 | Permeable to medium permeable depending on amount of silt. |
| G.C. — Clayey gravels, gravel-sand-clay mixtures. | 10−4–10−6 | 12–50 | Important to estimate amount of silt and clay |
| S.W. — Well graded sands, gravelly sands, little or no fines. | 10−1–10−4 | 2–12 | medium permeability |
| S.P. — Poorly graded sands, gravelly sand, little or no fines. | 10−1–10−3 | 2–8 | medium permeability |
| S.M. — Silty sands, sand-silt mixtures. | 10−3–10−5 | 8–20 | medium to low permeability |
| S.C. — Clayey sands, sand-clay mixtures. | 10−4–10−6 | 12–50 | medium to low permeability depending on amount of clay |
| Column 1 | 2 | 3 | 4 |
Table 3 — Approximate Relationship of Fine Grained Soil Types to Permeability and Percolation Time
| Soil Type (Unified Soil Classification): Fine Grained, More than 50% Passing #200 | Coefficient of Permeability, K — cm/sec | Percolation Time, T — mins/cm | Comment |
|---|---|---|---|
| M.L. — Inorganic silts and very fine sands, rock flour, silty or clayey fine sands, clayey silts with slight plasticity | 10−5–10−6 | 20–50 | medium to low permeability |
| C.L. — Inorganic clays of low to medium plasticity, gravelly clays, sandy clays, silty clays, lean clays | 10−6 and less | over 50 | unacceptable |
| O.L. — Organic silts, organic silty clays of low plasticity; liquid limit less than 50 | 10−5 and less | 20–over 50 | acceptable depends on clay content |
| M.H. — Inorganic silts, micareaous or diatomageous fine sandy or silty soils, elastic silts | 10−6 and less | over 50 | unacceptable |
| C.H. — Inorganic clays of medium to high plasticity, organic silts | 10−7 and less | over 50 | unacceptable |
| O.H. — Organic clays of medium to high plasticity, organic silt; liquid limit over 50 | 10−6 and less | over 50 | unacceptable |
| Column 1 | 2 | 3 | 4 |
Selection of "T" Time From The Above Tabulation
A range of “T” times for each soil type is shown above. Select from within this range by determining if the soil is within the low, middle or high part of the range considering the soil identifiers and soil characteristics. Consider structure, density, colour, prevalence or organics, the clay content and mineralogy, the plasticity index and liquid limit and the functioning of existing systems in similar soils in the area.
Notes:
The following Ministry of the Environment Reports provide further information on the relationship between grain size, coefficient of permeability and percolation time.
- Study on the Feasibility of Correlating Percolation Time with Laboratory Permeability - 1975 - Research Report No. S56 by H. T. Chan, PhD., P.Eng.
- Study of Conventional Tile Fields in Fine-Grained Soils - 1979 Research Report 74 by H. T. Chan, PhD., P.Eng.
Chart 1 — GW: Well-graded gravels, gravel-sand mixtures
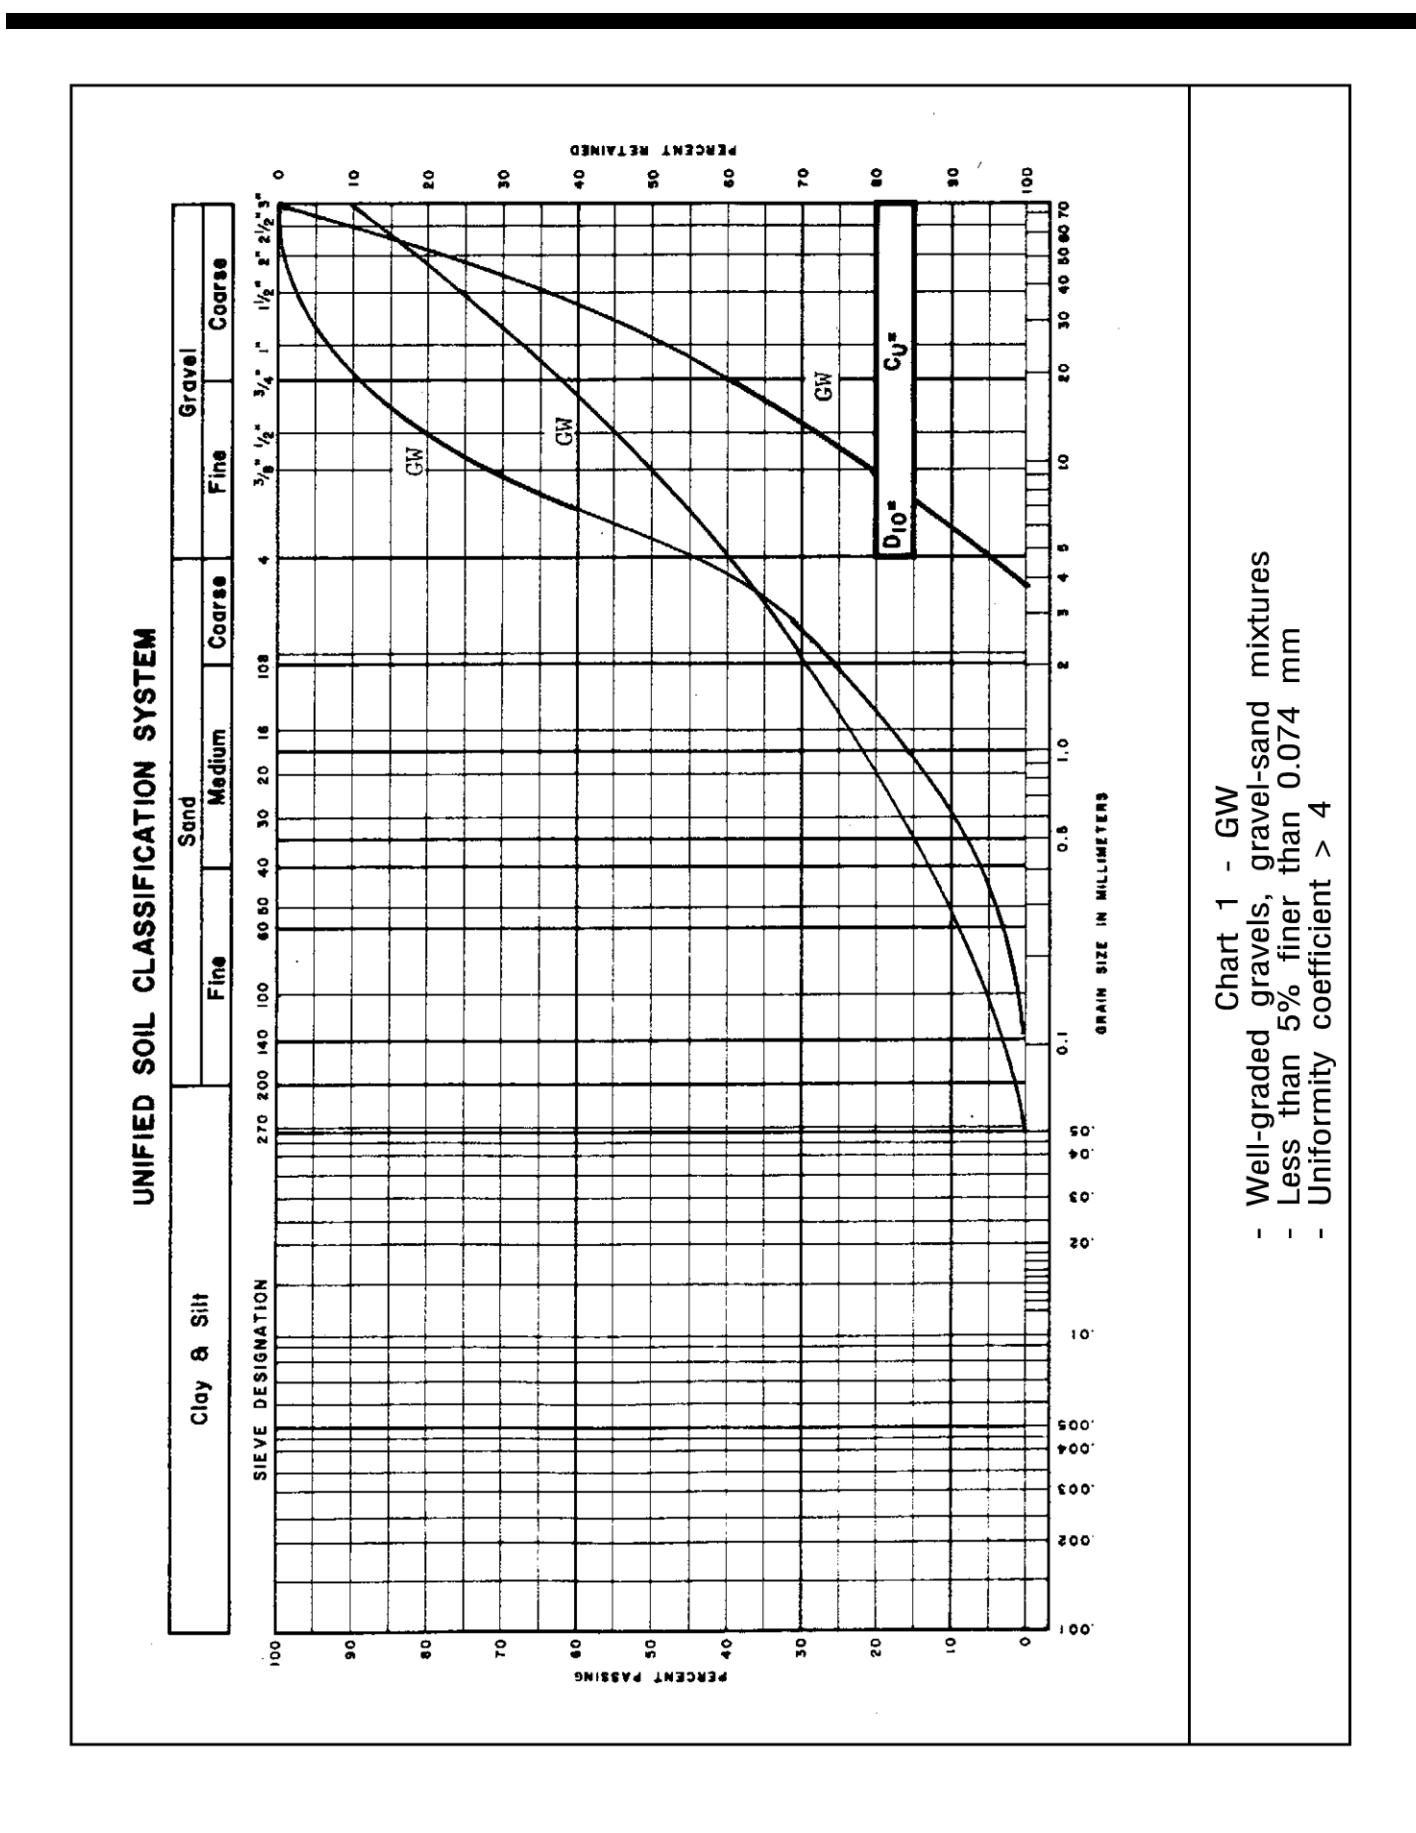
Chart 2 — GP: Poorly-graded gravels, gravel-sand mixtures
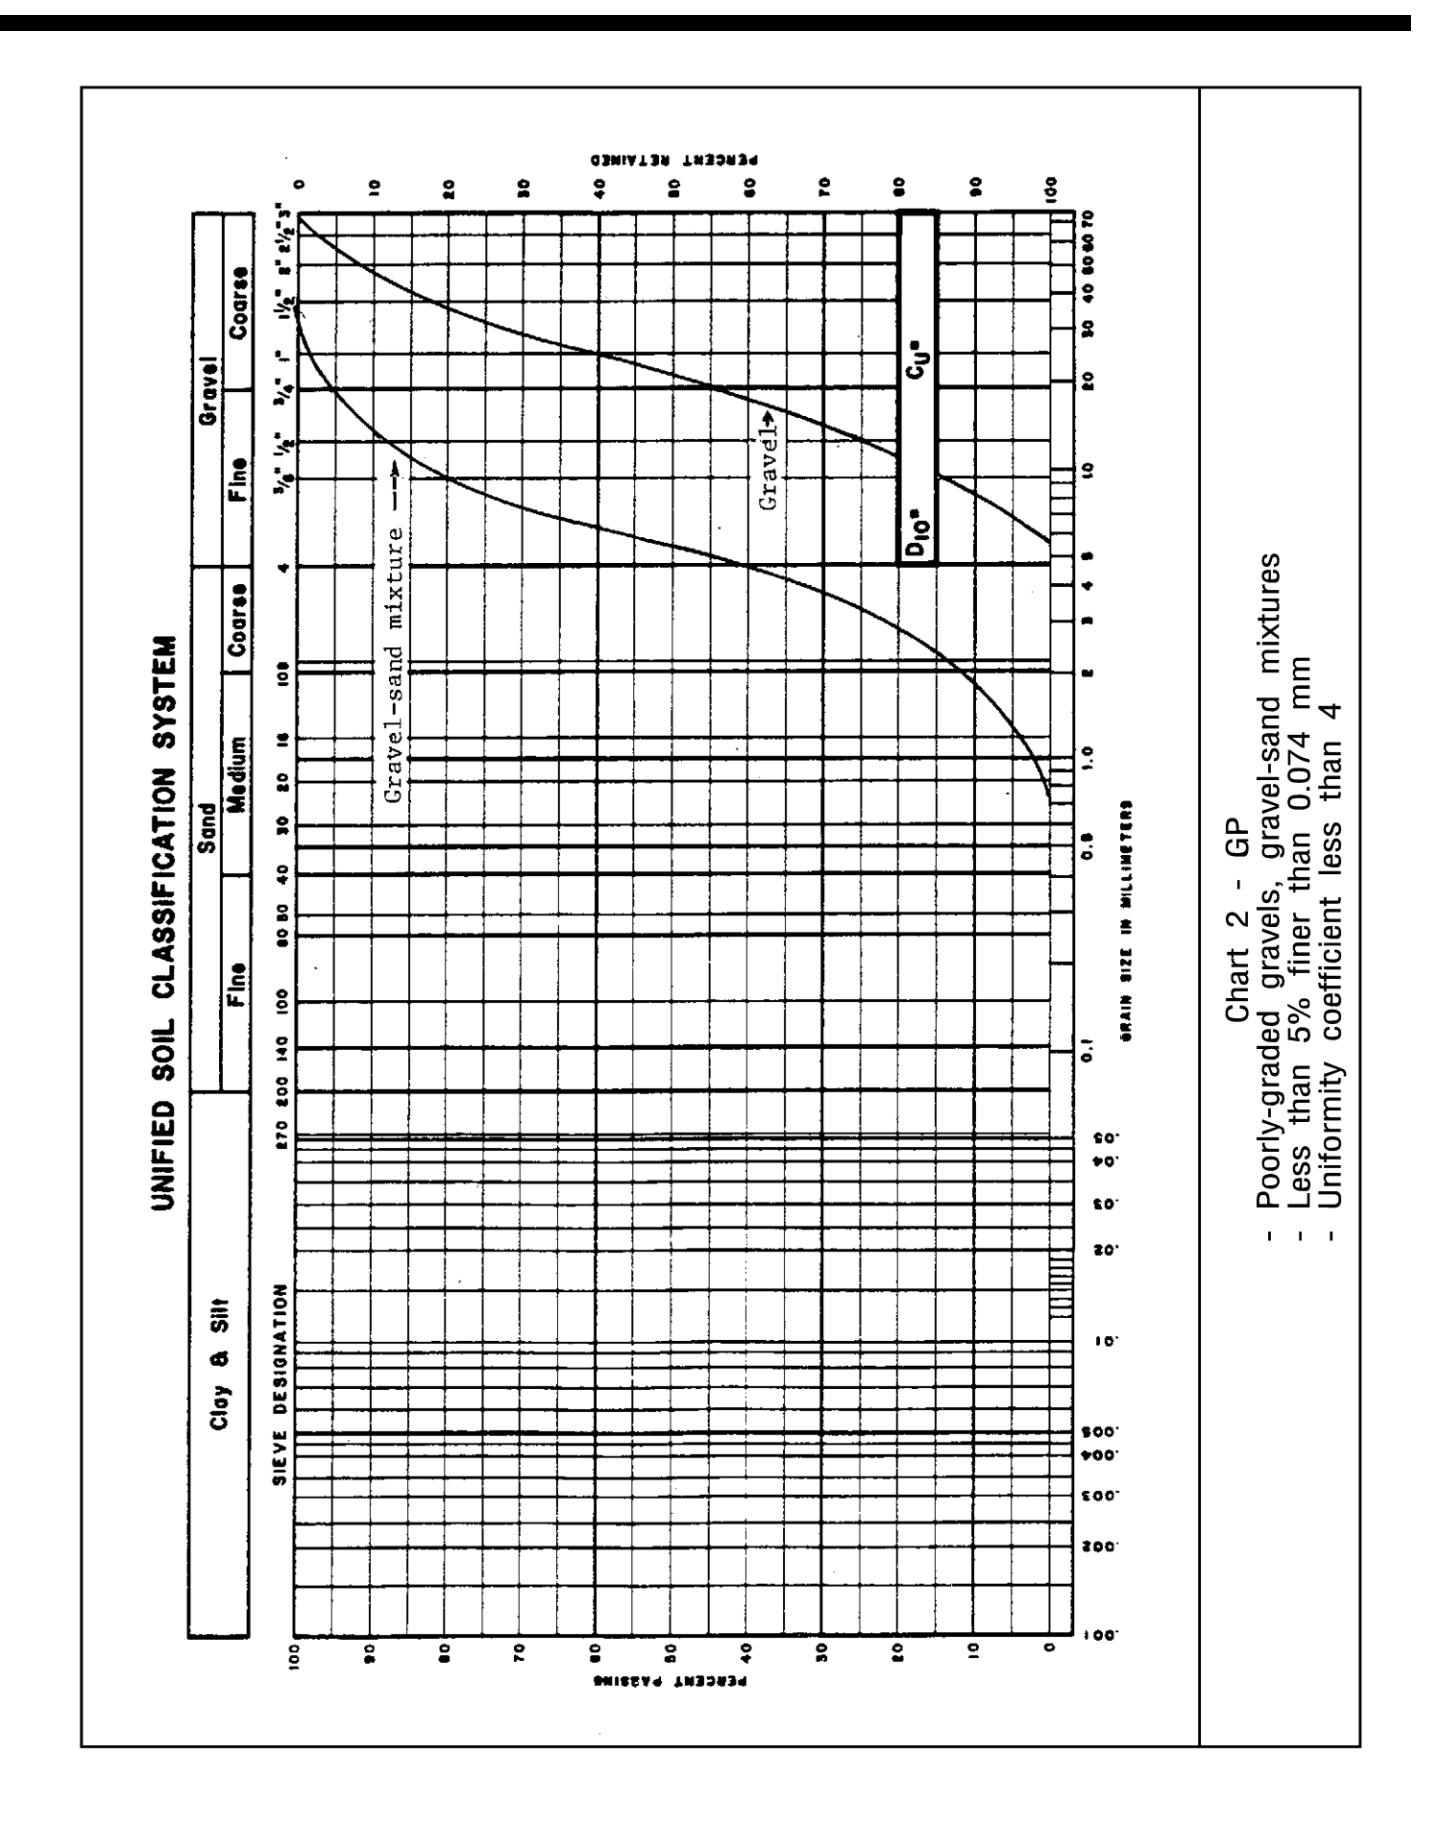
Chart 3 — GM: Silty gravels, gravel-sand-silt mixtures
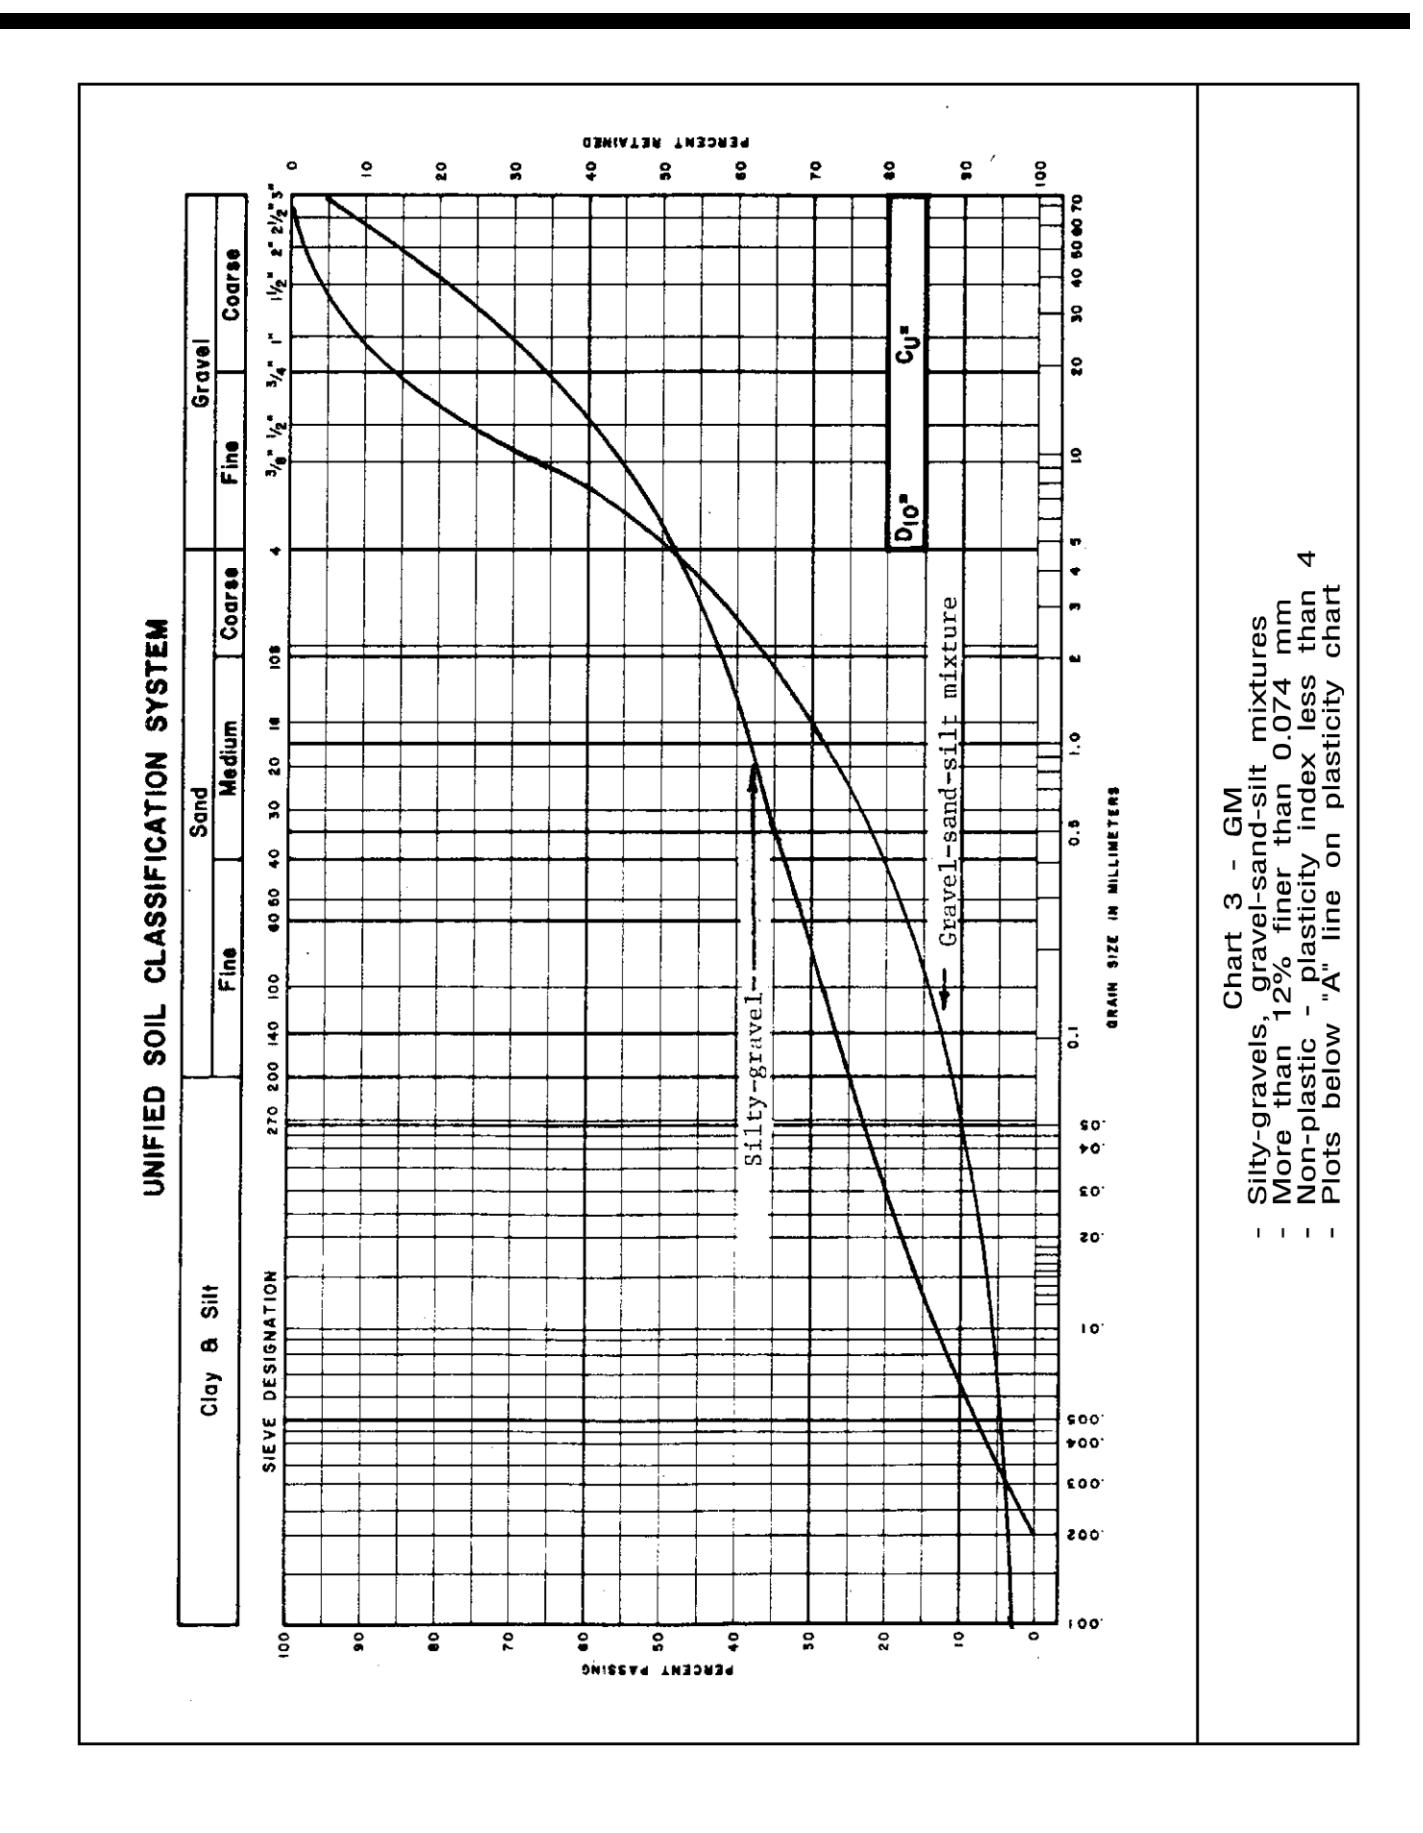
Chart 4 — GC: Clayey gravels, gravel-sand-clay mixtures
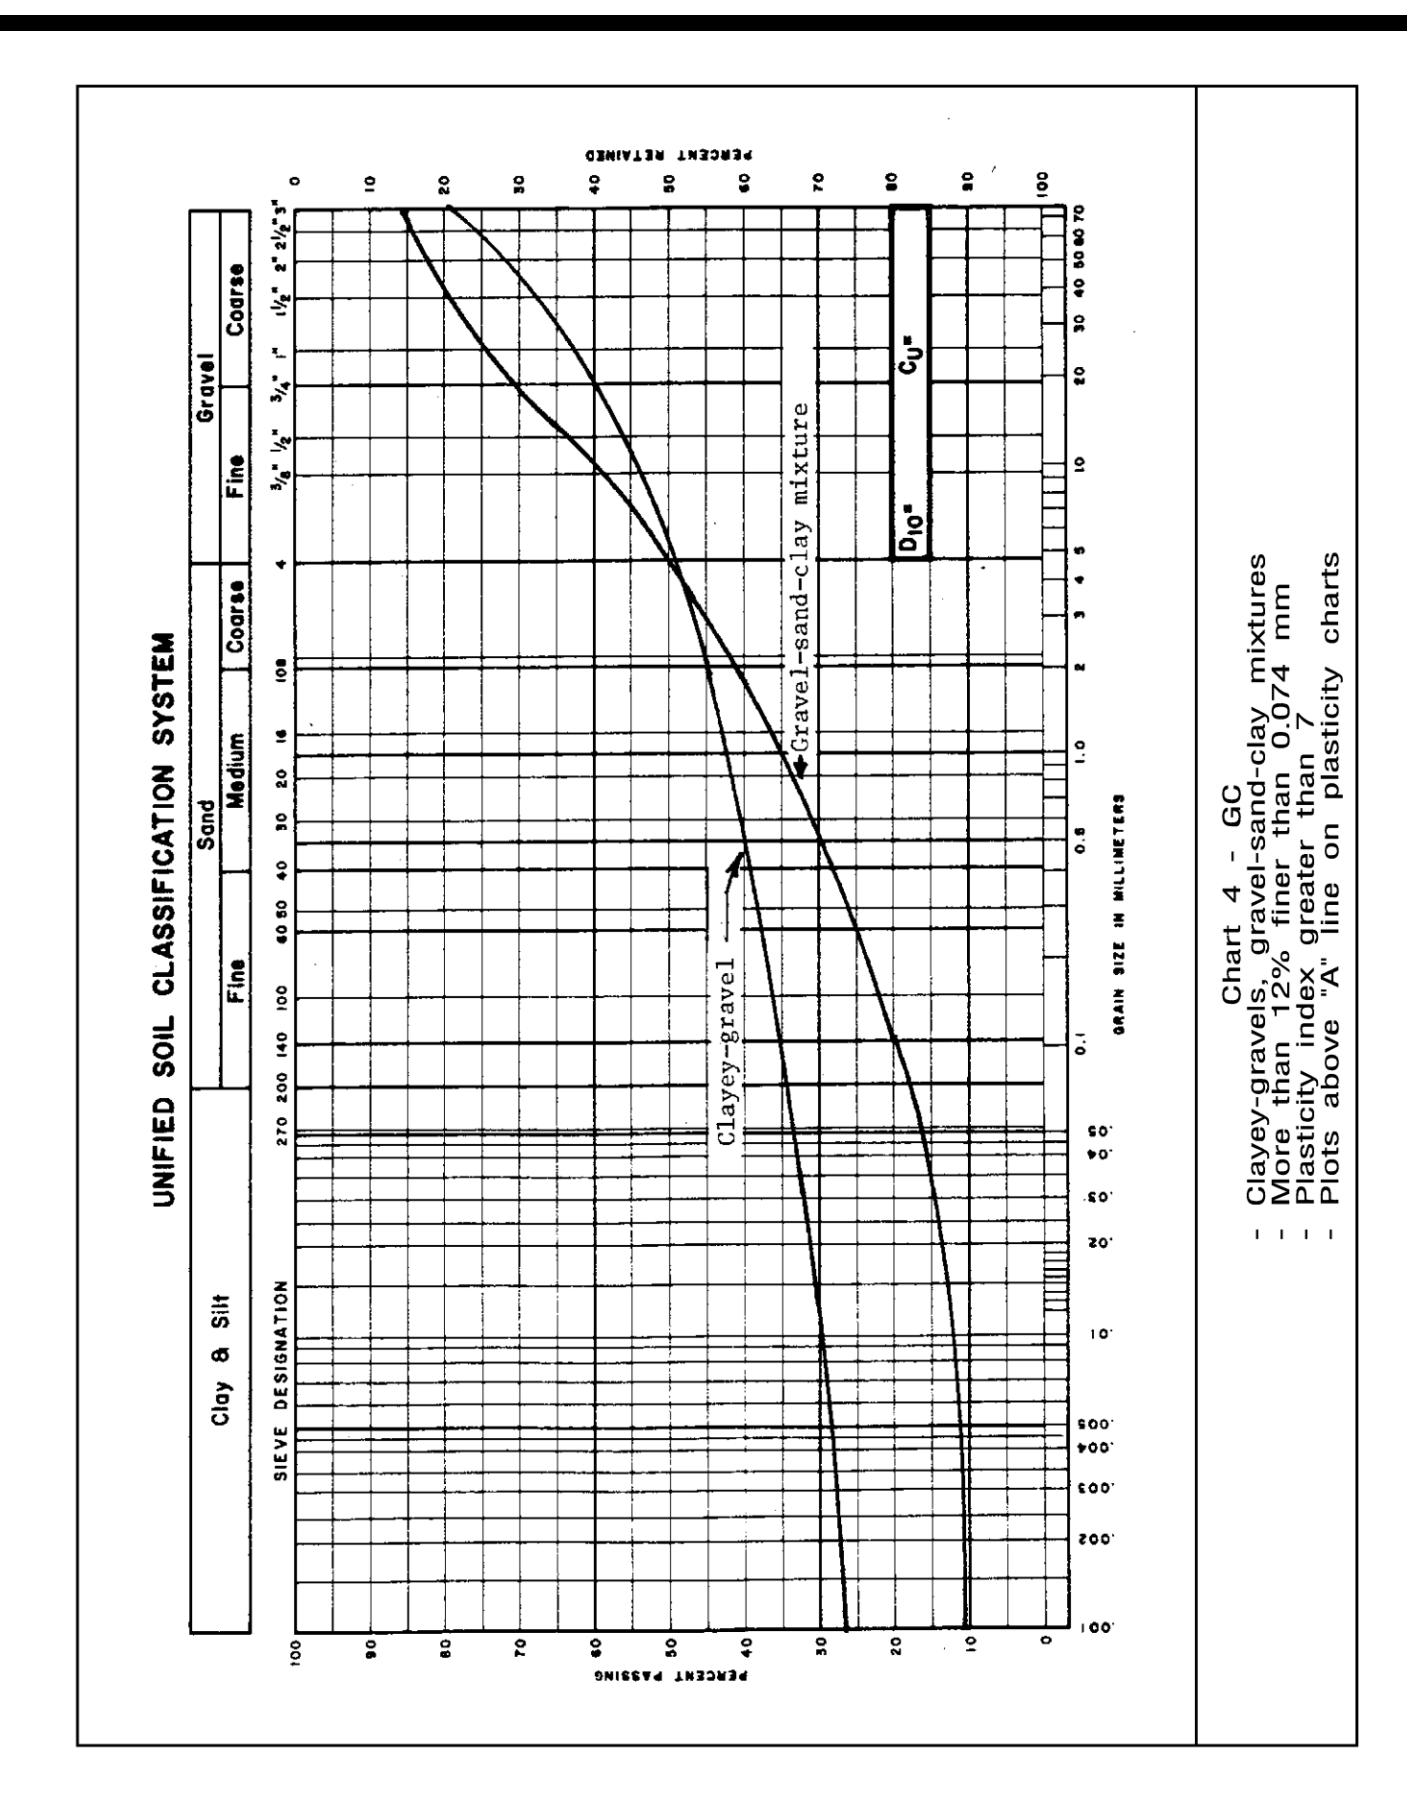
Chart 5 — SW: Well-graded sands, gravelly sands
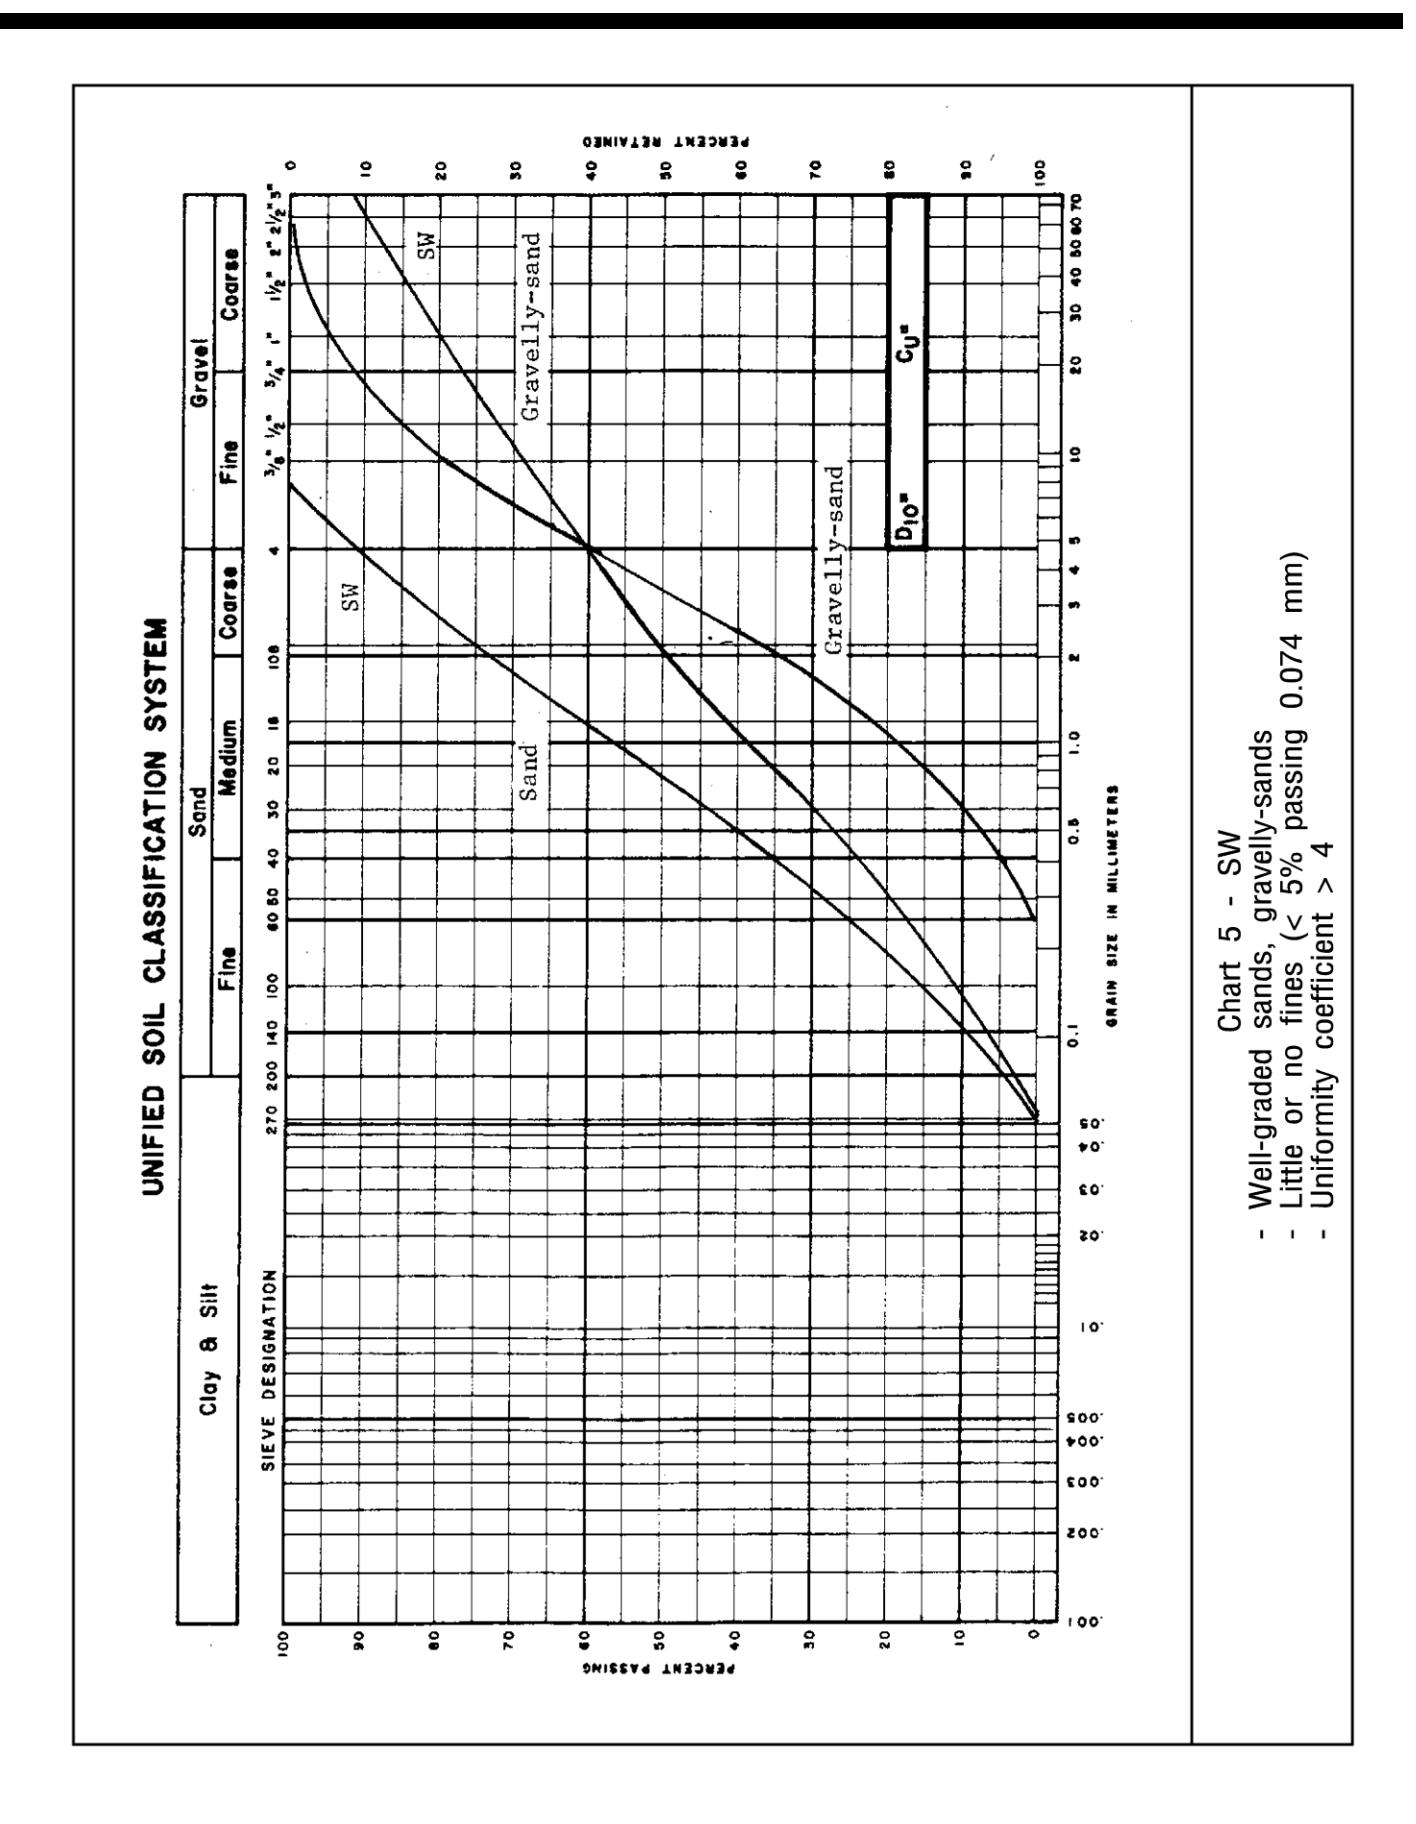
Chart 6 — SP: Poorly-graded sands, gravelly sands
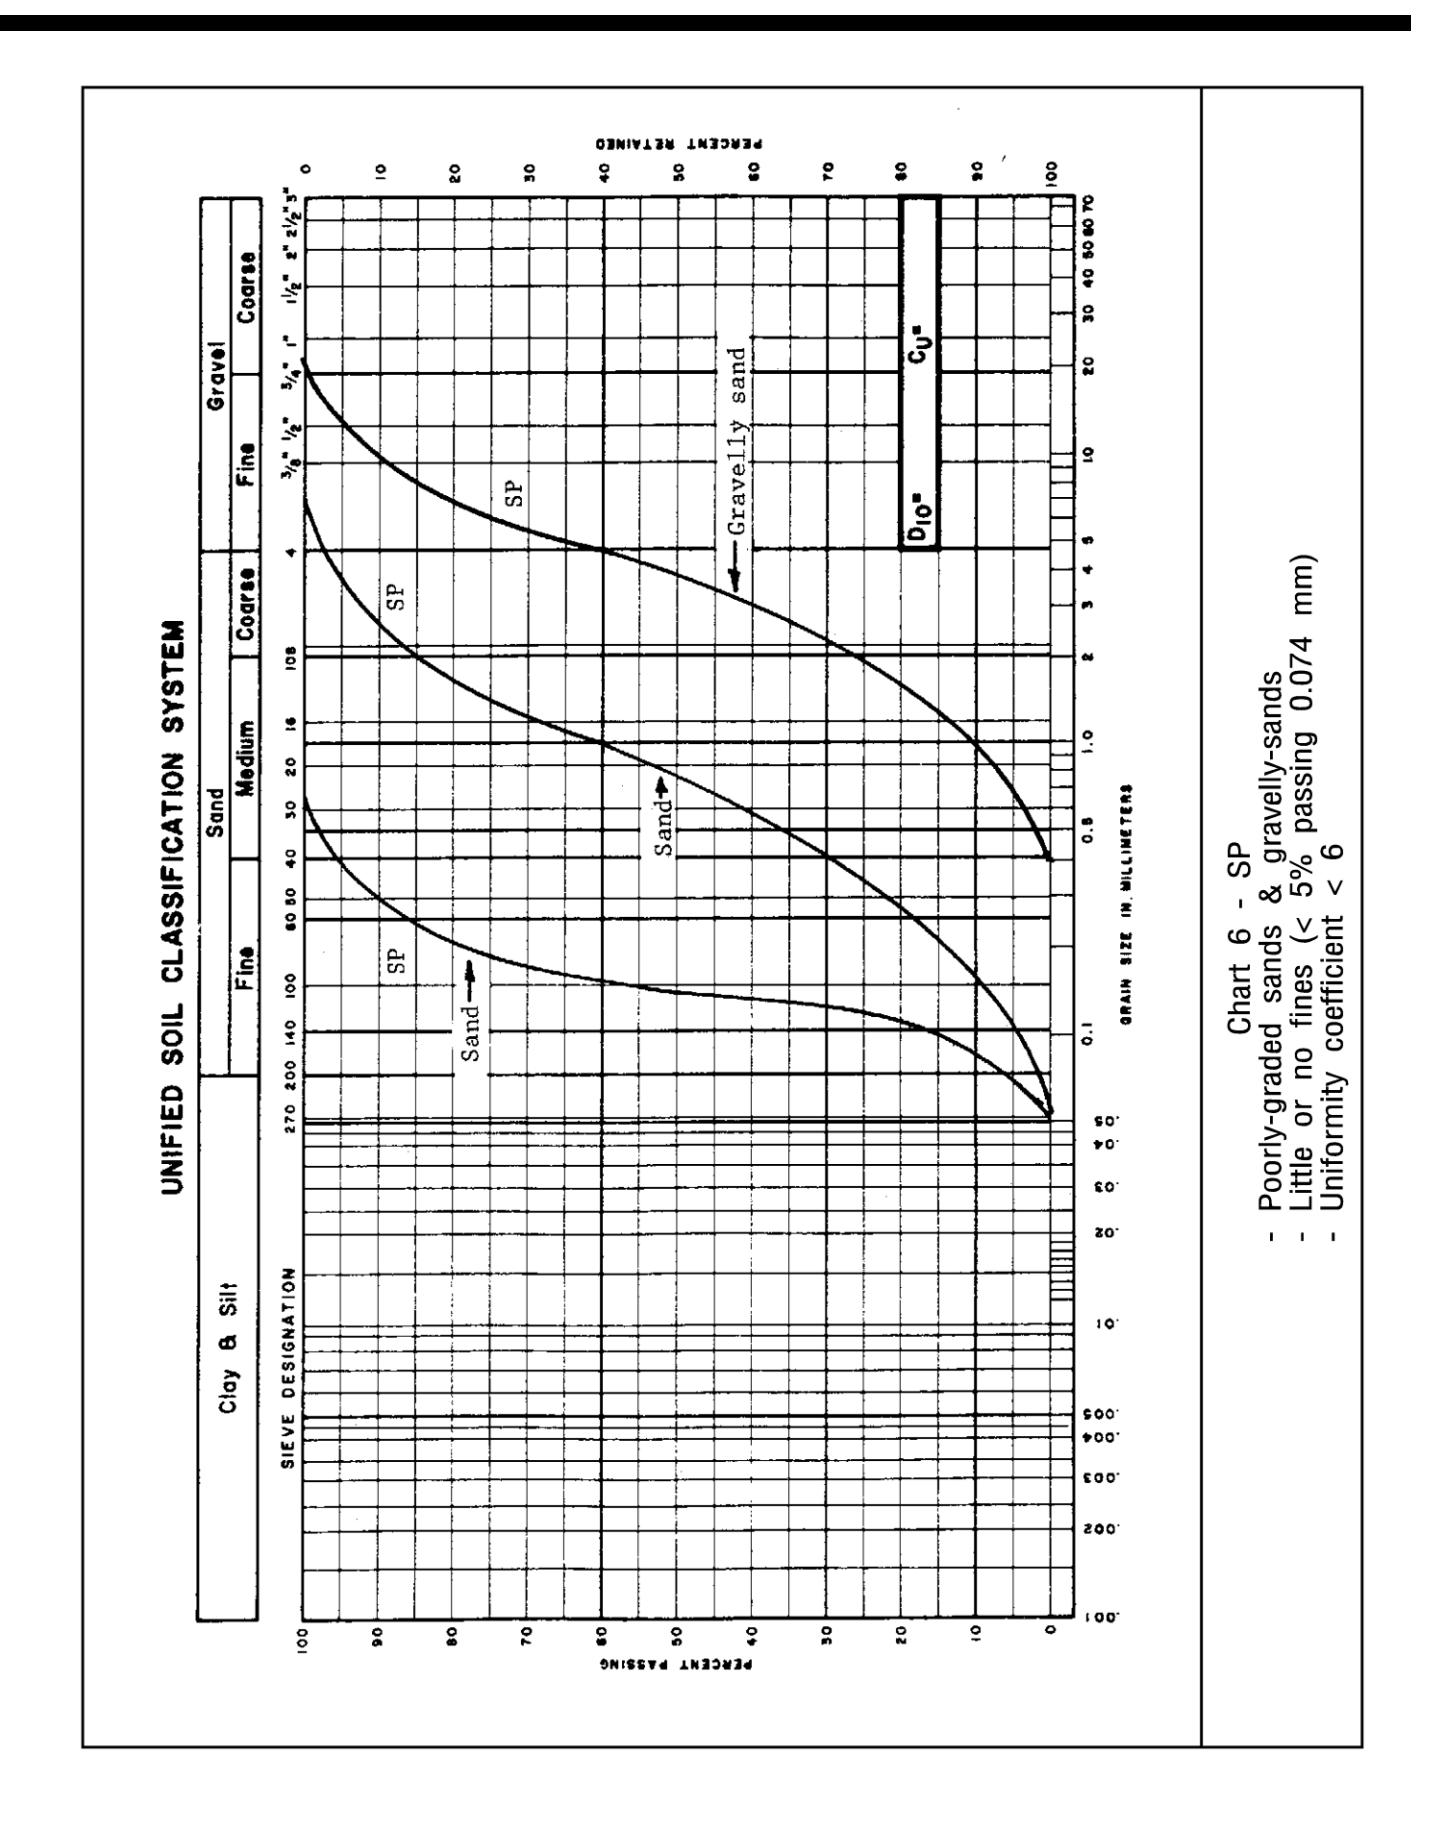
Chart 7 — SM: Silty sands, sand-silt mixtures
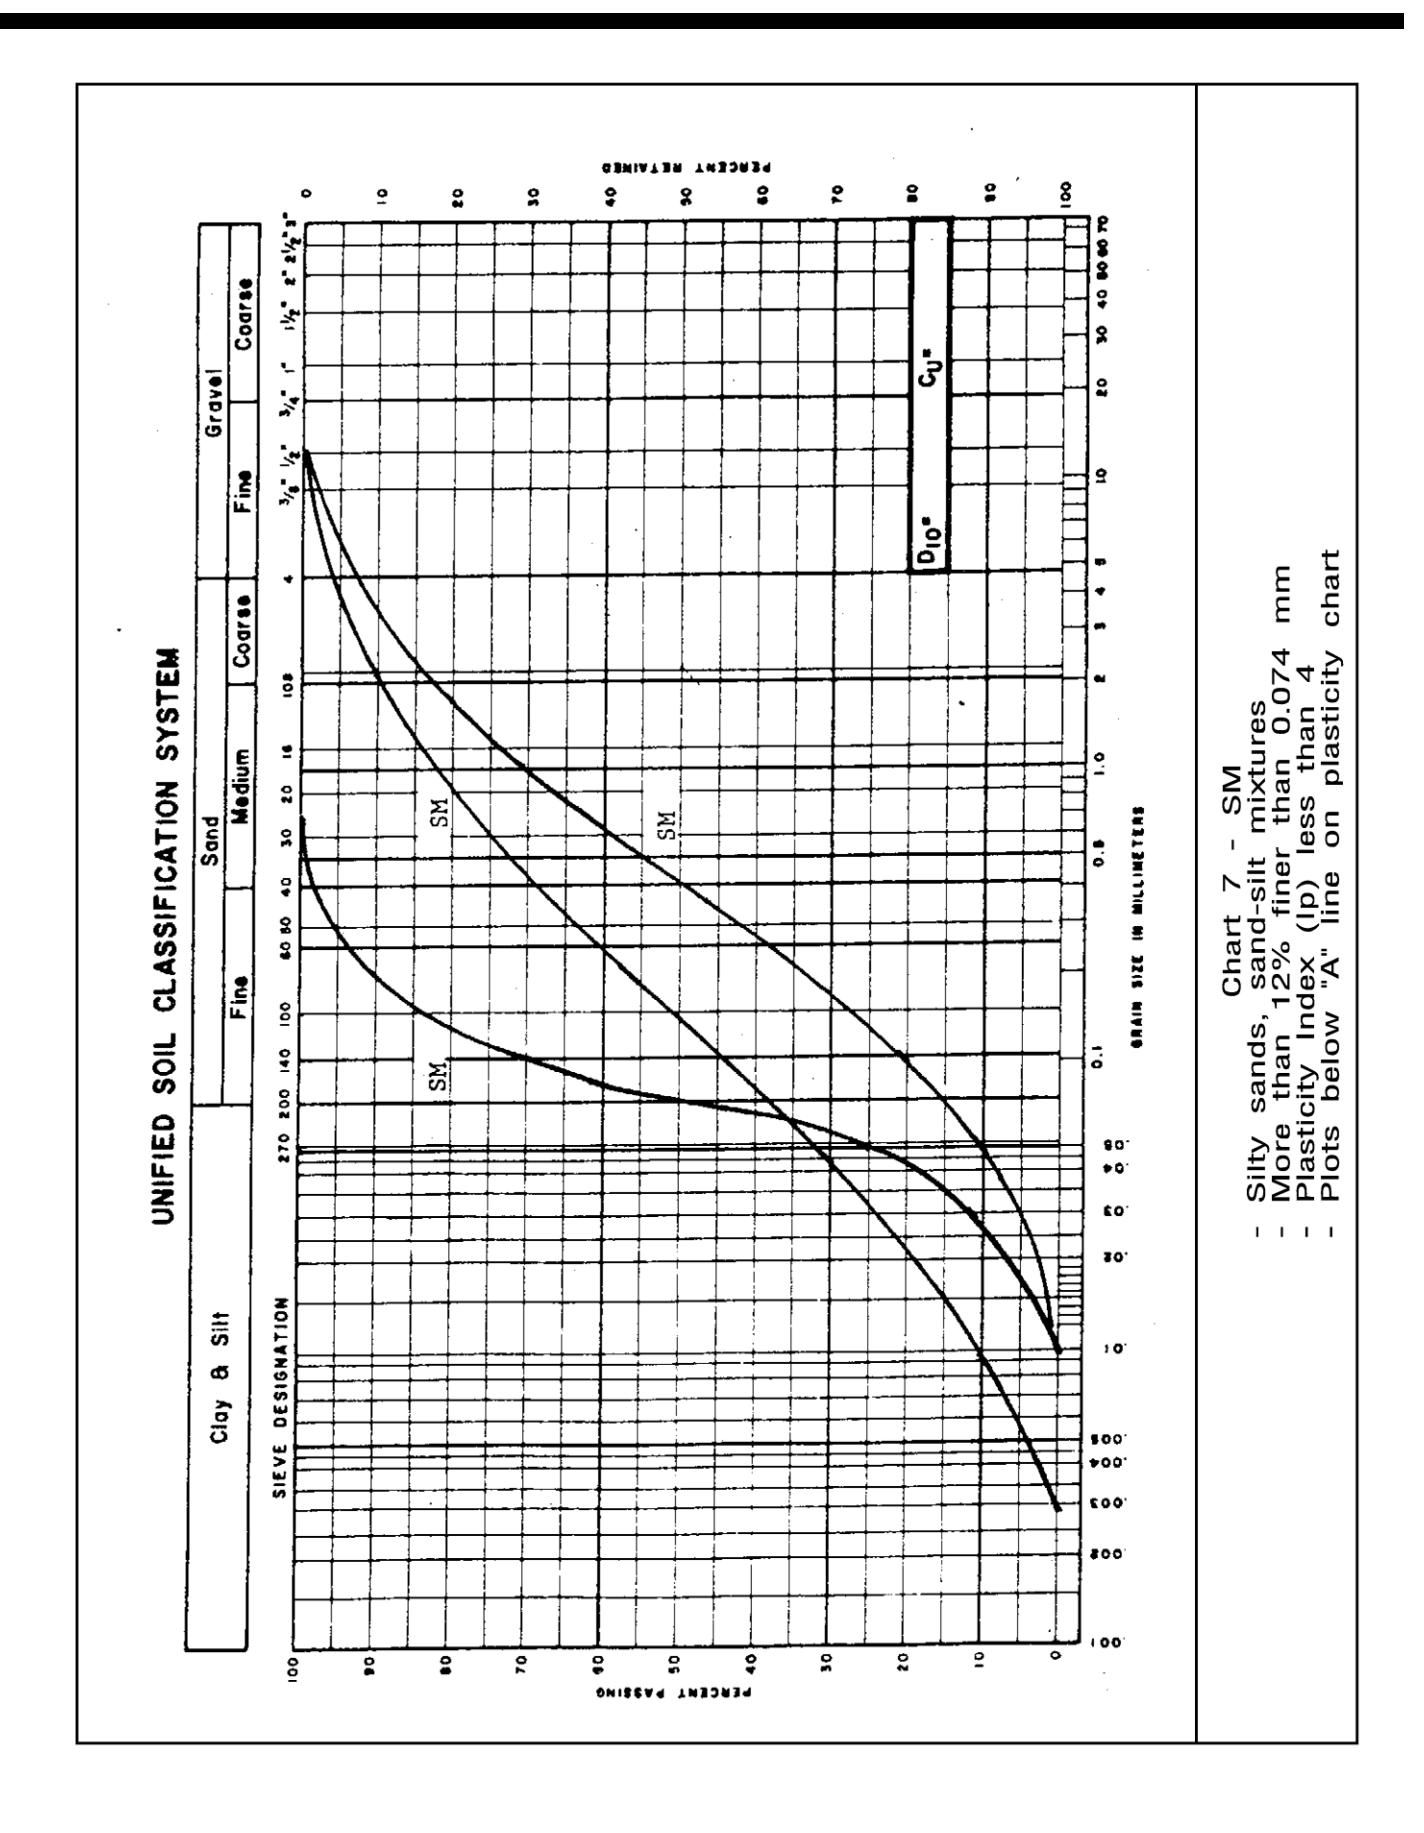
Chart 8 — SC: Clayey sands, sand-clay mixtures
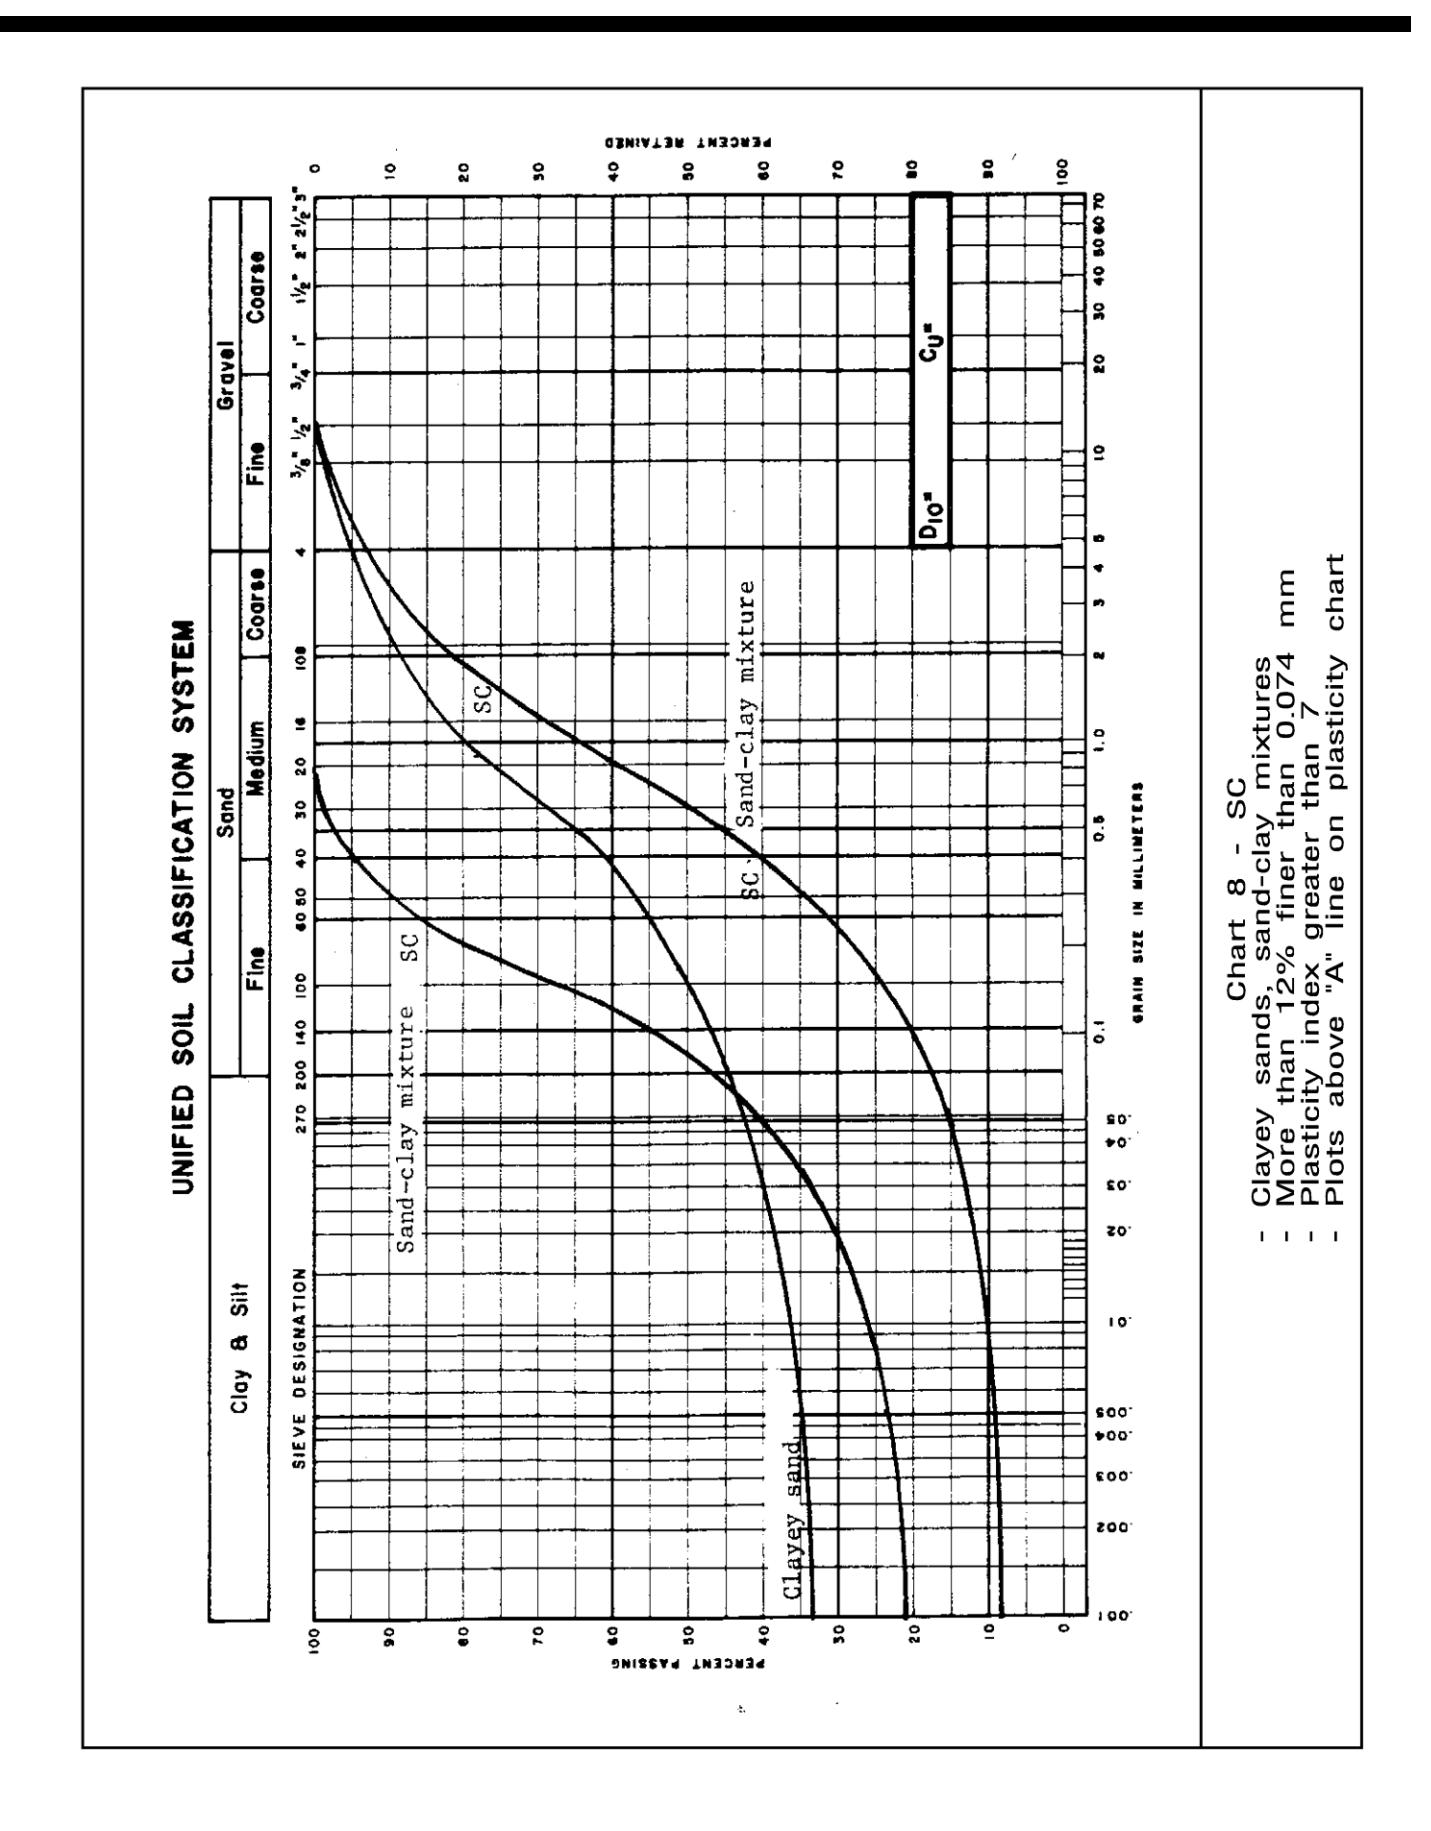
Chart 9 — ML: Inorganic silts and very fine sands, rock flour, silty or clayey fine sands or clayey silts with slight plasticity
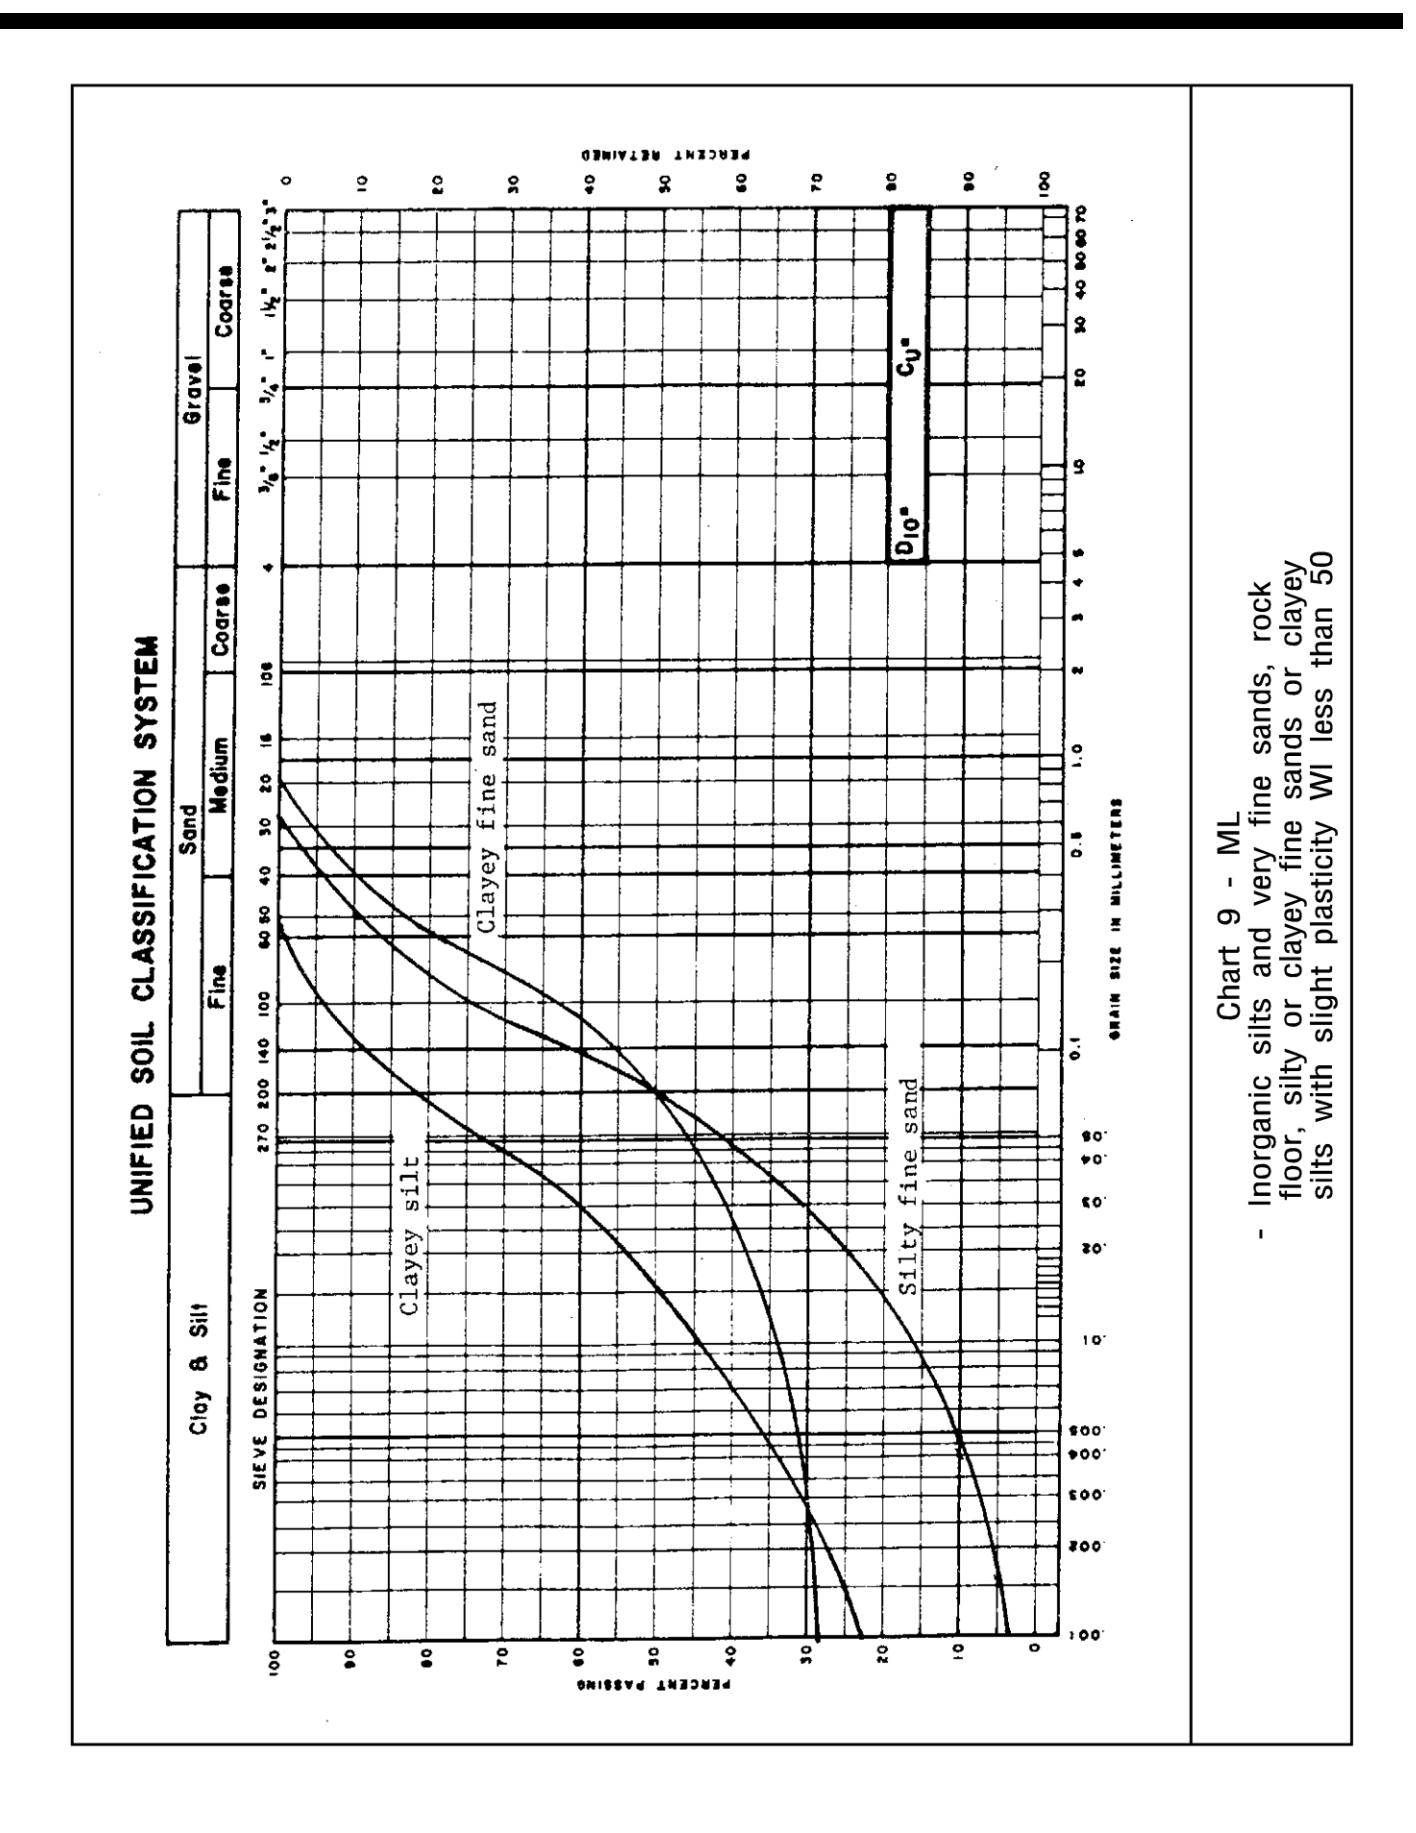
Chart 10 — CL: Inorganic clays of low to medium plasticity, gravelly clays, sandy clays, silty clays, lean clays
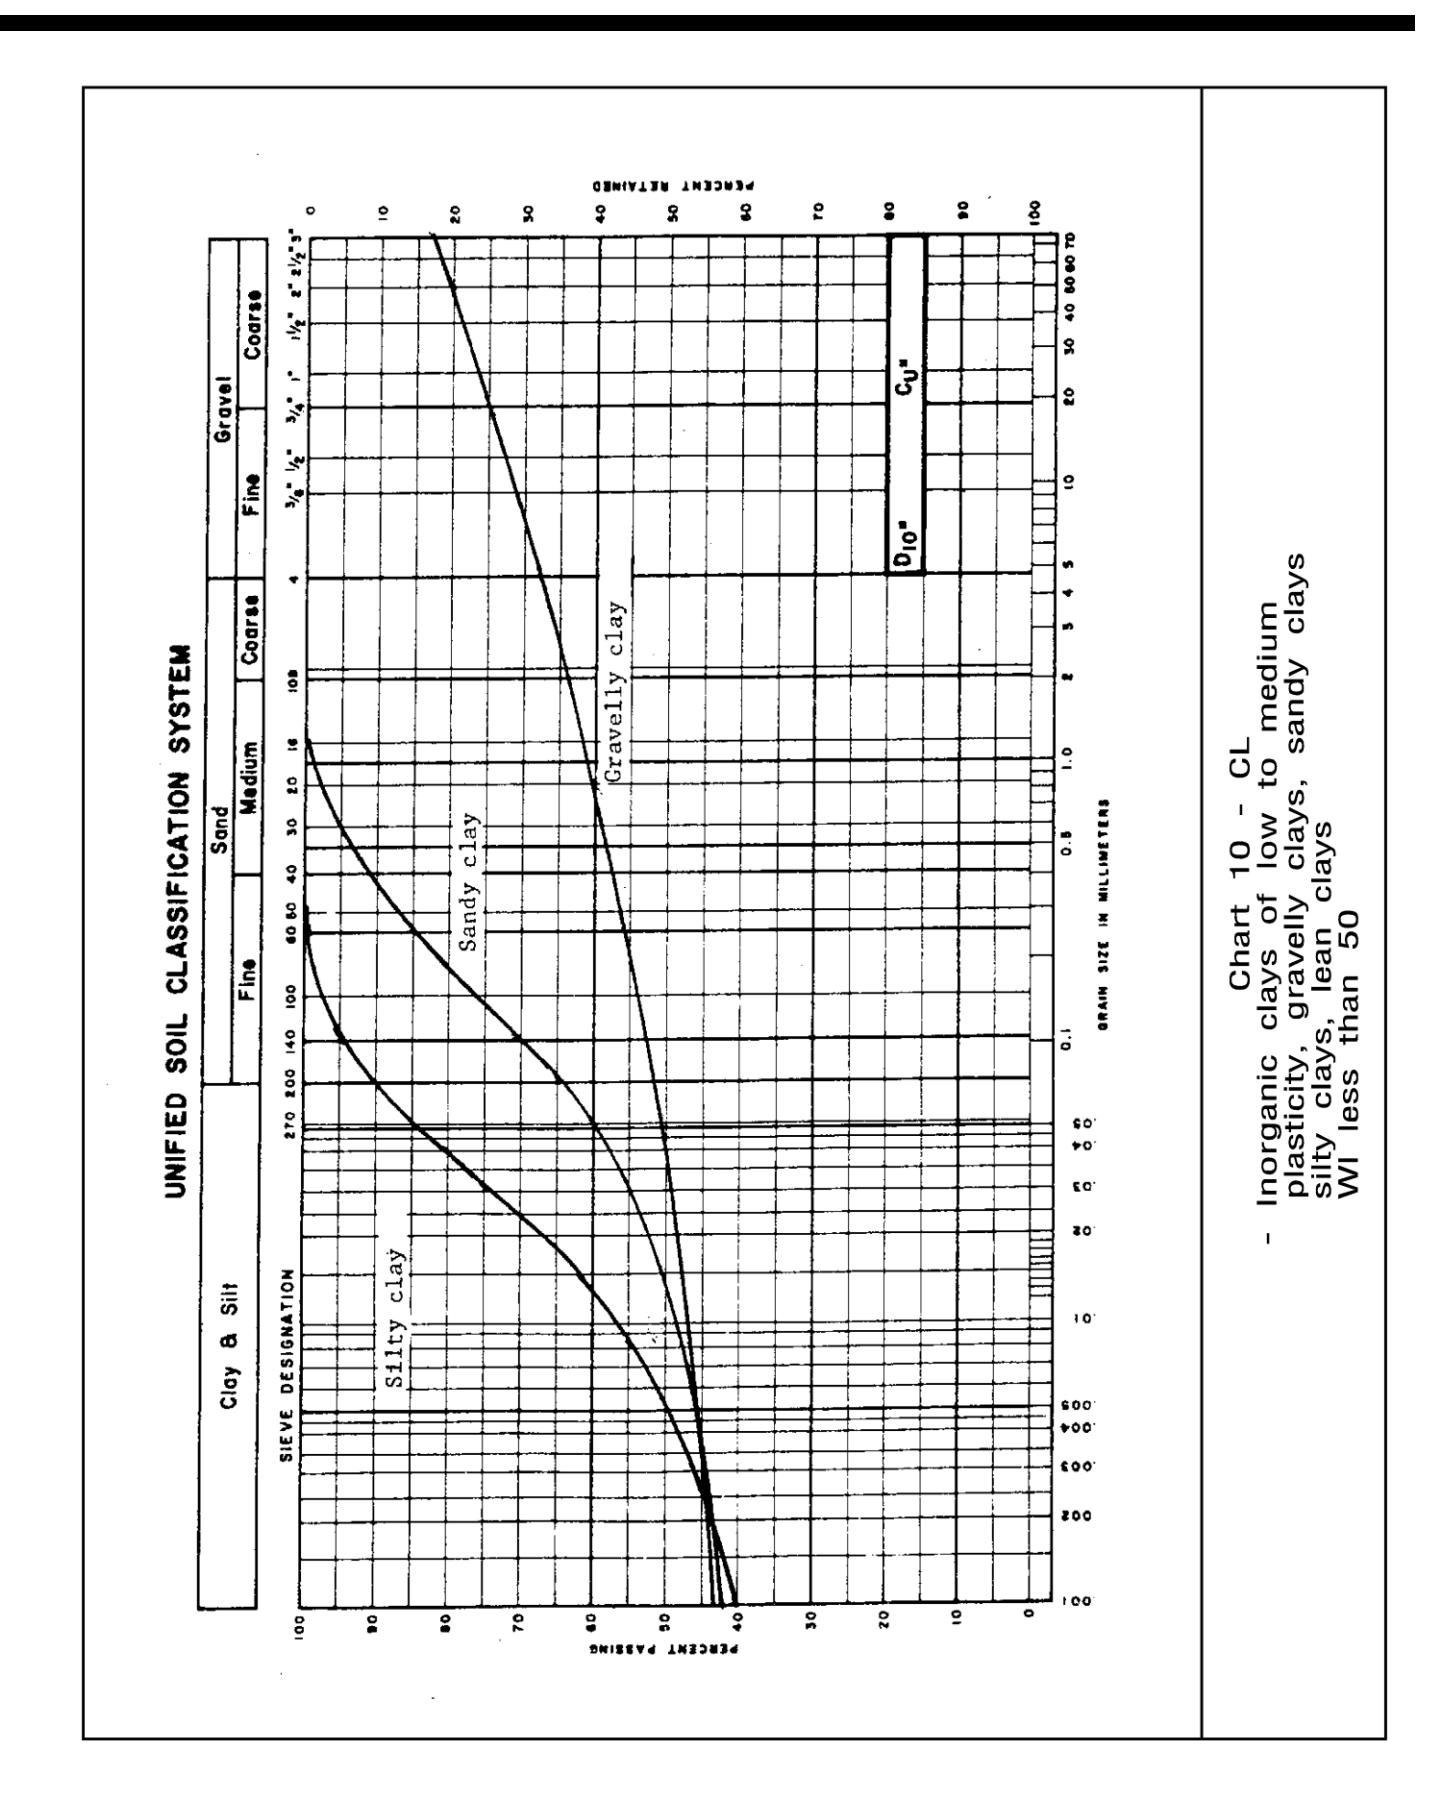
Chart 11 — OL: Organic silts, organic silty clays of low plasticity
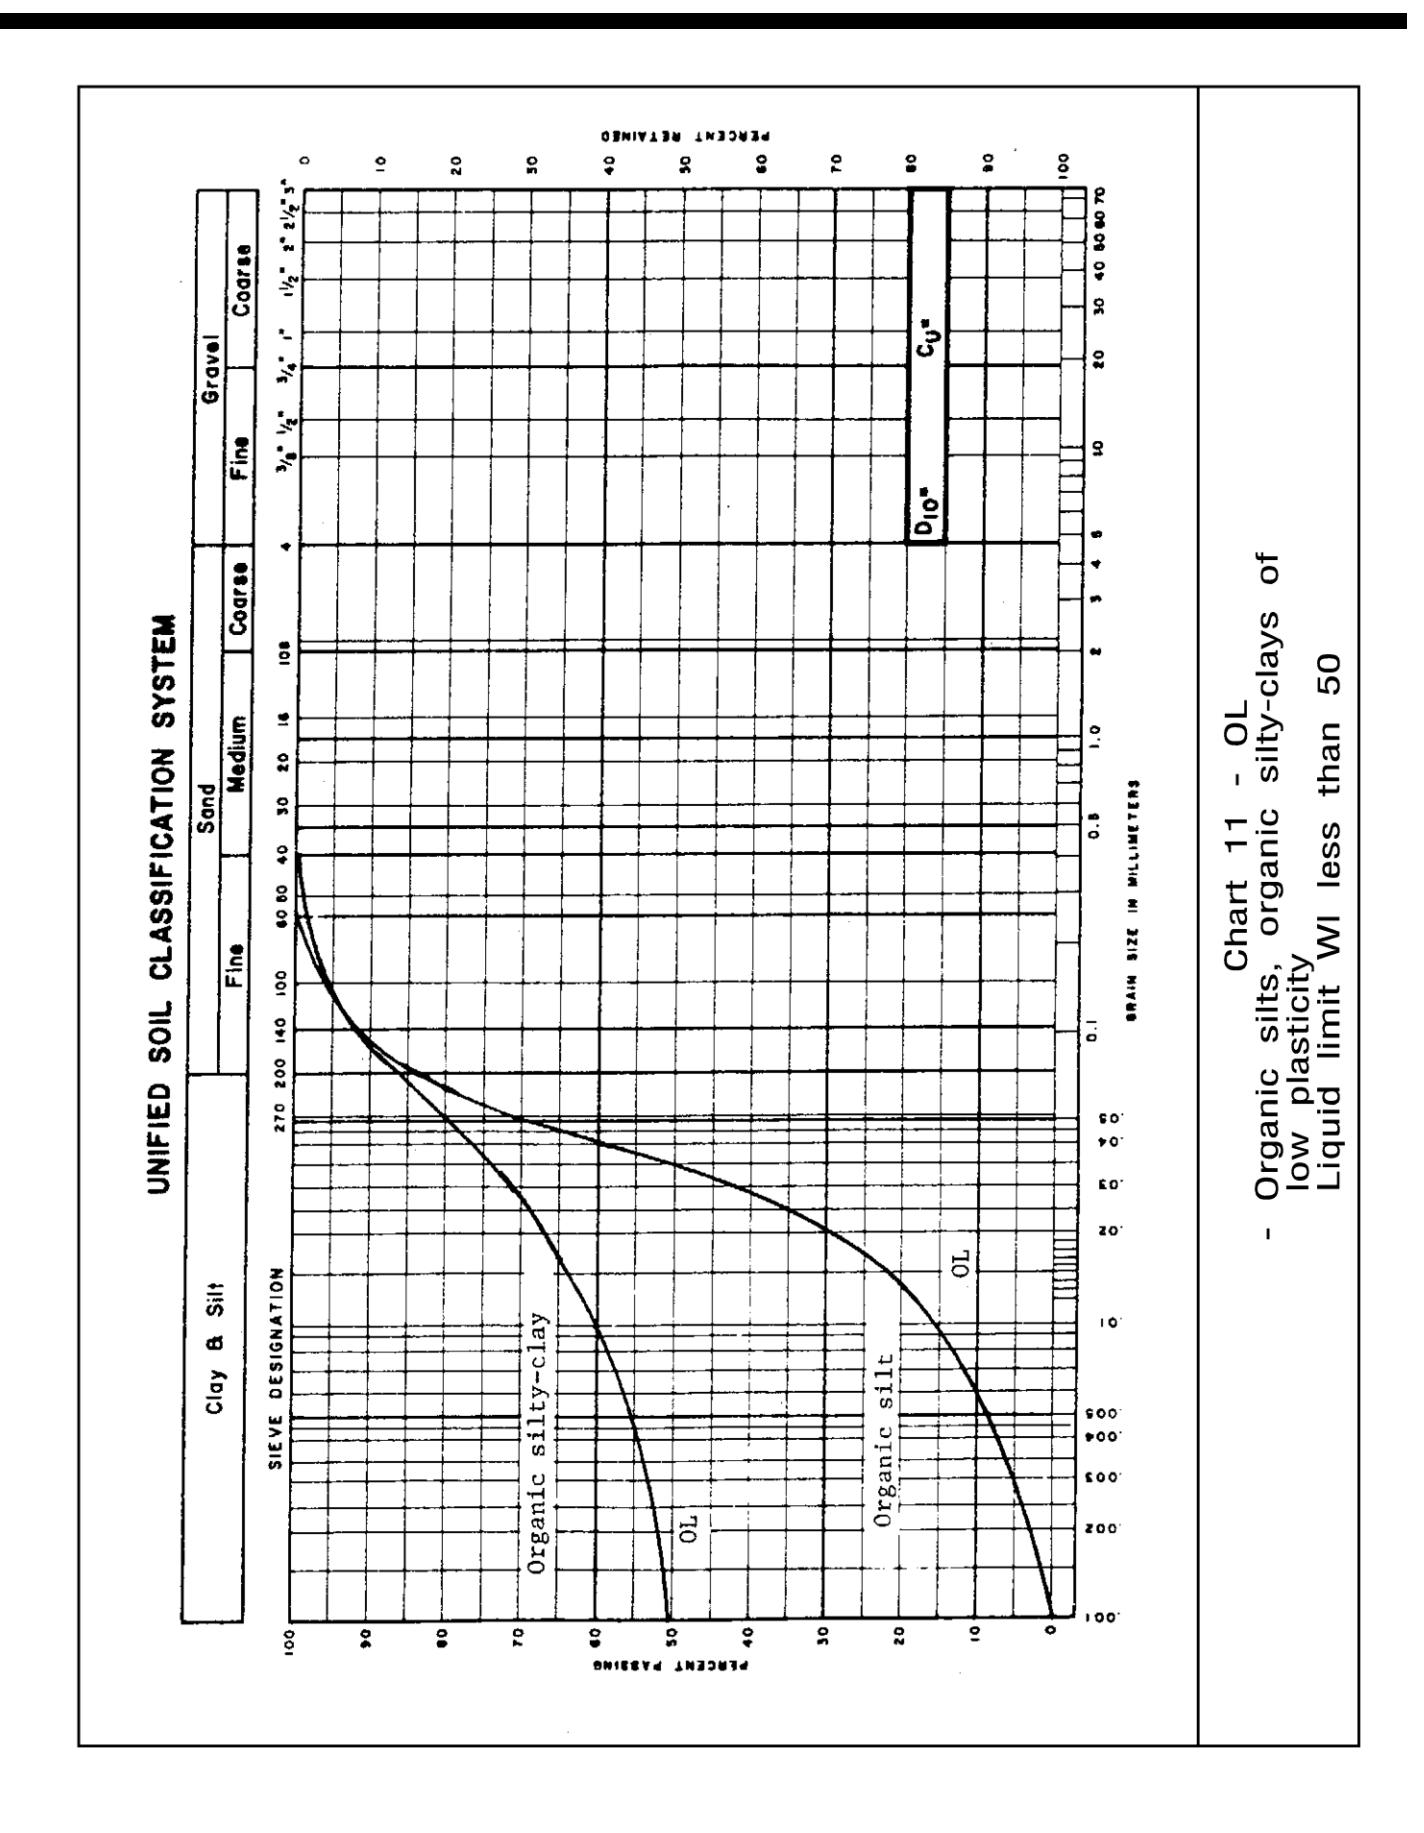
Chart 12 — MH: Inorganic silts, micaceous or diatomaceous fine sandy or silty soils, elastic silts
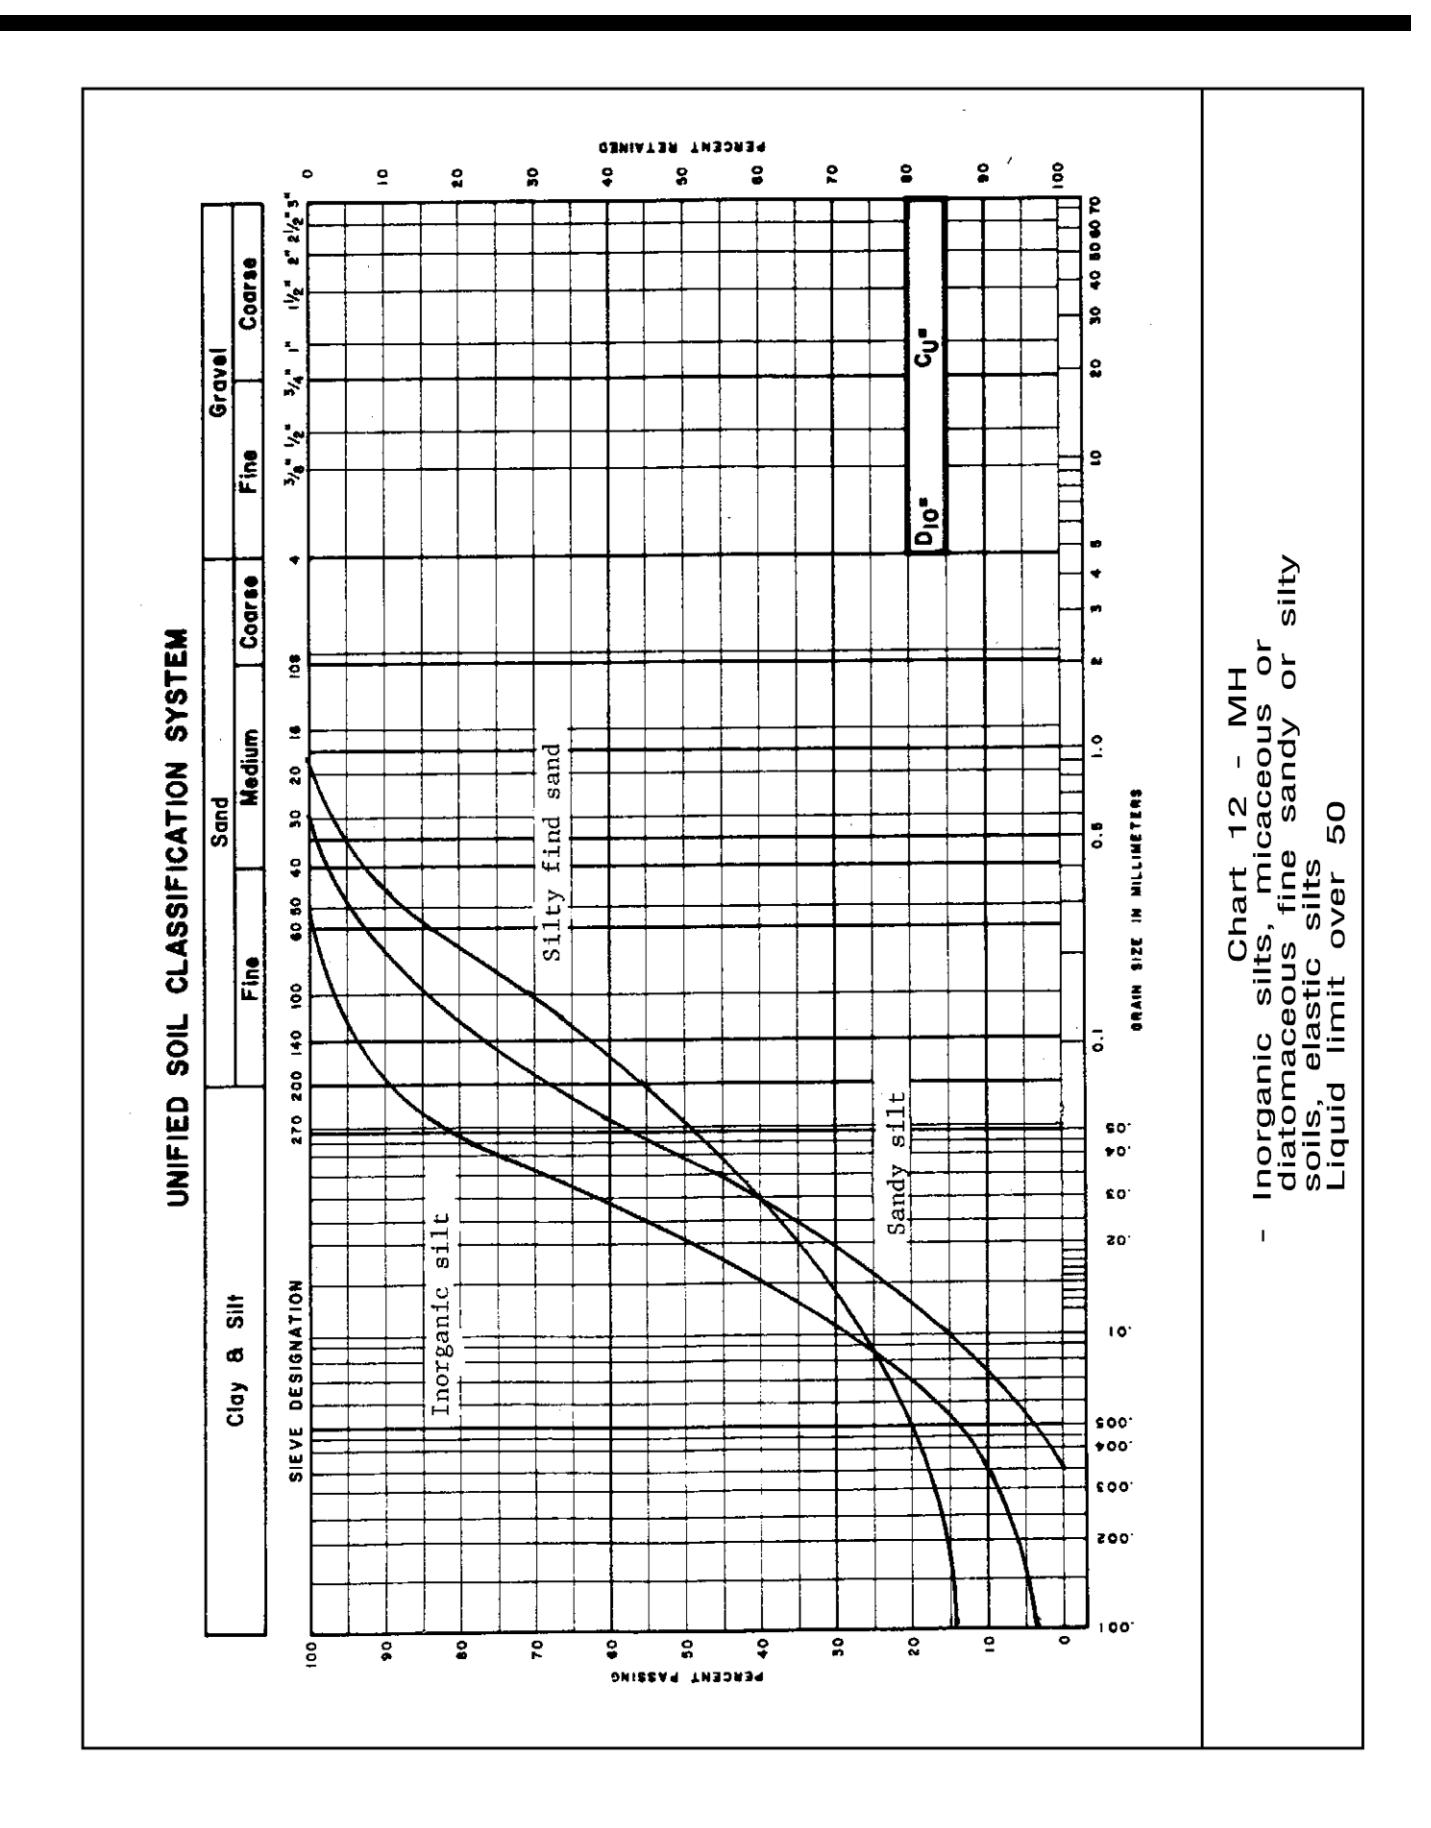
Chart 13 — CH: Inorganic clays of high plasticity, fat clays
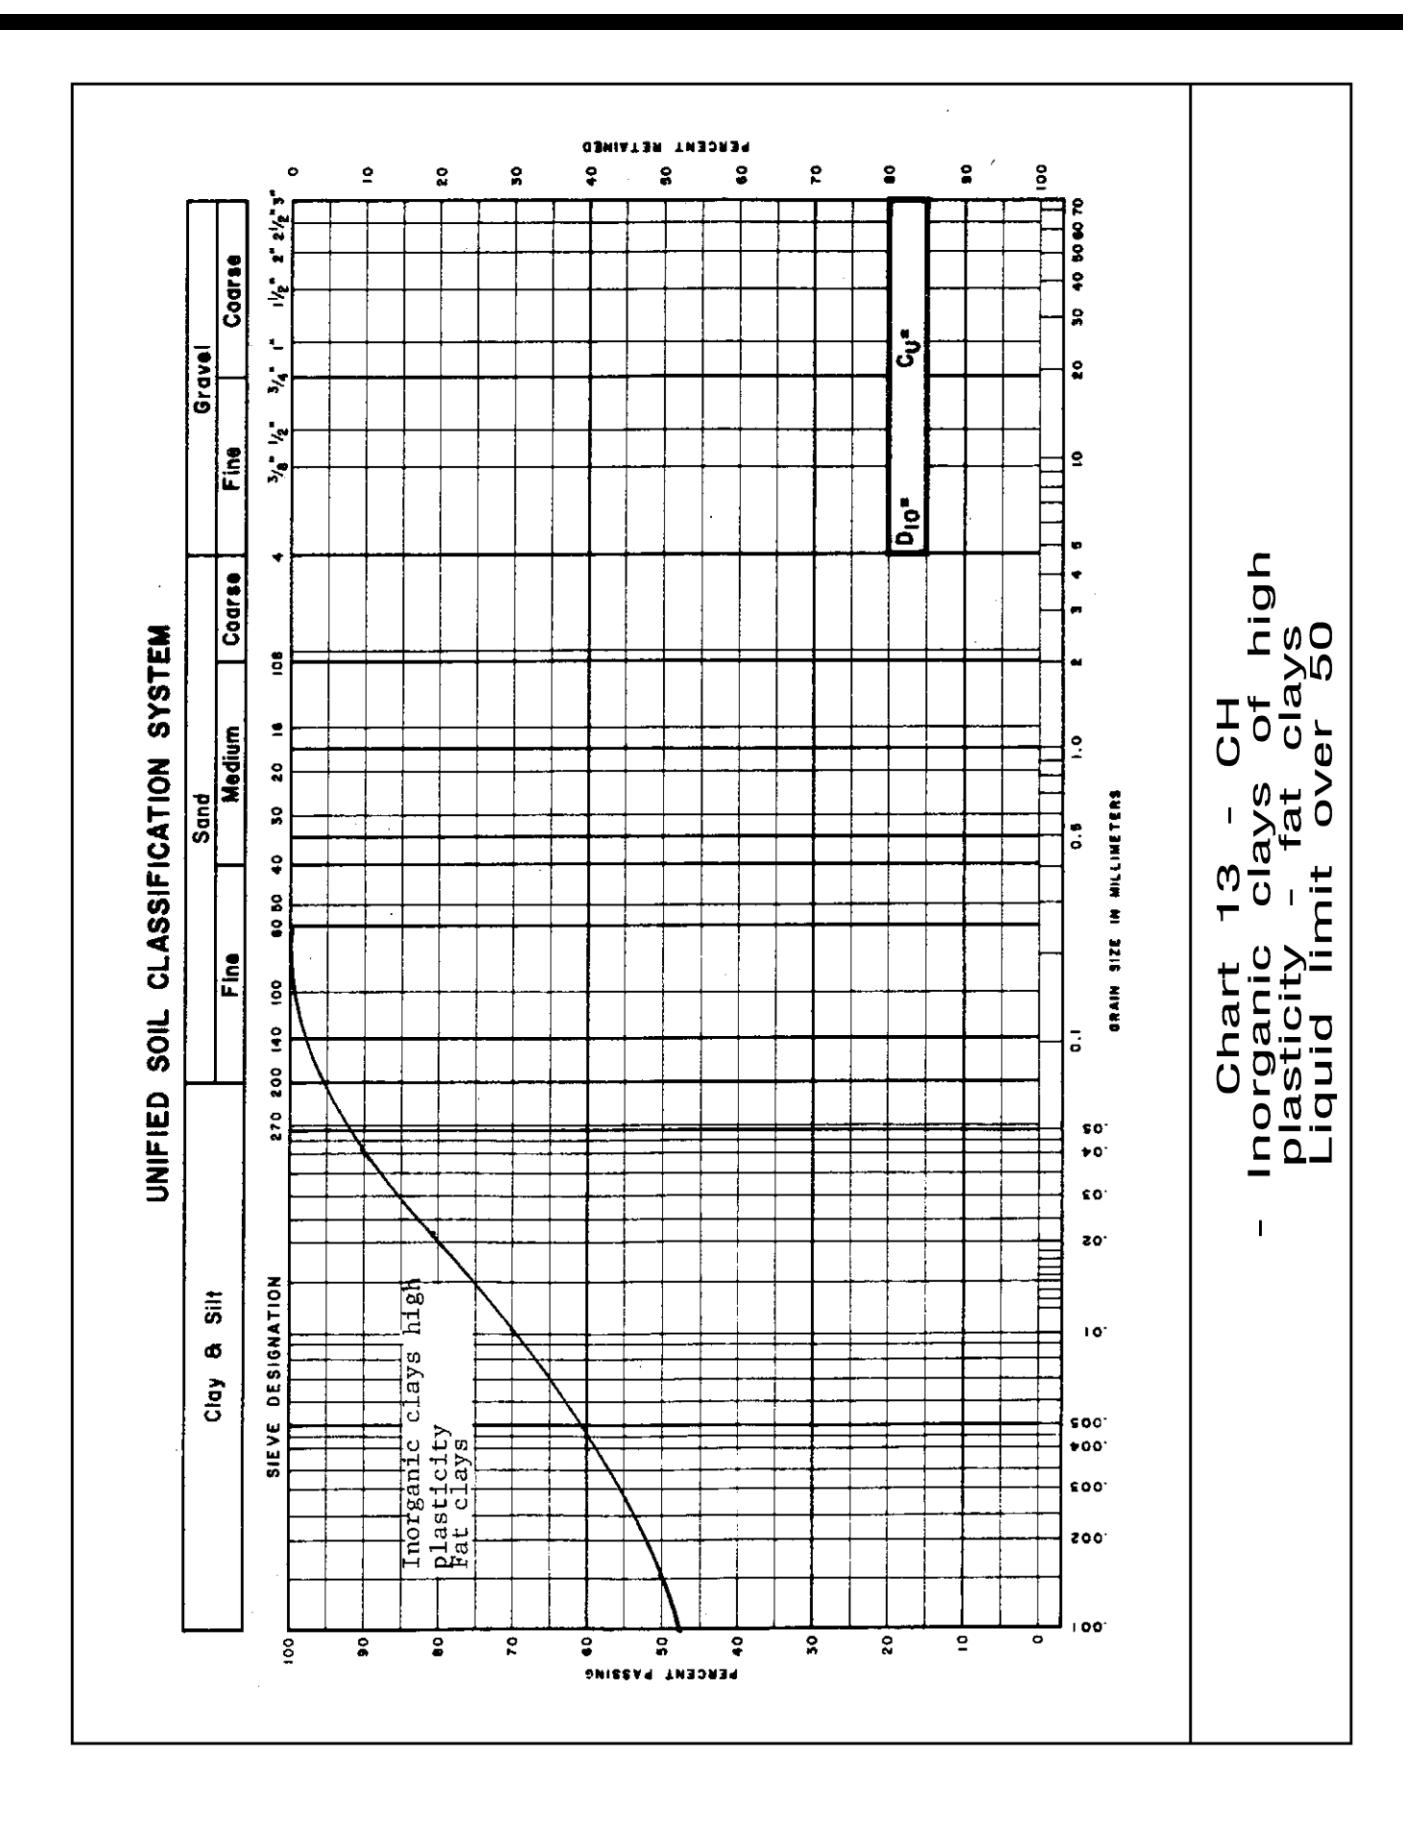
Chart 14 — OH: Organic clays of medium to high plasticity, organic silts
Updated: September 14, 2026
Published: May 22, 2026