

April to June, 2026
Introduction
About the Ontario Employment Report
The Ontario Employment Report is released four times a year and provides an assessment of the current trends and developments in the Ontario labour market. The Ontario Employment Report is a companion report to the Ontario Economic Accounts, which provides an overall assessment of the current state of the Ontario economy.
Overview
Ontario's labour market overview
Employment:
- +69,900 net jobs in Q2 2026, year-over-year
- +147,800 net full-time jobs in Q2 2026, year-over-year
- -16,700 net jobs in June 2026
- -10,500 net full-time jobs in June 2026
Unemployment rate:
- 7.1% in Q2 2026
- 7.0% in June 2026
Year-over-year, Ontario's employment increased by 0.8% (+69,900) in the second quarter of 2026, exceeding the growth rates of both the labour force (+0.1%) and the population (+0.5%), according to the Labour Force Survey. This compares to a modest national employment increase of 0.4% (+90,500) over the same period. Between the second quarters of 2025 and 2026, Ontario's unemployment rate decreased by 0.7 percentage point to 7.1%, while the national rate declined by 0.2 percentage point to 6.6%.
Ontario's labour market, January 2015 – June 2026 (seasonally adjusted)
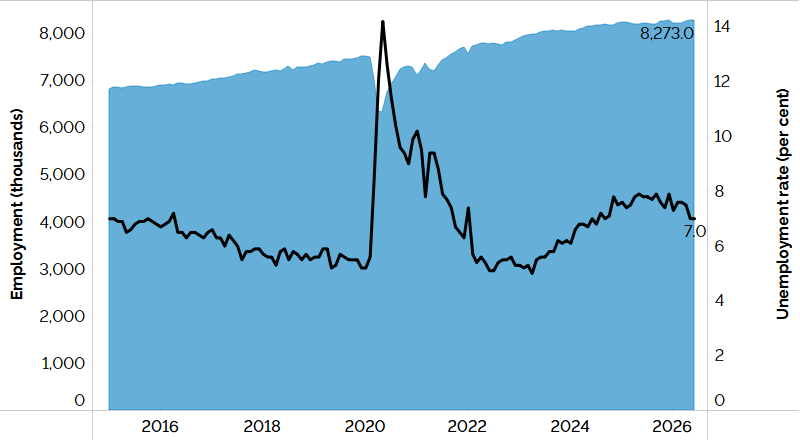
In June 2026, Ontario's employment stood at 8,273,000, declining by 16,700 (-0.2%) from the previous month, reflecting decreases in both full-time employment (-0.2%) and part-time employment (-0.4%). This decline followed consecutive monthly employment gains in April (+0.5%) and May (+0.5%). Nationally, employment increased slightly by 0.1% (+18,200) in June 2026.
In June 2026, Ontario's unemployment rate remained unchanged from the previous month at 7.0%, while Canada's unemployment rate edged down by 0.1 percentage point to 6.5%.
Year-over-year overview
Between the second quarters of 2025 and 2026 in Ontario:
- Employment increased by 0.8%, driven by growth in full‑time employment (+2.2%).
- Employment rose in the private sector (+1.5%) and among the self-employed (+1.2%), but declined in the public sector (-1.6%).
- Employment increased in both service-producing industries (+1.0%) and goods-producing industries (+0.2%).
- Employment growth was led by gains in the GTA (+1.6%) and Central Ontario (+0.7%).
- Employment increased among core-aged workers (+1.5%) and older workers (+1.0%), but declined among youth (-2.6%).
- Unemployment declined overall (-0.7 percentage point) and across most sociodemographic groups.
- Hourly wage growth (+3.2%) exceeded inflation (+2.3%).
Type of Work
Employment change by work status, Ontario, Q2 2026 over Q2 2025
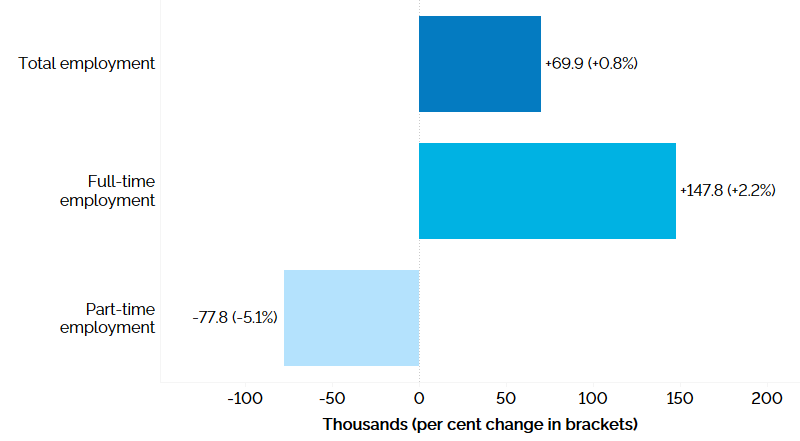
Year-over-year, Ontario employment rose by 0.8% (+69,900) in the second quarter of 2026, as gains in full-time employment (+147,800, +2.2%) more than offset declines in part-time employment (-77,800, -5.1%).
Employment change by employment sector, Ontario, Q2 2026 over Q2 2025
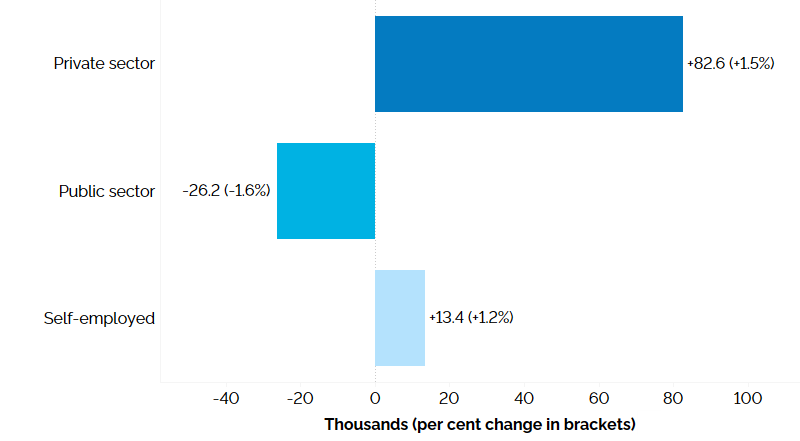
Year-over-year, employment increased by 1.5% (+82,600) in the private sector and by 1.2% (+13,400) among the self-employed, while it declined by 1.6% (-26,200) in the public sector.
Industry and occupation
Employment change by industry, goods-producing industries, Ontario, Q2 2026 over Q2 2025
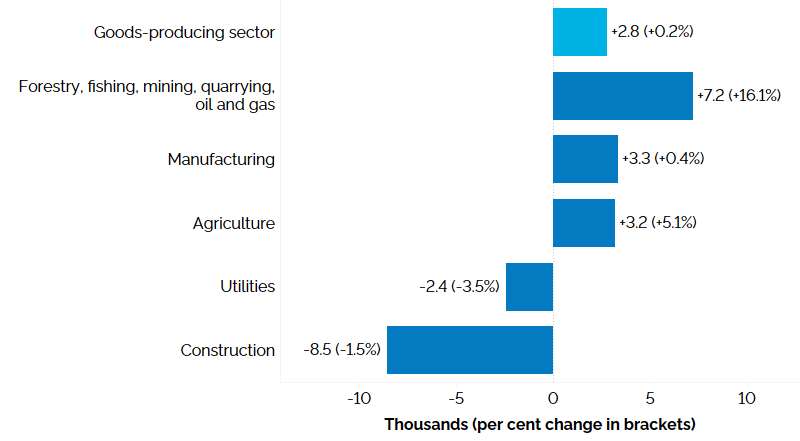
Employment in goods-producing industries increased (+2,800, +0.2%) in the second quarter of 2026, compared to the same period in 2025. Gains in forestry, fishing, mining, quarrying, oil and gas (+7,200, +16.1%), manufacturing (+3,300, +0.4%), and agriculture (+3,200, +5.1%) more than offset declines in construction (-8,500, -1.5%) and utilities (-2,400, -3.5%).
Employment change by industry, services-producing industries, Ontario, Q2 2026 over Q2 2025
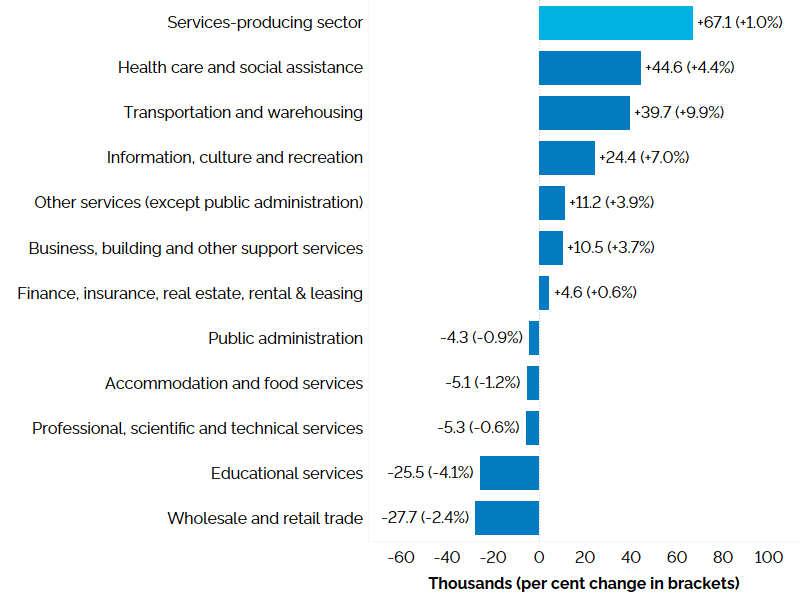
In the second quarter of 2026, employment in the services-producing industries increased (+67,100, +1.0%) compared to the same period in 2025. Six of eleven services-producing industries experienced employment growth. Health care and social assistance (+44,600, +4.4%) experienced the largest employment gain, followed by transportation and warehousing (+39,700, +9.9%). Wholesale and retail trade (-27,700, -2.4%) experienced the largest employment decline compared to the same period in 2025, followed by educational services (-25,500, -4.1%).
Employment change by occupational group, Ontario, Q2 2026 over Q2 2025footnote 2
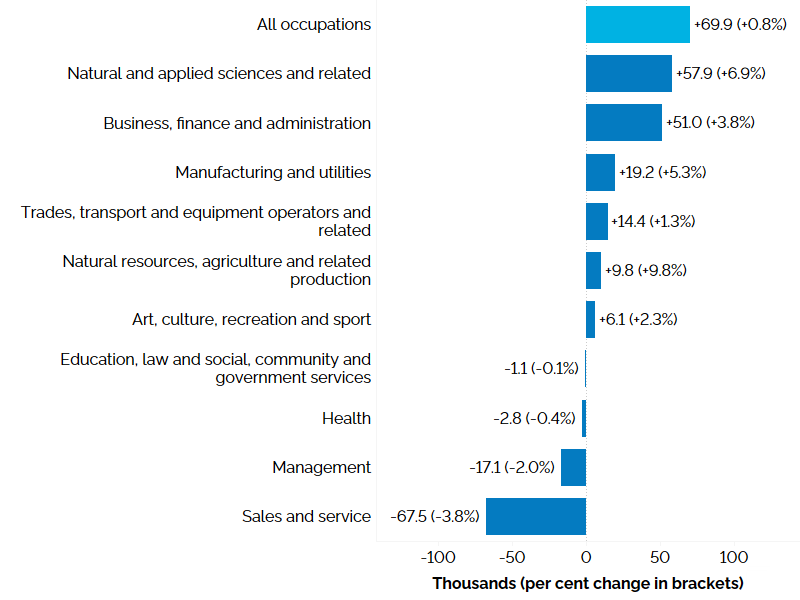
Year-over-year, six of ten occupational groups experienced an increase in employment. This was led by natural and applied sciences and related occupations (+57,900,+6.9%), business, finance and administration occupations (+51,000, +3.8%), and occupations in manufacturing and utilities (+19,200, +5.3%). Four occupational groups recorded employment declines, led by sales and service occupations (-67,500, -3.8%).
Geographic region
Employment change by Ontario region, Q2 2026 over Q2 2025footnote 3
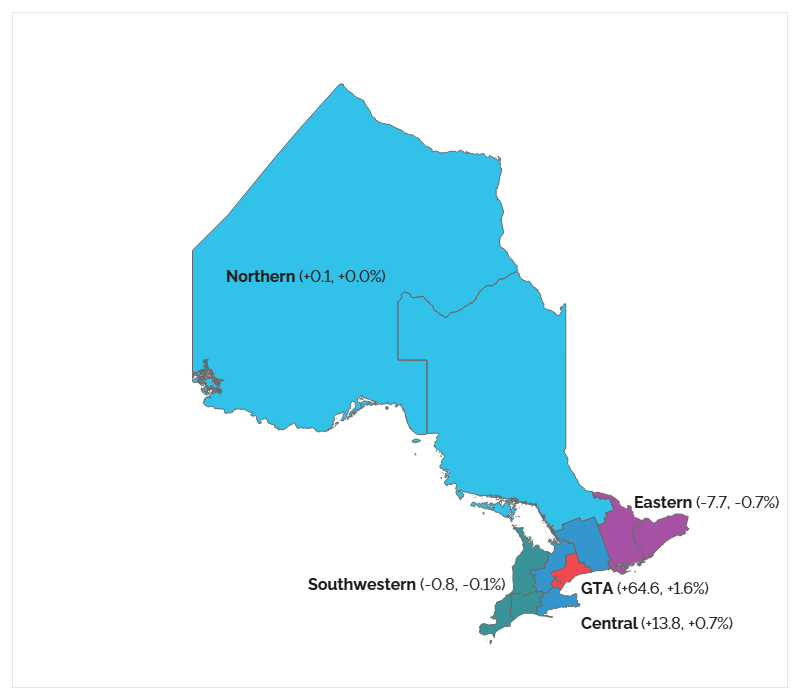
Year-over-year, employment growth was concentrated in the Greater Toronto Area (+64,600, +1.6%) and Central Ontario (+13,800, +0.7%). Employment in Northern Ontario was essentially unchanged (+100, +0.0%), while employment declined in Eastern Ontario (-7,700, -0.7%) and Southwestern Ontario (-800, -0.1%).
Unemployment rates by Ontario region, Q2 2026footnote 4
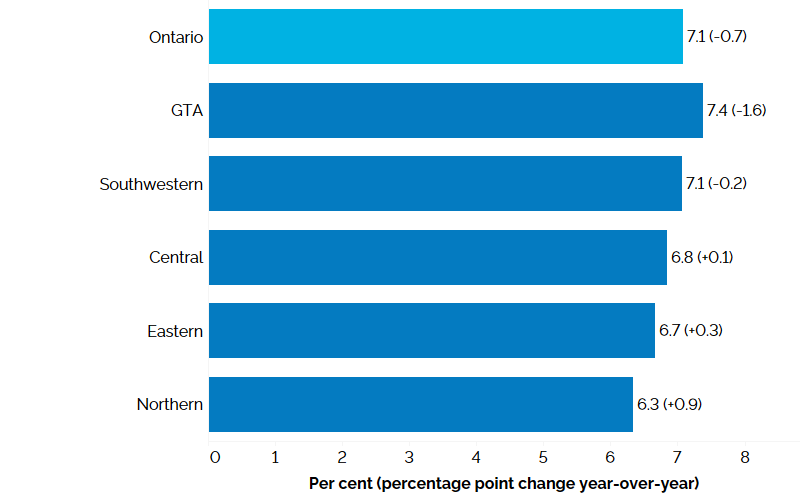
In the second quarter of 2026, the unemployment rate (7.1%) declined by 0.7 percentage point compared to the same quarter last year. The GTA continued to have the highest unemployment rate (7.4%), followed by Southwestern Ontario (7.1%), Central Ontario (6.8%), Eastern Ontario (6.7%), and Northern Ontario (6.3%).
The GTA (-1.6 percentage points) and Southwestern Ontario (-0.2 percentage point) experienced declines in their unemployment rates. The remaining three Ontario regions experienced increases in their unemployment rates, with Northern Ontario (+0.9 percentage point) recording the largest increase.
Age and gender
Employment change by age group and gender, Ontario, Q2 2026 over Q2 2025
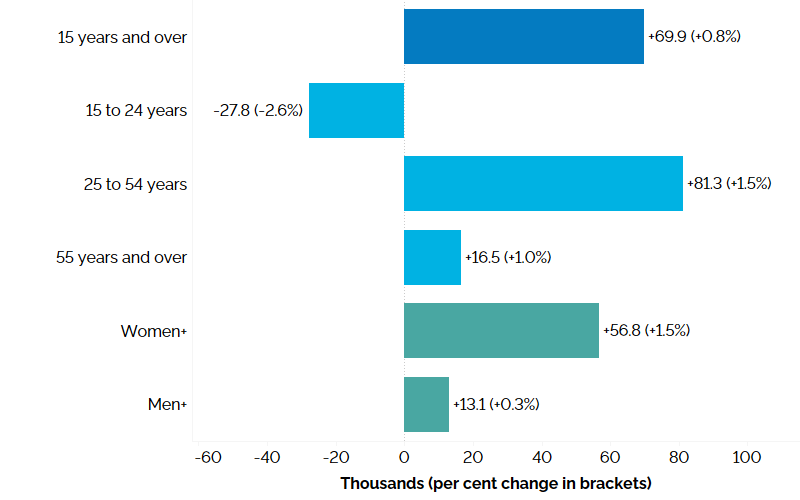
In the second quarter of 2026, compared to the same quarter last year, employment increased among core-aged workers aged 25 to 54 years (+81,300, +1.5%) and older workers aged 55 years and over (+16,500, +1.0%), but declined for youth aged 15 to 24 years (-27,800, -2.6%).
Year-over-year, employment increased for both women (+56,800, +1.5%) and men (+13,100, +0.3%).
Unemployment rates by age group and gender, Ontario, Q2 2026
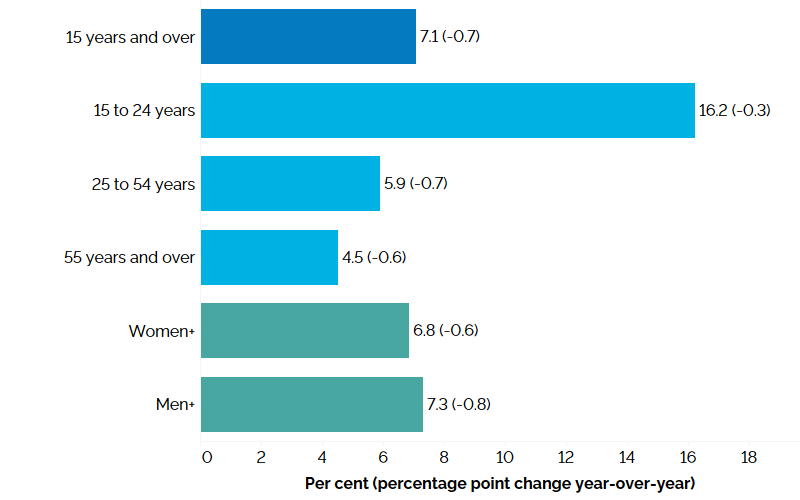
Youth in Ontario experienced the highest unemployment rate (16.2%) in the second quarter of 2026, followed by core-aged individuals (5.9%) and older individuals (4.5%). Compared to the same period last year, the unemployment rate decreased for core-aged workers (-0.7 percentage point), older workers (-0.6 percentage point) and youth (-0.3 percentage point).
In the second quarter of 2026, the unemployment rate for men (7.3%) was higher than that for women (6.8%). Compared to the same period last year, the unemployment rate declined for both men and women (-0.8 and -0.6 percentage point, respectively).
Education level and immigrant status
Employment rates by education level and immigrant status (core-aged population), Ontario, Q2 2026footnote 6
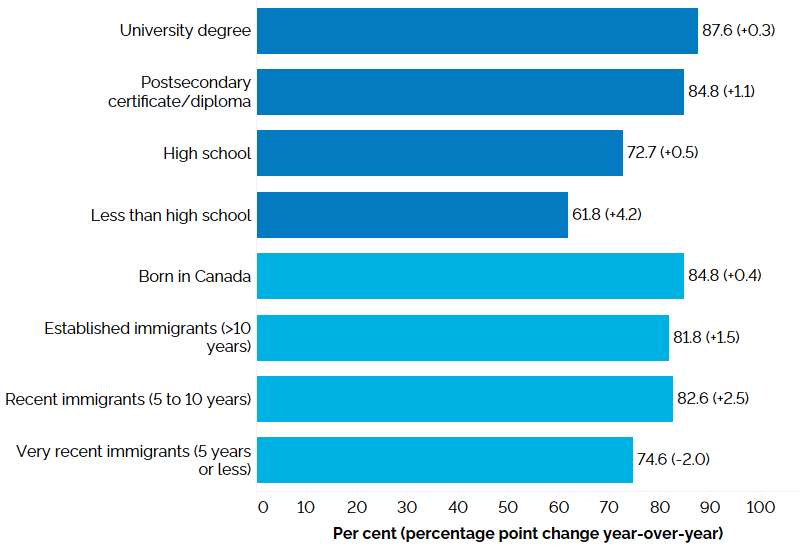
In the second quarter of 2026, core-aged individuals with a university degree continued to record the highest employment rate (87.6%), followed by those with a postsecondary certificate or diploma (84.8%), those with high school education (72.7%) and those with less than high school education (61.8%). Year-over-year, the employment rate increased across all education levels.
Among core-aged individuals, those born in Canada had the highest employment rate (84.8%), followed by recent immigrants (82.6%), established immigrants (81.8%) and very recent immigrants (74.6%).
Year-over-year, the employment rate increased for most groups by immigration status, except for very recent immigrants.
Unemployment rates by education level and immigrant status (core-aged population), Ontario, Q2 2026footnote 7
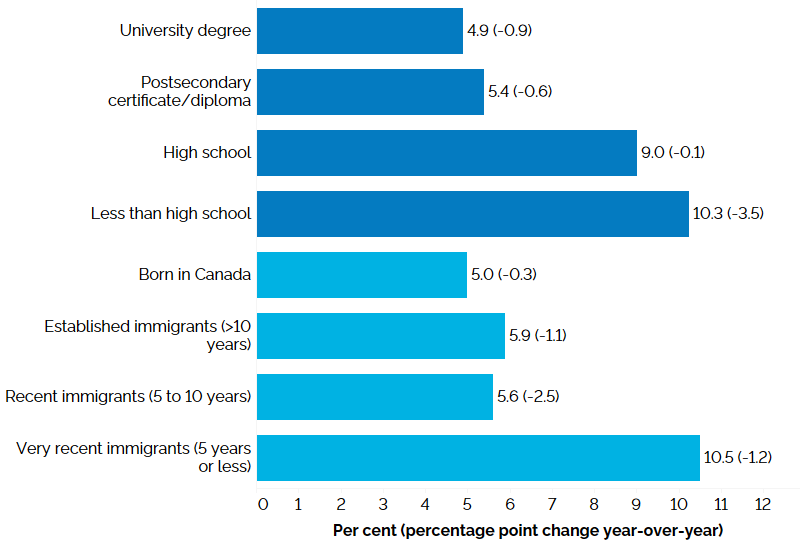
In the second quarter of 2026, the core-aged population with a university degree had the lowest unemployment rate (4.9%), followed by those with a postsecondary certificate/diploma (5.4%). Those with a high school diploma (9.0%) and those with less than high school education (10.3%)
The core-aged population born in Canada had the lowest unemployment rate (5.0%) in the second quarter, while very recent immigrants had the highest unemployment rate (10.5%). Year-over-year, the unemployment rate decreased for all groups by immigration status.
Wages
Average hourly wage growth by type of work, Ontario, Q2 2026 over Q2 2025footnote 9
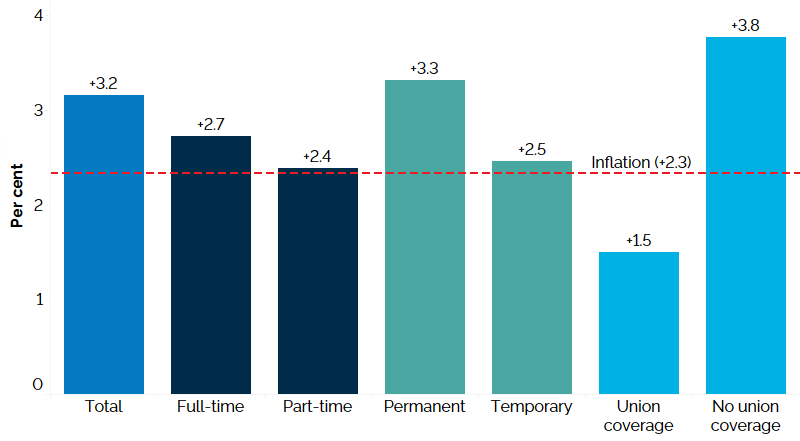
In the second quarter of 2026, the average hourly wage of Ontario employees was $38.48, an increase of 3.2% from the second quarter of 2025.
Full-time employees (+2.7%), part-time employees (+2.4%), permanent employees (+3.3%), temporary employees (+2.5%), employees with union coverage (+1.5%) and those without union coverage (+3.8%) all experienced increases in average hourly wages. However, only employees with union coverage experienced a nominal wage increase that was below inflation.
Methodological note
In the current issue, year-over-year change represents change between the averages in the second quarter of 2025 and the second quarter of 2026. Note that the Ontario Economic Accounts report primarily shows changes between two consecutive quarters.
This report uses seasonally adjusted data in charts displaying data with a monthly frequency in the Overview section.
Unadjusted data are used in charts and tables showing the changes for the current quarter compared with the same quarter for the previous year. Unadjusted data are also used to calculate annual averages, year-to-date averages and 2026 second quarter averages.
All estimates in this report are based on Statistics Canada's Labour Force Survey (LFS), which measures the current state of the national, provincial, and territorial labour market. The LFS is based on a household survey carried out monthly by Statistics Canada in reference weeks of each month. The reference periods for the three months of the second quarter of 2026 are April 12 to April 18, May 10 to May 16, and June 14 to June 20.
Appendix I
Overview of quarterly employment year-over-year, Ontario
| - | 2024Q3 | 2025Q3 | 2024Q4 | 2025Q4 | 2025Q1 | 2026Q1 | 2025Q2 | 2026Q2 |
|---|---|---|---|---|---|---|---|---|
| Total Labour Force (000) | 8,881.5 | 8,980.6 | 8,777.9 | 8,869.3 | 8,825.7 | 8,773.8 | 8,968.5 | 8,975.4 |
| Participation Rate (%) | 65.8 | 65.4 | 64.6 | 64.5 | 64.7 | 63.8 | 65.5 | 65.2 |
| Men+ Participation Rate (%) | 70.5 | 70.1 | 69.2 | 68.8 | 69.1 | 67.8 | 70.1 | 69.4 |
| Women+ Participation Rate (%) | 61.2 | 60.9 | 60.2 | 60.3 | 60.4 | 59.8 | 60.9 | 61.1 |
| Total Employment (000) | 8,217.2 | 8,234.3 | 8,176.6 | 8,248.1 | 8,155.5 | 8,118.3 | 8,270.0 | 8,339.9 |
| - Full-time (000) | 6,847.6 | 6,863.0 | 6,704.3 | 6,762.2 | 6,623.6 | 6,649.2 | 6,757.6 | 6,905.3 |
| - Part-time (000) | 1,369.6 | 1,371.4 | 1,472.4 | 1,485.9 | 1,531.9 | 1,469.1 | 1,512.4 | 1,434.6 |
| Employment-Population Ratio (%) | 60.9 | 60.0 | 60.2 | 60.0 | 59.8 | 59.0 | 60.4 | 60.6 |
| Men+ Employment (000) | 4,364.1 | 4,373.9 | 4,322.3 | 4,355.8 | 4,290.9 | 4,252.1 | 4,374.8 | 4,387.9 |
| Women+ Employment (000) | 3,853.1 | 3,860.4 | 3,854.3 | 3,892.2 | 3,864.6 | 3,866.2 | 3,895.2 | 3,952.1 |
| Part Time (% of total) | 16.7 | 16.7 | 18.0 | 18.0 | 18.8 | 18.1 | 18.3 | 17.2 |
| Goods-Producing Sector Employment (000) | 1,613.9 | 1,600.7 | 1,562.6 | 1,571.0 | 1,555.6 | 1,511.8 | 1,574.8 | 1,577.6 |
| Services-Producing Sector Employment (000) | 6,603.3 | 6,633.6 | 6,614.0 | 6,677.0 | 6,599.9 | 6,606.4 | 6,695.2 | 6,762.3 |
| Private Sector Employment (000) | 5,520.7 | 5,549.4 | 5,400.6 | 5,532.9 | 5,400.3 | 5,405.3 | 5,513.2 | 5,595.8 |
| Public Sector Employment | 1,582.3 | 1,576.1 | 1,650.3 | 1,619.9 | 1,643.9 | 1,622.5 | 1,643.8 | 1,617.6 |
| Self-Employment (% of total) | 13.6 | 13.5 | 13.8 | 13.3 | 13.6 | 13.4 | 13.5 | 13.5 |
| Total Unemployment (000) | 664.3 | 746.2 | 601.3 | 621.2 | 670.1 | 655.5 | 698.5 | 635.5 |
| Unemployment Rate (%) | 7.5 | 8.3 | 6.9 | 7.0 | 7.6 | 7.5 | 7.8 | 7.1 |
| Men+ Unemployment Rate (%) | 7.5 | 8.2 | 7.3 | 7.1 | 8.2 | 8.0 | 8.1 | 7.3 |
| Women+ Unemployment Rate (%) | 7.4 | 8.4 | 6.4 | 6.9 | 6.9 | 6.9 | 7.4 | 6.8 |
| Long-Term (27 wks+) (% of total) | 20.3 | 26.3 | 27.8 | 30.6 | 26.9 | 27.9 | 25.0 | 27.4 |
| Average Unemployment in Weeks | 19.8 | 25.4 | 25.0 | 26.1 | 24.2 | 26.1 | 24.1 | 26.3 |
| Youth Unemployment Rate (%) | 16.6 | 17.1 | 15.0 | 14.1 | 16.0 | 15.7 | 16.6 | 16.2 |
| 25-54 y.o Unemployment Rate (%) | 6.1 | 7.1 | 5.9 | 6.2 | 6.6 | 6.7 | 6.7 | 5.9 |
| 55+ y.o Unemployment Rate (%) | 5.2 | 5.7 | 4.5 | 4.9 | 5.1 | 4.8 | 5.2 | 4.5 |
| Average Weekly Wage Rate ($) | 1,354.92 | 1,394.28 | 1,368.65 | 1,403.37 | 1,361.93 | 1,418.97 | 1,366.75 | 1,419.45 |
| Average Hourly Wage Rate ($) | 36.60 | 37.73 | 37.43 | 38.49 | 37.32 | 38.85 | 37.31 | 38.48 |
Employment by Region (000)
| Region | 2024Q3 | 2025Q3 | 2024Q4 | 2025Q4 | 2025Q1 | 2026Q1 | 2025Q2 | 2026Q2 |
|---|---|---|---|---|---|---|---|---|
| Central | 1,909.5 | 1,927.5 | 1,901.8 | 1,922.4 | 1,884.8 | 1,885.4 | 1,950.9 | 1,964.7 |
| Southwestern | 943.1 | 947.6 | 945.8 | 972.6 | 931.3 | 919.7 | 927.9 | 927.1 |
| Eastern | 1,091.4 | 1,061.1 | 1,085.7 | 1,034.7 | 1,070.3 | 1,036.5 | 1,075.8 | 1,068.1 |
| Northern | 388.8 | 402.6 | 379.3 | 394.8 | 380.8 | 385.7 | 391.5 | 391.6 |
| Greater Toronto Area (GTA) | 3,884.4 | 3,895.5 | 3,863.9 | 3,923.5 | 3,888.4 | 3,891.1 | 3,923.8 | 3,988.4 |
Unemployment Rate by Region (%)
| Region | 2024Q3 | 2025Q3 | 2024Q4 | 2025Q4 | 2025Q1 | 2026Q1 | 2025Q2 | 2026Q2 |
|---|---|---|---|---|---|---|---|---|
| Central | 6.3 | 7.3 | 6.3 | 6.7 | 7.3 | 7.3 | 6.7 | 6.8 |
| Southwestern | 7.2 | 7.6 | 6.2 | 6.3 | 6.9 | 7.8 | 7.3 | 7.1 |
| Eastern | 6.4 | 7.1 | 5.4 | 6.5 | 5.6 | 6.2 | 6.4 | 6.7 |
| Northern | 5.8 | 5.9 | 5.4 | 6.2 | 5.0 | 6.7 | 5.4 | 6.3 |
| Greater Toronto Area (GTA) | 8.6 | 9.5 | 7.8 | 7.6 | 8.7 | 7.9 | 9.0 | 7.4 |
Total Employment by CMA (000)
Greater Toronto Area
| - | 2024Q3 | 2025Q3 | 2024Q4 | 2025Q4 | 2025Q1 | 2026Q1 | 2025Q2 | 2026Q2 |
|---|---|---|---|---|---|---|---|---|
| Toronto | 3,697.4 | 3,715.8 | 3,682.0 | 3,743.7 | 3,720.6 | 3,709.9 | 3,766.5 | 3,801.6 |
| Oshawa | 239.6 | 253.3 | 239.7 | 258.2 | 247.3 | 253.7 | 240.0 | 261.2 |
Central Ontario
| - | 2024Q3 | 2025Q3 | 2024Q4 | 2025Q4 | 2025Q1 | 2026Q1 | 2025Q2 | 2026Q2 |
|---|---|---|---|---|---|---|---|---|
| Hamilton | 434.8 | 454.6 | 430.8 | 444.0 | 419.4 | 432.2 | 450.8 | 457.6 |
| Kitchener-Cambridge-Waterloo | 378.7 | 386.1 | 389.6 | 387.8 | 385.7 | 382.0 | 396.8 | 388.2 |
| St. Catharines-Niagara | 241.3 | 238.8 | 242.5 | 237.8 | 237.4 | 233.4 | 243.4 | 243.6 |
| Peterborough | 66.3 | 73.5 | 70.7 | 72.8 | 68.3 | 68.4 | 68.6 | 71.3 |
| Brantford | 82.6 | 89.8 | 85.5 | 87.4 | 83.4 | 87.3 | 88.3 | 91.5 |
| Guelph | 99.1 | 94.9 | 97.9 | 96.7 | 100.1 | 100.9 | 98.2 | 105.6 |
| Barrie | 137.5 | 130.9 | 130.8 | 129.6 | 125.2 | 126.5 | 134.9 | 132.1 |
Eastern Ontario
| - | 2024Q3 | 2025Q3 | 2024Q4 | 2025Q4 | 2025Q1 | 2026Q1 | 2025Q2 | 2026Q2 |
|---|---|---|---|---|---|---|---|---|
| Ottawa-Gatineau (Ontario part) | 703.5 | 682.4 | 702.3 | 665.2 | 705.5 | 675.5 | 699.7 | 706.2 |
| Kingston | 92.3 | 94.3 | 96.0 | 93.6 | 96.6 | 93.6 | 95.1 | 95.6 |
| Belleville - Quinte West | 51.7 | 54.9 | 35.1 | 55.4 | 31.7 | 58.2 | 55.2 | 58.5 |
Southwestern Ontario
| - | 2024Q3 | 2025Q3 | 2024Q4 | 2025Q4 | 2025Q1 | 2026Q1 | 2025Q2 | 2026Q2 |
|---|---|---|---|---|---|---|---|---|
| London | 320.7 | 333.7 | 322.3 | 328.6 | 324.2 | 313.5 | 326.1 | 317.6 |
| Windsor | 239.7 | 231.1 | 237.8 | 245.8 | 241.4 | 231.4 | 234.1 | 232.8 |
Northern Ontario
| - | 2024Q3 | 2025Q3 | 2024Q4 | 2025Q4 | 2025Q1 | 2026Q1 | 2025Q2 | 2026Q2 |
|---|---|---|---|---|---|---|---|---|
| Greater Sudbury | 91.0 | 95.4 | 91.9 | 97.0 | 92.6 | 98.7 | 96.7 | 100.3 |
| Thunder Bay | 66.5 | 68.5 | 65.3 | 70.0 | 63.3 | 68.1 | 65.4 | 68.3 |
Overview of monthly* labour force characteristics, Ontario
| - | Apr-25 | May-25 | Jun-25 | Jul-25 | Aug-25 | Sept-25 | Oct-25 | Nov-25 | Dec-25 | Jan-26 | Feb-26 | Mar-26 | Apr-26 | May-26 | Jun-26 |
|---|---|---|---|---|---|---|---|---|---|---|---|---|---|---|---|
| Employment | 8,193.6 | 8,198.1 | 8,208.3 | 8,216.3 | 8,190.3 | 8,200.2 | 8,252.5 | 8,256.4 | 8,274.5 | 8,208.0 | 8,211.3 | 8,205.5 | 8,247.9 | 8,289.7 | 8,273.0 |
| Unemployment rate | 7.8 | 7.9 | 7.8 | 7.8 | 7.7 | 7.9 | 7.6 | 7.4 | 7.9 | 7.3 | 7.6 | 7.6 | 7.5 | 7.0 | 7.0 |
| Participation rate | 64.9 | 65.0 | 64.9 | 65.0 | 64.7 | 64.8 | 65.0 | 64.8 | 65.4 | 64.4 | 64.6 | 64.6 | 64.8 | 64.7 | 64.6 |
* Seasonally adjusted.
Footnotes
- footnote[1] Back to paragraph The public sector includes employees in federal, provincial, territorial, municipal and Aboriginal public administrations, as well as in Crown corporations, liquor control boards and other government institutions such as schools (including universities), hospitals and public libraries.
- footnote[2] Back to paragraph Occupation estimates are based on the 2021 National Occupational Classification. Management occupations are classified under the management occupational category and the remaining categories exclude management occupations.
- footnote[3] Back to paragraph The map shows five Ontario regions: Northern Ontario, Eastern Ontario, Southwestern Ontario, Central Ontario and the Greater Toronto Area (the GTA), which are based on Ministry of Finance’s groupings of Statistics Canada’s economic regions. Employment changes are based on three-month moving averages for June 2025 and June 2026, using unadjusted data.
- footnote[4] Back to paragraph Based on a three-month moving average for June 2026, using unadjusted data. The seasonally adjusted estimate for Ontario in Q2 2026 is 7.2%.
- footnote[5] Back to paragraph Changes have been introduced to the Labour Force Survey starting in January 2022 to use gender (men+, women+) instead of sex of person (male, female). The category “Men+” includes men and boys, as well as some non-binary persons, while the category “Women+” includes women and girls, as well as some non-binary persons. Given that the non-binary population is small, data aggregation to a two-category gender variable is necessary to protect the confidentiality of responses provided.
- footnote[6] Back to paragraph Rate by immigrant status is based on a three-month moving average for June 2026. Education level refers to the highest level of schooling completed.
- footnote[7] Back to paragraph Rate by immigrant status is based on a three-month moving average for June 2026. Education level refers to the highest level of schooling completed.
- footnote[8] Back to paragraph The less than high school population includes those with 0 to 8 years of education and those with some high school education.
- footnote[9] Back to paragraph Nominal wage growth, not adjusted for inflation. Self-employment is excluded. Inflation is measured as an increase in the all-items Consumer Price Index for Ontario between April and June 2025 and April and June 2026.
- footnote[10] Back to paragraph Year-over-year comparison (between second quarters of 2025 and 2026) is in nominal dollars.
- footnote[11] Back to paragraph Estimates of employment changes and rate calculations are based on unrounded quarterly estimates and may differ slightly from estimates based on published quarterly data due to rounding.