July to September, 2018
Introduction
About the Ontario Employment Report
The Ontario Employment Report is released four times a year and provides an assessment of the current trends and developments in the Ontario labour market. The Ontario Employment Report is a companion report to the Ontario Economic Accounts, which provides an overall assessment of the current state of the Ontario economy. Most estimates in the Ontario Employment Report are based on Statistics Canada data. Its primary audience includes economists in both public and private sectors and credit rating agencies.
Methodological Note
In the current issue, year-over-year change represents change between the averages in the third quarter of 2017 and the third quarter of 2018. Note that the Ontario Economic Accounts report primarily shows changes between the previous and the current quarter.
This report uses seasonally adjusted data in charts displaying data with a monthly frequency in the Overview section.
Unadjusted data is used in charts and tables showing the changes for the current quarter compared with the same quarter for the previous year. Unadjusted data is also used to calculate annual averages, year-to-date averages and 2018 third quarter averages.
Overview
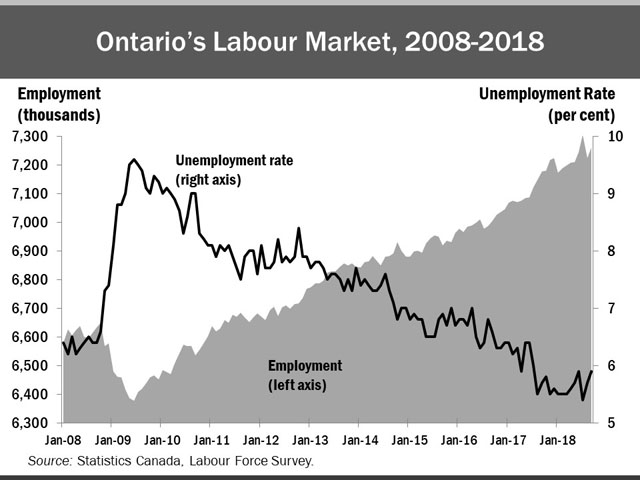
Ontario’s Labour Market Overview
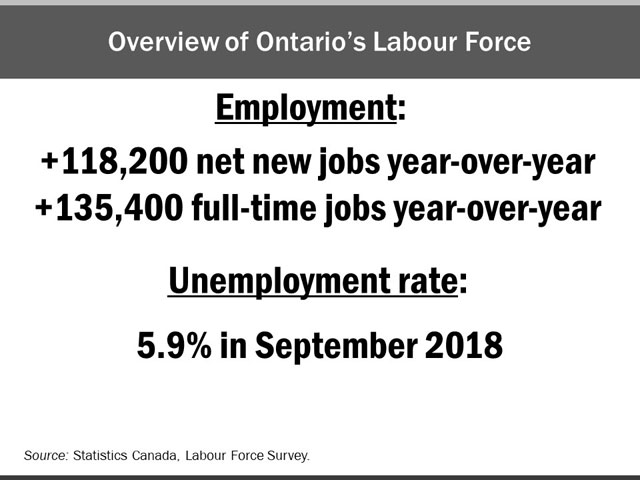
Year-over-year, Ontario’s employment grew by 1.6% (+118,200), higher than the Canadian rate of 1.1%.
Ontario’s unemployment rate was 5.9% in September 2018, the same as the Canadian rate.
Year-over-year Overview
Between the third quarter of 2017 and 2018:
- Employment growth was driven by increases in full-time employment (+2.3%) while part-time employment declined (-1.3%)
- There were significant employment gains in both the services- (+1.7%) and goods- (+1.3%) producing sectors
- Four of the five Ontario regions posted employment gains with Southwestern Ontario experiencing the fastest employment growth (+3.5%)
- Core-aged workers and older workers experienced above-average employment growth (+1.8% and +1.7%, respectively)
- The average hourly wage increased by 3.7%, to $27.25.
In Focus: Underutilized Labour
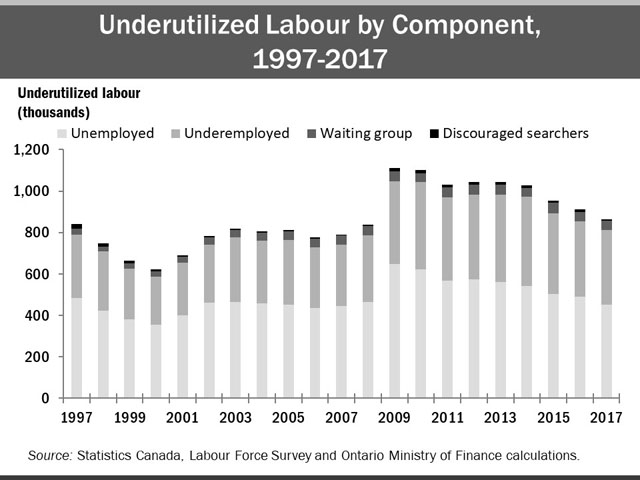
- In 2017, about 864,000 workers were underutilized
footnote 1 in Ontario. This was down from the recessionary peak of 1,100,000 in 2009, but higher than the pre-recession level of 836,000 in 2008
Type of Work Quarterly Details
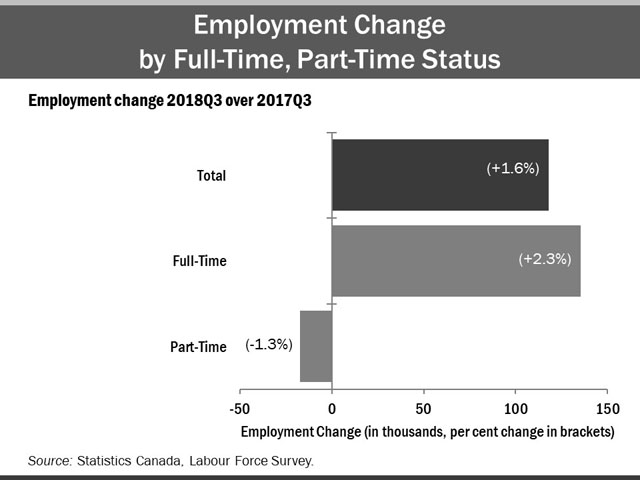
Year-over-year, full-time employment increased by 2.3% in the third quarter, while part-time employment decreased by 1.3%, and all sectors saw growth.
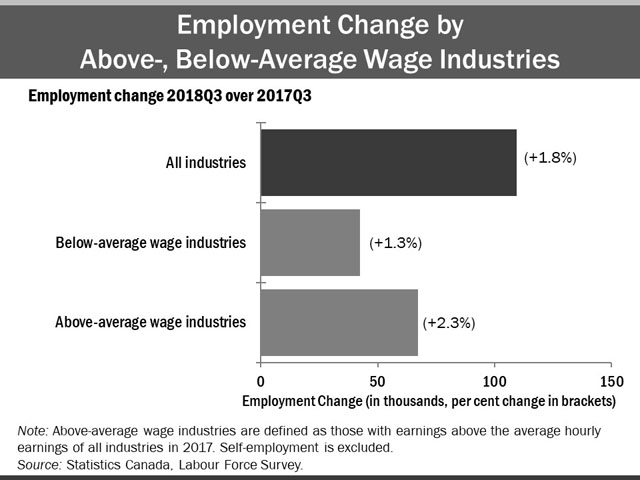
Year-over-year, paid employment increased in above-average wage industries by 2.3%, while employment in below-average wage industries increased by 1.3%.
Sector and Occupation Quarterly Details
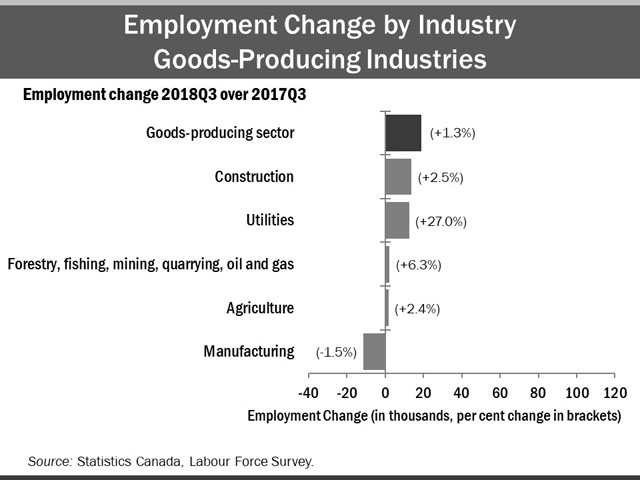
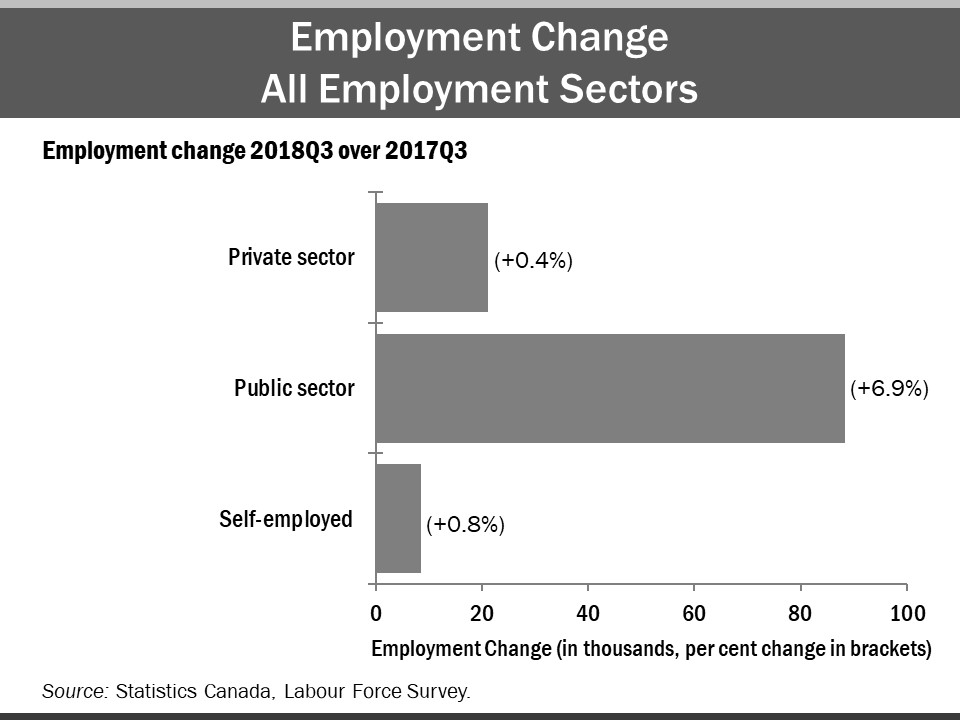
Year-over-year, there were significant employment gains in both the goods-producing sector (+1.3%) and services-producing sector (+1.7%).
Among goods-producing industries, construction added the most jobs. This was followed by utilities, which saw the largest growth rate of 27.0%.
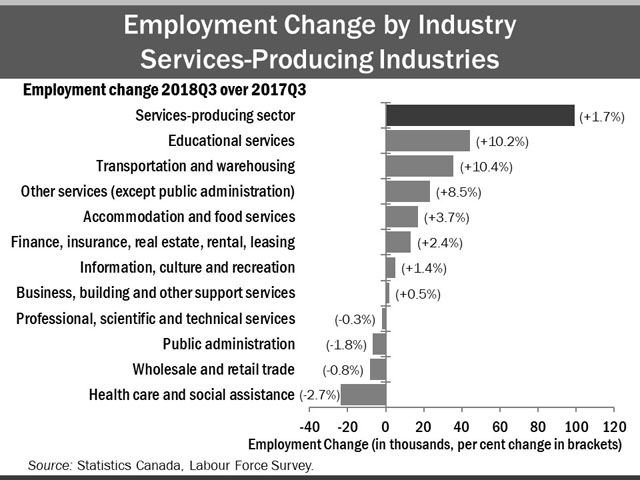
Among service-producing industries, educational services and transportation and warehousing gained the most jobs, followed by other services (except public administration) and accommodation and food services. Health care and social assistance had the largest decline in employment (-2.7%).
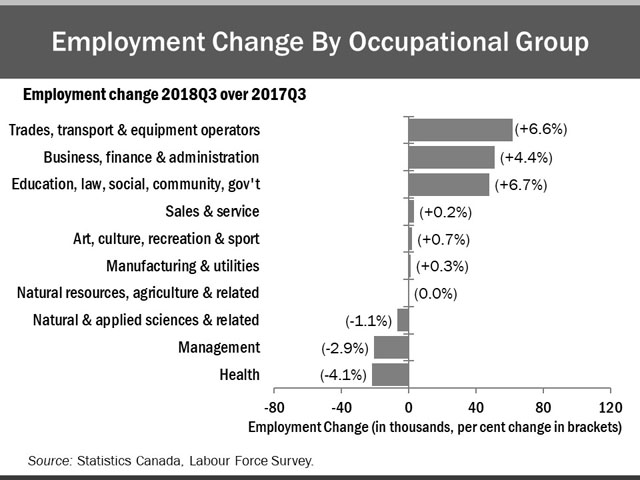
Among broad occupational groups, trade, transport and equipment operator occupations saw the largest increase in employment, though education, law, social, community and government occupations had the strongest rate of growth at 6.7%.
Geographic Region
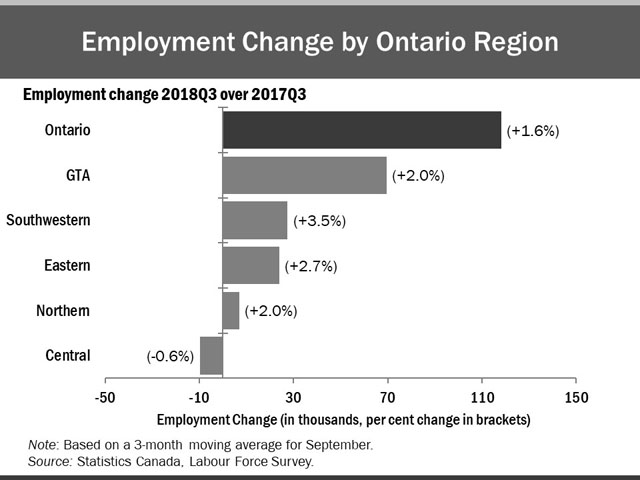
Year-over-year, employment increased in four of the five Ontario regions. The rate of employment growth was highest in Southwestern Ontario (+3.5%), followed by Eastern Ontario (+2.7%), the Greater Toronto Area (GTA)
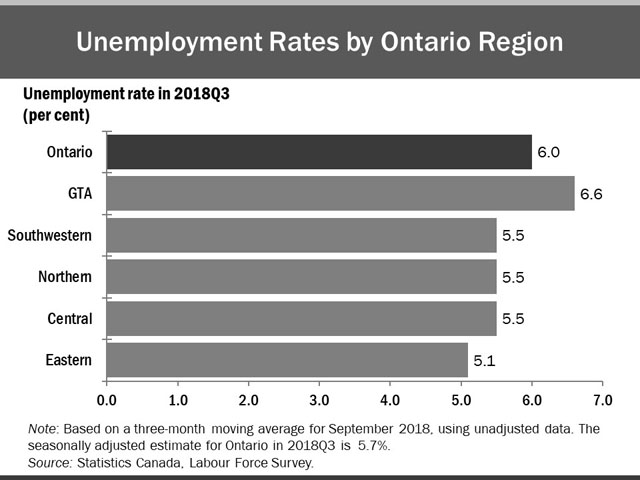
In the third quarter of 2018, the GTA had the highest unemployment rate (6.6%) and Eastern Ontario had the lowest unemployment rate (5.1%).
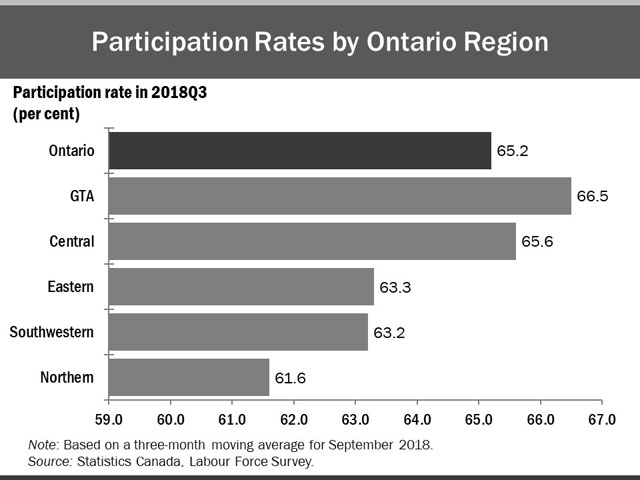
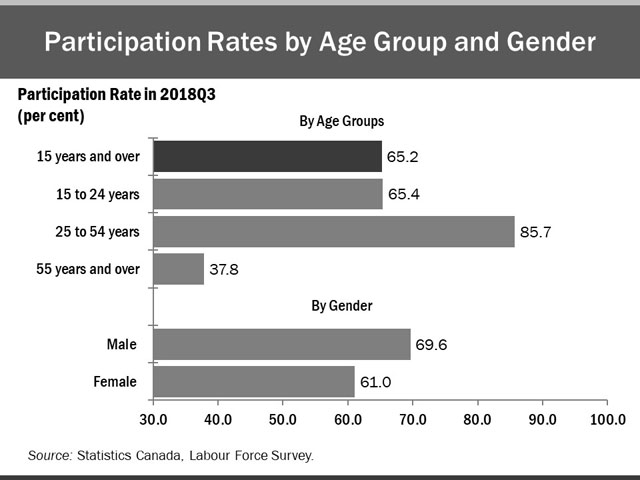
Quarterly labour force participation rates varied considerably among the economic regions. In the third quarter, participation rates ranged from 61.6% in Northern Ontario to 66.5% in the GTA.
Age and Gender Quarterly Details
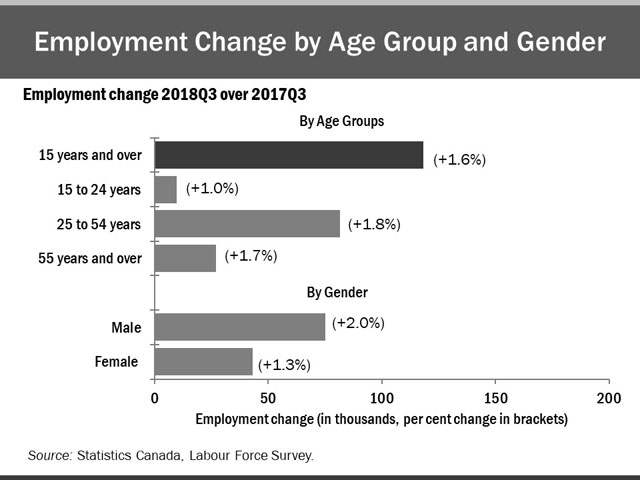
Compared to the same quarter last year, core-aged workers (25 to 54 years) gained the most jobs, followed by older workers (55 years and over), and youth (15 to 24 years). Core-aged workers experienced above-average employment growth rate (+1.8%).
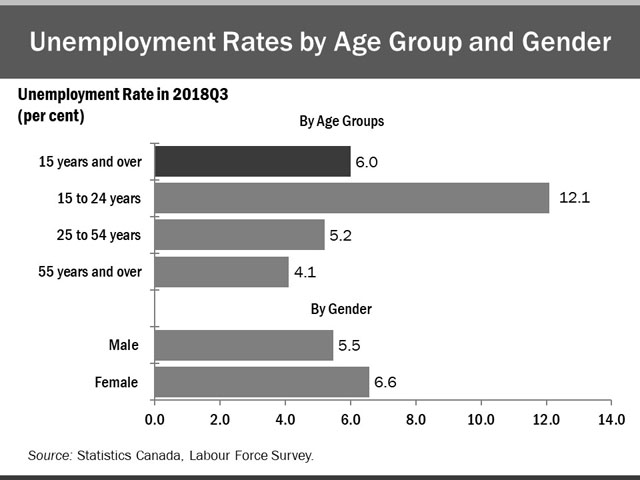
Compared to a year ago, the unemployment rate declined by 0.4 percentage points for males and increased by 0.4 percentage points for females. The unemployment rate of youth was 12.1%, the highest among the three age groups.
In the third quarter, core-aged workers had the highest participation rate at 85.7%, followed by youth at 65.4% and older workers at 37.8%. Compared to a year ago, the participation rate for youth increased by 0.4 percentage points. The participation rates for males and females slightly declined compared to a year ago.
Education Level and Immigrant Status Quarterly Details
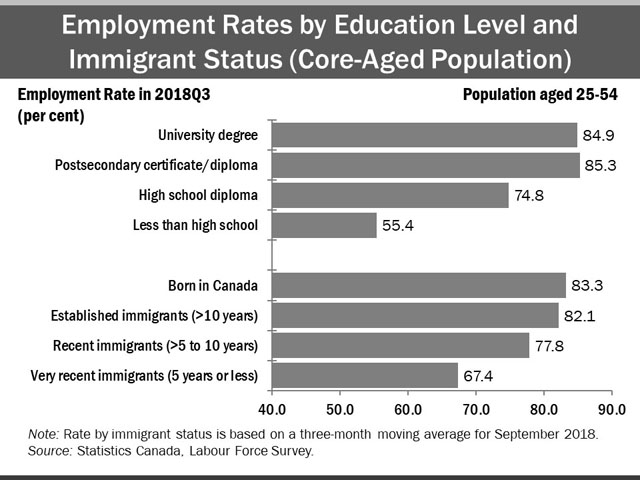
In the third quarter of 2018, persons lacking a high school diploma continued to hold the lowest employment rate among all groups (55.4%), while postsecondary certificate/diploma holders recorded the highest employment rate (85.3%), outpacing university degree holders for the first time since the third quarter in 2016.
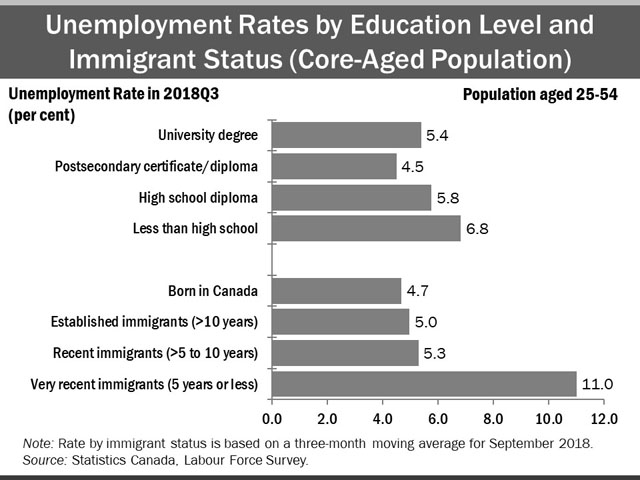
The unemployment rate declined, year-over-year, for all core-aged groups by educational attainment, except for university degree holders.
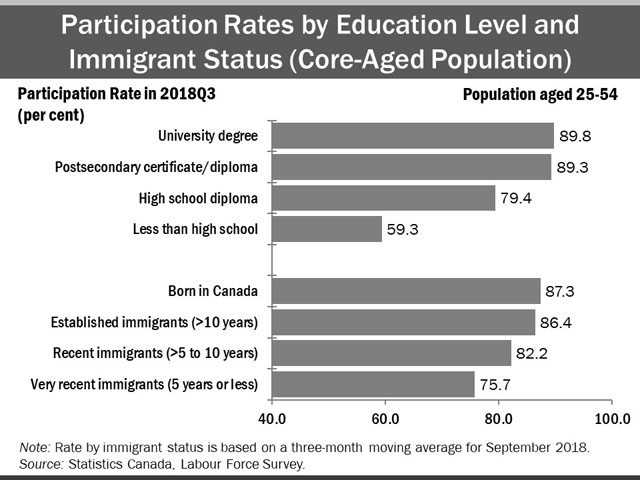
In the third quarter of 2018, core-aged recent immigrants (landed 5 to 10 years earlier) and very recent immigrants (landed 5 years or less) continued to have the lowest employment rates compared to established immigrants and those born in Canada, but their employment outcomes have improved in recent years.
Wages Quarterly Details
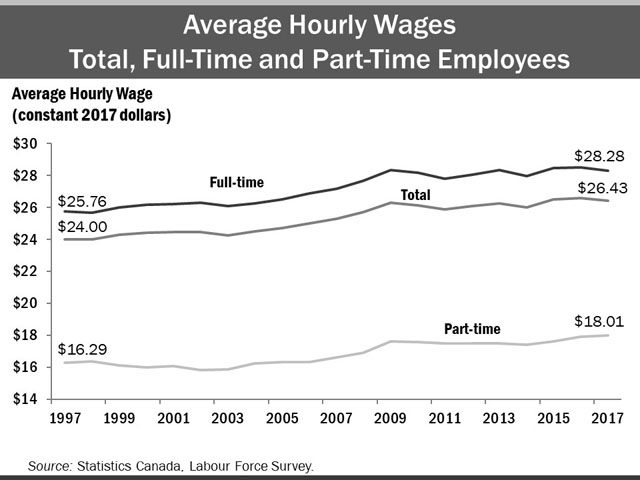
Over the last two decades, average hourly wages increased from $24.00 in 1997 (in constant 2017 dollars) to $26.43 in 2017, an average annual increase in real hourly wages of 0.5%. The average hourly wage of full-time employees was $28.28 in 2017, 9.8% higher than in 1997, while the average hourly wage of part-time employees was $18.01 in 2017, 10.6% higher than in 1997.
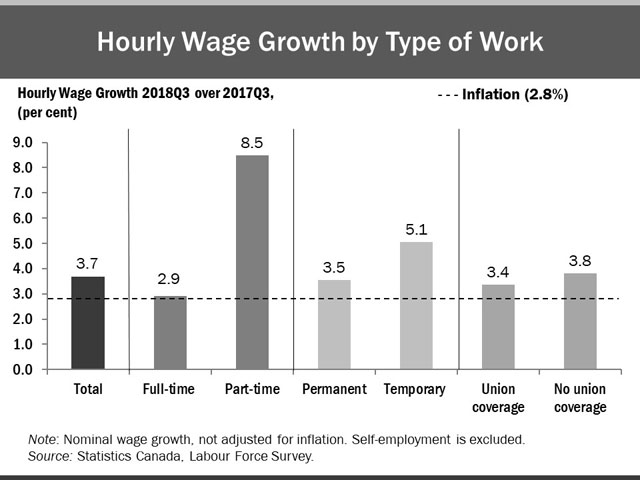
In the third quarter of 2018, the average hourly wage of Ontario employees was $27.25, an increase of 3.7% from the third quarter of 2017.
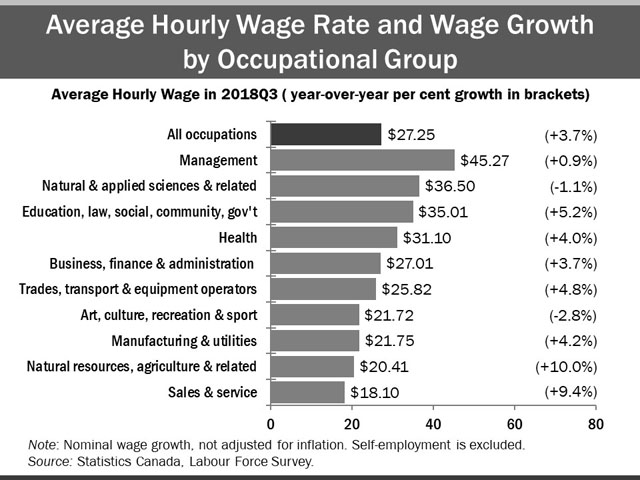
Employees in three broad occupational groups experienced the highest wage growth: natural resources, agriculture and related occupations (+10.0%); sales and service (+9.4%); and occupations in education, law and social, community and government services (+5.2%).
In Focus: Underutilized Labour
One of main objectives of monitoring labour markets is to assess the extent to which the economy is fully utilizing its available human resources. Labour underutilization hurts the supply and productivity of labour, which are important for Ontario’s long-term growth.
Number of Underutilized Workers Above Pre-Recession Level
In 2017, about 864,000 workers were underutilized in Ontario. This was down from the recessionary peak of 1,100,000 in 2009, but higher than the pre-recession level of 836,000 in 2008.
Underutilization Rate and Unemployment Rate Down Since Recession
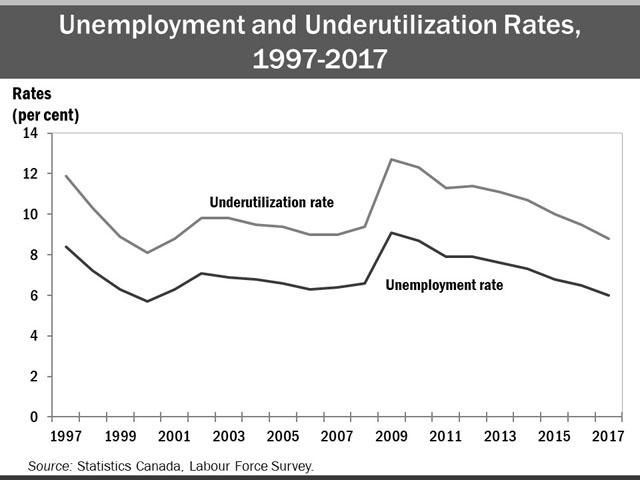
The underutilization rate divides all underutilized labour (in full-time equivalents) by the labour force plus underutilized workers not in the labour force. The underutilization rate closely mirrors the unemployment rate over time. The underutilization rate was 8.8% in 2017.
Youth Have a Higher Underutilization Rate
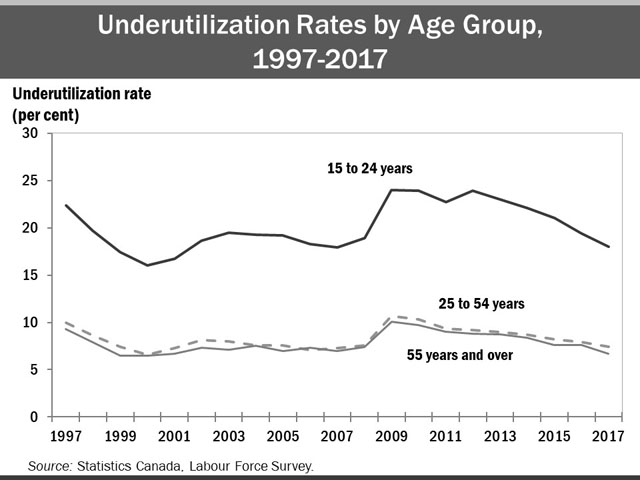
Over the last two decades, a relatively high share of youth (15 to 24 years) was underutilized compared to core-aged (25 to 54 years) and older workers (55 years and over). This is mostly due to youth having a higher unemployment rate and a greater share in part-time employment. The unemployment rate for youth has been consistently higher than the rate for core-aged and older workers. Almost half of youth were employed part-time in 2017, compared to about 14% of workers over 25 years of age.
Appendix
Overview of Annual Employment Ten-Year Review
| 2008 | 2009 | 2010 | 2011 | 2012 | 2013 | 2014 | 2015 | 2016 | 2017 | |
|---|---|---|---|---|---|---|---|---|---|---|
| Total Labour Force (000) | 7,074.4 | 7,080.2 | 7,160.9 | 7,227.4 | 7,276.4 | 7,383.8 | 7,418.6 | 7,426.1 | 7,489.5 | 7,579.8 |
| Participation Rate (%) | 67.7 | 67.0 | 66.8 | 66.6 | 66.2 | 66.3 | 65.8 | 65.2 | 65.0 | 64.9 |
| Male Participation Rate (%) | 72.5 | 71.5 | 71.1 | 71.1 | 70.7 | 70.5 | 70.3 | 70.0 | 69.5 | 69.2 |
| Female Participation Rate (%) | 63.1 | 62.6 | 62.8 | 62.3 | 61.9 | 62.2 | 61.6 | 60.7 | 60.7 | 60.7 |
| Total Employment (000) | 6,610.3 | 6,432.7 | 6,537.8 | 6,658.4 | 6,702.6 | 6,823.4 | 6,877.9 | 6,923.2 | 6,999.6 | 7,128.0 |
| - Full-time (000) | 5,366.8 | 5,174.0 | 5,256.1 | 5,373.5 | 5,412.0 | 5,489.5 | 5,540.0 | 5,618.2 | 5,672.6 | 5,778.7 |
| - Part-time (000) | 1,243.5 | 1,258.7 | 1,281.8 | 1,284.8 | 1,290.6 | 1,334.0 | 1,337.9 | 1,305.0 | 1,327.0 | 1,349.3 |
| Employment-Population Ratio (%) | 63.3 | 60.9 | 61.0 | 61.4 | 60.9 | 61.2 | 61.0 | 60.8 | 60.7 | 61.0 |
| Male Employment (000) | 3,445.0 | 3,300.8 | 3,363.6 | 3,450.4 | 3,471.5 | 3,522.8 | 3,567.1 | 3,607.1 | 3,635.9 | 3,700.9 |
| Female Employment (000) | 3,165.2 | 3,131.9 | 3,174.2 | 3,207.9 | 3,231.1 | 3,300.6 | 3,310.8 | 3,316.1 | 3,363.7 | 3,427.1 |
| Part-Time (% of total) | 18.8 | 19.6 | 19.6 | 19.3 | 19.3 | 19.6 | 19.5 | 18.8 | 19.0 | 18.9 |
| Goods-Producing Sector Employment (000) | 1,502.0 | 1,365.0 | 1,380.6 | 1,408.7 | 1,415.3 | 1,397.5 | 1,382.0 | 1,401.4 | 1,418.1 | 1,432.6 |
| Services-Producing Sector Employment (000) | 5,108.3 | 5,067.7 | 5,157.3 | 5,249.7 | 5,287.3 | 5,425.9 | 5,495.9 | 5,521.7 | 5,581.4 | 5,695.4 |
| Private Sector Employment (000) | 4,346.2 | 4,194.7 | 4,268.2 | 4,339.7 | 4,373.0 | 4,447.0 | 4,517.0 | 4,540.7 | 4,597.3 | 4,690.6 |
| Public Sector Employment (000) | 1,260.5 | 1,232.8 | 1,254.7 | 1,294.3 | 1,286.0 | 1,314.0 | 1,305.4 | 1,294.1 | 1,306.4 | 1,329.1 |
| Self-Employment (% of total) | 15.2 | 15.6 | 15.5 | 15.4 | 15.6 | 15.6 | 15.3 | 15.7 | 15.7 | 15.5 |
| Total Unemployment (000) | 464.1 | 647.5 | 623.1 | 569.1 | 573.8 | 560.3 | 540.7 | 502.9 | 489.9 | 451.8 |
| Unemployment Rate (%) | 6.6 | 9.1 | 8.7 | 7.9 | 7.9 | 7.6 | 7.3 | 6.8 | 6.5 | 6.0 |
| Male Unemployment Rate (%) | 6.9 | 10.5 | 9.4 | 8.2 | 8.3 | 8.0 | 7.5 | 7.0 | 6.8 | 6.2 |
| Female Unemployment Rate (%) | 6.2 | 7.7 | 8.0 | 7.6 | 7.5 | 7.2 | 7.1 | 6.5 | 6.3 | 5.7 |
| Long-Term (27 wks+) (% of total) | 13.7 | 18.8 | 24.9 | 24.1 | 22.7 | 22.9 | 22.8 | 20.0 | 19.9 | 19.5 |
| Average Unemployment in Weeks | 14.8 | 18.4 | 22.0 | 22.4 | 22.2 | 21.8 | 22.4 | 20.0 | 19.9 | 19.3 |
| Youth Unemployment Rate (%) | 13.8 | 17.6 | 17.4 | 15.9 | 17.0 | 16.2 | 15.7 | 14.7 | 14.0 | 12.3 |
| 25-54 y.o. Unemployment rate (%) | 5.3 | 7.8 | 7.3 | 6.5 | 6.4 | 6.2 | 5.9 | 5.6 | 5.4 | 5.0 |
| 55+ y.o. Unemployment rate (%) | 4.9 | 6.6 | 6.4 | 6.0 | 5.8 | 5.5 | 5.3 | 4.9 | 4.9 | 4.5 |
| Average Weekly Wage Rate ($) | 813.07 | 828.35 | 842.35 | 862.45 | 883.12 | 895.56 | 907.17 | 938.09 | 958.50 | 967.44 |
| Average Hourly Wage Rate ($) | 22.09 | 22.66 | 23.09 | 23.55 | 24.09 | 24.48 | 24.82 | 25.59 | 26.15 | 26.43 |
Source: Statistics Canada, Labour Force Survey.
| 2008 | 2009 | 2010 | 2011 | 2012 | 2013 | 2014 | 2015 | 2016 | 2017 | |
|---|---|---|---|---|---|---|---|---|---|---|
| Employment by Region (000) | ||||||||||
| Greater Toronto Area (GTA) | 3,023.4 | 2,963.0 | 3,034.6 | 3,077.8 | 3,112.3 | 3,240.2 | 3,241.1 | 3,320.4 | 3,373.2 | 3,442.9 |
| Central | 1,530.4 | 1,487.7 | 1,508.1 | 1,552.0 | 1,551.4 | 1,559.5 | 1,597.2 | 1,597.5 | 1,598.0 | 1,655.2 |
| Southwestern | 791.3 | 752.0 | 761.7 | 771.1 | 772.9 | 769.4 | 775.0 | 770.5 | 775.8 | 778.4 |
| Eastern | 897.9 | 879.2 | 879.6 | 897.0 | 908.7 | 898.4 | 907.9 | 889.2 | 904.9 | 903.4 |
| Northern | 367.2 | 350.8 | 354.0 | 360.4 | 357.3 | 355.9 | 356.6 | 345.5 | 347.7 | 348.2 |
| Unemployment Rate by Region (%) | ||||||||||
| Greater Toronto Area (GTA) | 6.9 | 9.6 | 9.2 | 8.4 | 8.8 | 8.2 | 8.0 | 7.1 | 6.9 | 6.4 |
| Central | 6.2 | 9.1 | 8.4 | 7.4 | 7.0 | 6.9 | 6.2 | 5.9 | 5.9 | 5.3 |
| Southwestern | 7.1 | 10.3 | 9.1 | 8.1 | 7.8 | 7.7 | 7.0 | 6.9 | 6.1 | 5.6 |
| Eastern | 5.4 | 6.8 | 7.2 | 6.7 | 6.6 | 6.6 | 7.0 | 6.7 | 6.4 | 5.7 |
| Northern | 6.7 | 9.0 | 8.3 | 7.8 | 7.2 | 7.4 | 6.6 | 7.2 | 7.1 | 6.4 |
| Total Employment by CMA (000) | ||||||||||
| GTA | ||||||||||
| Toronto | 2,866.4 | 2,817.0 | 2,880.3 | 2,923.4 | 2,960.6 | 3,092.1 | 3,087.4 | 3,176.7 | 3,215.0 | 3,289.6 |
| Oshawa | 181.3 | 175.1 | 184.3 | 189.0 | 190.0 | 194.5 | 201.4 | 196.4 | 214.0 | 210.4 |
| Central Ontario | ||||||||||
| Hamilton | 370.3 | 369.8 | 369.1 | 375.1 | 376.6 | 374.8 | 383.7 | 385.4 | 385.8 | 417.9 |
| Kitchener | 256.6 | 250.7 | 258.1 | 270.5 | 271.6 | 278.9 | 283.1 | 279.8 | 281.6 | 287.8 |
| St. Catharines-Niagara | 198.5 | 186.3 | 190.4 | 196.1 | 201.8 | 193.5 | 195.4 | 204.1 | 203.1 | 197.6 |
| Peterborough | 62.5 | 58.5 | 56.6 | 57.6 | 58.5 | 54.9 | 60.5 | 61.2 | 59.5 | 61.2 |
| Brantford | 68.7 | 68.6 | 67.4 | 68.5 | 67.5 | 68.9 | 68.6 | 69.3 | 70.2 | 72.3 |
| Guelph | 81.1 | 79.1 | 79.2 | 82.0 | 83.9 | 79.8 | 81.8 | 90.5 | 90.6 | 90.8 |
| Barrie | 98.2 | 90.3 | 99.1 | 101.5 | 102.3 | 109.4 | 111.6 | 108.4 | 104.2 | 115.6 |
| Eastern Ontario | ||||||||||
| Ottawa (Ontario part) | 508.3 | 500.4 | 515.3 | 517.4 | 535.4 | 523.5 | 533.8 | 531.1 | 543.4 | 546.7 |
| Kingston | 80.1 | 79.2 | 76.7 | 79.3 | 80.6 | 82.6 | 81.4 | 82.9 | 83.6 | 87.3 |
| Southwestern Ontario | ||||||||||
| London | 248.3 | 238.8 | 239.6 | 237.7 | 242.3 | 240.4 | 243.0 | 252.0 | 245.9 | 245.8 |
| Windsor | 154.8 | 146.4 | 147.5 | 147.9 | 153.3 | 154.8 | 155.2 | 158.0 | 164.1 | 162.8 |
| Northern Ontario | ||||||||||
| Sudbury | 82.5 | 79.8 | 80.7 | 82.1 | 80.8 | 83.3 | 83.1 | 82.3 | 81.7 | 81.1 |
| Thunder Bay | 62.3 | 60.0 | 60.2 | 60.3 | 61.8 | 62.8 | 61.5 | 59.7 | 60.1 | 61.5 |
Source: Statistics Canada, Labour Force Survey.
Overview of Quarterly Employment Year-over-Year
| 2016q4 | 2017q4 | 2017q1 | 2018q1 | 2017q2 | 2018q2 | 2017q3 | 2018q3 | |
|---|---|---|---|---|---|---|---|---|
| Total Labour Force (000) | 7,469.4 | 7,598.9 | 7,458.6 | 7,510.5 | 7,602.6 | 7,717.1 | 7,658.9 | 7,782.37 |
| Participation Rate (%) | 64.5 | 64.6 | 64.2 | 63.6 | 65.2 | 65.0 | 65.4 | 65.2 |
| Male Participation Rate (%) | 69.0 | 68.8 | 68.6 | 67.5 | 69.6 | 69.1 | 69.9 | 69.6 |
| Female Participation Rate (%) | 60.2 | 60.7 | 60.0 | 59.8 | 61.0 | 61.1 | 61.1 | 61.1 |
| Total Employment (000) | 7,041.6 | 7,213.4 | 6,972.0 | 7,082.3 | 7,129.7 | 7,269.2 | 7,197.0 | 7,315.2 |
| - Full-time (000) | 5,648.7 | 5,818.4 | 5,583.5 | 5,707.7 | 5,799.3 | 5,970.2 | 5,913.7 | 6,049.1 |
| - Part-time (000) | 1,392.9 | 1,394.9 | 1,388.5 | 1,374.7 | 1,330.4 | 1,299.0 | 1,283.3 | 1,266.0 |
| Employment-Population Ratio (%) | 60.8 | 61.4 | 60.0 | 60.0 | 61.2 | 61.2 | 61.5 | 61.3 |
| Male Employment (000) | 3,669.2 | 3,730.9 | 3,614.0 | 3,653.6 | 3,700.2 | 3,773.8 | 3,758.8 | 3,833.8 |
| Female Employment (000) | 3,372.4 | 3,482.5 | 3,358.0 | 3,428.7 | 3,429.5 | 3,495.4 | 3,438.2 | 3,481.3 |
| Part-Time (% of total) | 19.8 | 19.3 | 19.9 | 19.4 | 18.7 | 17.9 | 17.8 | 17.3 |
| Goods-Producing Sector Employment (000) | 1,423.2 | 1,465.2 | 1,368.0 | 1,406.8 | 1,424.9 | 1,451.7 | 1,472.2 | 1,491.0 |
| Services-Producing Sector Employment (000) | 5,618.4 | 5,748.2 | 5,604.1 | 5,675.6 | 5,704.7 | 5,817.5 | 5,724.8 | 5,824.2 |
| Private Sector Employment (000) | 4,628.0 | 4,744.9 | 4,561.5 | 4,620.0 | 4,666.5 | 4,756.9 | 4,789.5 | 4,810.7 |
| Public Sector Employment (000) | 1,322.1 | 1,347.1 | 1,332.9 | 1,352.3 | 1,351.3 | 1,396.9 | 1,285.1 | 1,373.5 |
| Self-Employment (% of total) | 15.5 | 15.5 | 15.5 | 15.7 | 15.6 | 15.4 | 15.6 | 15.5 |
| Total Unemployment (000) | 427.8 | 385.5 | 486.6 | 428.2 | 473.0 | 447.9 | 462.0 | 467.2 |
| Unemployment Rate (%) | 5.7 | 5.1 | 6.5 | 5.7 | 6.2 | 5.8 | 6.0 | 6.0 |
| Male Unemployment Rate (%) | 5.8 | 5.4 | 7.0 | 6.1 | 6.5 | 5.8 | 5.9 | 5.5 |
| Female Unemployment Rate (%) | 5.7 | 4.7 | 6.0 | 5.2 | 5.9 | 5.8 | 6.2 | 6.6 |
| Long-Term (27 wks+) (% of total) | 20.6 | 20.4 | 20.3 | 16.5 | 19.0 | 17.1 | 18.2 | 16.9 |
| Average Unemployment in Weeks | 20.1 | 20.2 | 20.4 | 17.3 | 18.9 | 17.5 | 17.9 | 16.8 |
| Youth Unemployment Rate (%) | 12.6 | 10.1 | 14.7 | 11.8 | 13.3 | 12.9 | 11.3 | 12.1 |
| 25-54 y.o. Unemployment rate (%) | 4.7 | 4.4 | 5.3 | 4.7 | 5.1 | 4.7 | 5.4 | 5.2 |
| 55+ y.o. Unemployment rate (%) | 4.3 | 3.9 | 5.3 | 5.0 | 4.7 | 4.2 | 4.1 | 4.1 |
| Average Weekly Wage Rate ($) | 956.30 | 979.94 | 957.27 | 994.55 | 962.03 | 1,007.28 | 970.13 | 1,004.23 |
| Average Hourly Wage Rate ($) | 26.23 | 26.80 | 26.34 | 27.28 | 26.28 | 27.43 | 26.28 | 27.26 |
Source: Statistics Canada, Labour Force Survey.
| 2016q4 | 2017q4 | 2017q1 | 2018q1 | 2017q2 | 2018q2 | 2017q3 | 2018q3 | ||
|---|---|---|---|---|---|---|---|---|---|
| Employment by Region (000) | |||||||||
| Greater Toronto Area (GTA) | 3,370.6 | 3,509.9 | 3,352.9 | 3,466.6 | 3,442.6 | 3,538.8 | 3,466.2 | 3,535.7 | |
| Central | 1,625.6 | 1,656.4 | 1,602.7 | 1,598.5 | 1,665.5 | 1,646.6 | 1,695.9 | 1,686.1 | |
| Southwestern | 776.3 | 789.5 | 768.4 | 775.2 | 772.9 | 801.3 | 782.8 | 810.3 | |
| Eastern | 923.9 | 908.2 | 914.1 | 905.4 | 897.6 | 924.4 | 893.8 | 917.9 | |
| Northern | 345.2 | 349.3 | 333.9 | 336.6 | 351.0 | 358.0 | 358.3 | 365.4 | |
| Unemployment Rate by Region (%) | |||||||||
| Greater Toronto Area (GTA) | 6.3 | 5.4 | 7.0 | 5.7 | 6.7 | 6.4 | 6.4 | 6.6 | |
| Central | 5.0 | 4.5 | 6.1 | 5.8 | 5.5 | 5.5 | 5.1 | 5.5 | |
| Southwestern | 5.2 | 5.1 | 6.1 | 5.9 | 5.5 | 5.0 | 5.5 | 5.5 | |
| Eastern | 5.1 | 4.8 | 5.3 | 5.0 | 6.4 | 4.8 | 6.5 | 5.1 | |
| Northern | 6.5 | 5.3 | 7.7 | 6.6 | 6.3 | 5.9 | 6.5 | 5.1 | |
| Total Employment by CMA (000) | |||||||||
| GTA | |||||||||
| Toronto | 3,206.30 | 3,351.0 | 3,204.7 | 3,305.7 | 3,289.1 | 3,363.4 | 3,313.7 | 3,361.9 | |
| Oshawa | 218.7 | 211.0 | 204.6 | 211.9 | 213.6 | 228.6 | 212.2 | 222.4 | |
| Central Ontario | |||||||||
| Hamilton | 398.0 | 423.3 | 396.5 | 407.7 | 419.3 | 414.3 | 432.4 | 412.4 | |
| Kitchener | 281.9 | 287.4 | 282.0 | 276.6 | 291.2 | 286.5 | 290.5 | 303.1 | |
| St. Catharines-Niagara | 206.8 | 198.5 | 191.0 | 195.4 | 198.8 | 204.4 | 202.2 | 205.1 | |
| Peterborough | 61.0 | 61.0 | 60.4 | 59.5 | 61.0 | 62.0 | 62.5 | 66.3 | |
| Brantford | 73.2 | 74.9 | 72.4 | 70.8 | 69.3 | 68.5 | 72.6 | 68.9 | |
| Guelph | 90.5 | 91.0 | 88.7 | 87.0 | 92.0 | 86.8 | 91.3 | 88.6 | |
| Barrie | 103.4 | 117.9 | 109.8 | 106.3 | 117.3 | 112.3 | 117.3 | 120.9 | |
| Eastern Ontario | |||||||||
| Ottawa (Ontario part) | 549.4 | 550.0 | 547.9 | 552.3 | 548.4 | 567.2 | 540.6 | 557.3 | |
| Kingston | 83.7 | 88.0 | 85.0 | 85.5 | 88.6 | 87.3 | 87.4 | 87.9 | |
| Southwestern Ontario | |||||||||
| London | 240.6 | 242.5 | 246.0 | 245.8 | 251.6 | 257.9 | 242.9 | 260.3 | |
| Windsor | 162.5 | 164.3 | 157.6 | 160.9 | 161.2 | 164.2 | 168.1 | 163.7 | |
| Northern Ontario | |||||||||
| Sudbury | 83.1 | 82.1 | 79.1 | 78.0 | 81.0 | 80.8 | 82.2 | 82.2 | |
| Thunder Bay | 59.9 | 61.2 | 59.3 | 62.2 | 62.1 | 65.7 | 63.4 | 65.3 |
Source: Statistics Canada, Labour Force Survey.
Footnotes
- footnote[1] Back to paragraph Underutilized workers include unemployed, underemployed (involuntary part-timers), those waiting for employment and discouraged searchers.
- footnote[2] Back to paragraph This economic region closely matches the GTA, the main exception being that it excludes the city of Burlington.
- footnote[3] Back to paragraph Year-over-year comparison (between third quarters of 2017 and 2018) is in nominal dollars.
- footnote[4] Back to paragraph Measured as an increase in the all-items Consumer Price Index for Ontario between the third quarter of 2017 and the third quarter of 2018.